

The paper
Shanto Iyengar and Sean J. Westwood (2015). Fear and Loathing across Party Lines: New Evidence on Group Polarization. American Journal of Political Science 59(3), 690–707.
doi:10.1111/ajps.12152 (opens in a new tab) · Replication data: doi:10.7910/DVN/26662 (opens in a new tab)
Main text
p. 691, introduction
Published
We further document that discrimination against the outgroup is based more on outgroup animus than ingroup favoritism.
Correction
We further document that discrimination against the outgroup reflects both outgroup animus and ingroup favoritism, which do not differ significantly in size.
Basis See the correction to p. 703.
p. 693, Study 1 design, and footnote 2
Published
We recruited a sample of 2,000 adults from the Survey Sampling International (SSI) panel. [...] We oversampled African Americans (500) in order to capture racial affect among nonwhites. [Footnote 2] After removing subjects with BIAT error rates above .35—the recommended filtering rate—and those who failed to complete the BIATs, we were left with a sample of 1,971.
Correction
We recruited adults from the Survey Sampling International (SSI) panel, of whom 3,064 completed both BIATs. [...] We oversampled African Americans (728 completed both BIATs) in order to capture racial affect among nonwhites.
Footnote 2: Of the 3,064 respondents who completed both BIATs, we removed 1,093 (35.7%) whose error rate on either BIAT was above .35—the recommended filtering rate—leaving a sample of 1,971. The error rate exceeded .35 for 32.7% of completers on the partisan BIAT and 13.6% on the race BIAT (mean error rates 0.29 and 0.18). Partisan affect exceeds racial affect at every cutoff in the table below.
Study 1 implicit party and race polarization (Cohen's d with the pooled within-group SD) by the BIAT error-rate cutoff applied to both BIATs. The published analysis uses .35. Error-rate cutoff N Party d (Republican vs. Democrat) Race d (white vs. African American) 0.20 838 1.36 0.68 0.30 1,520 1.17 0.67 0.35 1,971 1.06 0.63 0.40 2,360 1.01 0.63 None 3,064 0.87 0.52 Basis Counts of unique respondents in the deposited Study 1 files (partisanIAT-SSI.csv, dscoreWB.csv, dscoreLR.csv) joined as in IATScholarshipFull.R. The text implies that about 1.5% of a 2,000-person sample was removed; the error-rate rule removed 35.7% of BIAT completers. 421 African Americans remain in the analytic sample.
p. 693
Published
(see Nosek, Banaji, and Greenwald 1980)
Correction
(see Nosek, Banaji, and Greenwald 2002)
Basis The reference list gives the cited article as Nosek, Banaji, and Greenwald (2002), Group Dynamics.
p. 694
Published
There were traces of intransitivity in the explicit indicator, as strong Democrats were slightly less biased against Republicans than weak Democrats
Correction
There were traces of intransitivity in the implicit indicator, as strong Democrats were slightly less biased against Republicans than weak Democrats
Basis The means in this paragraph are partisan D-scores from the implicit BIAT (Figure 2).
p. 695
Published
Cohen’s d is .95 for the implicit measure, suggesting considerable division between Democrats and Republicans, but it is even higher (1.72) in the case of the net thermometer score
Correction
Cohen’s d is 1.06 for the implicit measure, suggesting considerable division between Democrats and Republicans, but it is even higher (2.94) in the case of the net thermometer score
Basis IATScholarshipFull.R divides the difference in means by the standard deviation of the two groups combined, which includes the difference between them. The corrected values divide by the pooled within-group standard deviation, as Cohen’s d is defined (Cohen 1988).
p. 696
Published
but the effect size for race (Cohen’s d = .61) was not nearly as strong as the corresponding effect of party (Cohen’s d = .95).
Correction
but the effect size for race (Cohen’s d = 0.63) was not nearly as strong as the corresponding effect of party (Cohen’s d = 1.06).
Basis Pooled within-group standard deviation (see the correction to p. 695). The party–race difference in d is 0.43 (bootstrap 95% interval [0.26, 0.60], 2,000 resamples of respondents).
pp. 696–697, “Partisan Affect among Independents and Leaners”
Published
As shown in Figure 5, among Independents in the SSI sample, the difference in Republican and Democratic feeling thermometer scores is slightly slanted toward Democrats (mean = 3.52, s.e. = 0.84, n = 697), t(696) = 4.19, p < .001. [...] Thus, Democratic leaners are significantly less affectively polarized than self-identified Democrats, t(466.93)= –15.02, p < .001), but significantly more polarized than Independents, t(516.52) = 9.98, p < .001. [...] and significantly more polarized than Independents with no leanings, t(317.25) = –12.13, p < .001.
Correction
As shown in Figure 5, among Independents in the SSI sample used in Studies 2 and 4, the difference in Republican and Democratic feeling thermometer scores is slightly slanted toward Democrats (mean = −3.52, s.e. = 0.84, n = 697), t(696) = −4.19, p < .001. [...] Thus, Democratic leaners are significantly less affectively polarized than self-identified Democrats, t(516.76) = −9.83, p < .001, but significantly more polarized than Independents, t(466.58) = 15.01, p < .001. [...] and significantly more polarized than Independents with no leanings, t(317.24) = −15.60, p < .001.
Basis Figure 5 sits in the Study 1 section, but its group sizes come from the survey used in Studies 2 and 4 (AJPSResponsivenessNegativity.csv, processed by ajps.R): Study 1 has 844 Democrats, against the figure’s 1,340. Under the figure’s Republican-minus-Democrat scale, the Independents’ mean is negative; in the deposited file it is −3.51 (n = 696). The Welch tests are recomputed from the printed means, standard errors and Ns; the published t(466.93) and t(516.52) belong to the Independent–leaner and Democrat–leaner comparisons respectively, and the Independent–Republican-leaner test changes with the sign of the Independents’ mean.
p. 698, Table 2
Published
President of the Future Investment Banker Club
Correction
President of the Future Business Leaders Club
Basis The deposited Study 2 data record the European American candidate’s activity as “Future Business Leaders Club.”
p. 699
Published
probability of a Republican selecting the Democrat was only .15 (95% confidence interval [.16, .35]) [...] Democratic leaners (b = –1.35, s.e. = .33, p < .05)
Correction
probability of a Republican selecting the Democrat was only .15 (95% confidence interval [.06, .35]) [...] Democratic leaners (b = –1.35, s.e. = .59, p < .05)
Basis Predicted probability from the logistic model in SI Table 9, which also reports the Lean Democrat standard error as .59.
p. 702, Study 3 results
Published
a mean of $4.17 (95% confidence interval [3.91, 4.43]) in the trust game, and a mean of $2.88 (95% confidence interval [2.66, 3.10]) in the dictator game. [...] representing a “bonus” of some 10% over the average allocation of $4.17. In the dictator game, copartisans were awarded 24% over the average allocation.
Correction
an estimated $4.17 (95% confidence interval [3.91, 4.43]) in the trust game, and $2.88 (95% confidence interval [2.66, 3.10]) in the dictator game, to opposing partisans of a different race (mean allocations across all rounds were $4.37 and $3.26). [...] representing a “bonus” of some 10% over the estimated allocation of $4.17 to opposing partisans of a different race. In the dictator game, copartisans were awarded 24% over the corresponding allocation.
Basis $4.17 and $2.88 are the intercepts of the SI Table 15 models, the predicted allocation to a Player 2 who is an opposing partisan of a different race.
p. 702, footnote 12
Published
Player 1’s dominant strategy in both games is to share with or entrust to Player 2 some amount of money.
Correction
Player 1’s payoff-maximizing strategy in both games is to keep the entire endowment.
Basis Giving nothing is the dominant strategy in the dictator game and the subgame-perfect strategy in the trust game. The sentence it annotates says that players chose not to profit maximize.
p. 702, footnote 14
Published
Republicans awarded 46 cents less to Democrats in the dictator game, but were slightly more generous in the trust game (by a margin of 23 cents).
Correction
Republicans awarded 46 cents less to Democrats in the dictator game, but were slightly more generous in the trust game (by a margin of 13 cents).
Basis Table 4: in the trust game Republicans gave Democrats $4.21 and Democrats gave Republicans $4.08.
p. 703, Study 4 design, and footnote 15
Published
We drew a sample of 1,252 members of the SSI panel in the winter of 2012. Participants were randomly assigned to complete either a dictator game or a trust game. [Footnote 15] Leaners were grouped with partisans.
Correction
We drew a sample of 2,529 members of the SSI panel in the winter of 2012. Participants were randomly assigned to complete either a dictator game (1,189) or a trust game (1,340), and 2,013 completed all four rounds.
Footnote 15: Leaners and Independents were excluded from the analysis, which includes the 1,221 self-identified Democrats and Republicans who completed all four rounds (644 in the dictator game and 577 in the trust game). With leaners grouped with partisans, the copartisan bonus and opposing partisan penalty are $0.60 and −$0.60 in the dictator game and $0.32 and −$0.47 in the trust game.
Basis ajps.R fits the Study 4 models to self-identified Democrats and Republicans only (SI Table 20: 644 and 577 respondents). The published 1,252 is the number of self-identified Democrats and Republicans who made at least one allocation (1,252), before the restriction to those who completed all four rounds; 2,529 respondents were assigned to the two games. Estimates with leaners use 818 and 746 respondents.
p. 703, Study 4 results
Published
and $0.30 (95% confidence interval [.08, .52]) in the trust game. [...] and a penalty of $0.63 (95% confidence interval [–.85, –.41]) for opposing partisans in the trust game.
Correction
and $0.29 (95% confidence interval [.07, .51]) in the trust game. [...] and a penalty of $0.64 (95% confidence interval [−.86, −.42]) for opposing partisans in the trust game.
Basis One trust-game allocation in the deposited data is −$5, outside the $0–$10 range, and the published model includes it. These estimates set it to missing; see the correction to SI Table 20. Figure 9’s trust-game panel moves by about one cent.
p. 703, Study 4 results
Published
They remain, however, more punitive and untrusting of opposing partisans (with the opposing partisan penalty amounting to almost twice the copartisan bonus). [...] Outgroup animosity is more consequential than favoritism for the ingroup
Correction
They remain, however, more punitive and untrusting of opposing partisans (with the opposing partisan penalty amounting to almost twice the copartisan bonus, a difference of $0.33 that is not statistically significant; SE = 0.20, p = 0.09). [...] In the dictator game, the opposing partisan penalty and the copartisan bonus are the same size (penalty minus bonus = −0.04, SE = 0.15, p = 0.81). These data do not show that outgroup animosity is more consequential than favoritism for the ingroup.
Basis Wald tests of the absolute opposing-partisan penalty minus the copartisan bonus in the SI Table 20 models, as published. With the out-of-range trust allocation set to missing, the trust-game difference is $0.35 (p = 0.07); with leaners grouped with partisans, as footnote 15 states, it is $0.15 (p = 0.37).
p. 704, Discussion
Published
Our comparisons across indicators of implicit and explicit party affect revealed no differences in the degree of affective polarization; if anything, conventional survey measures may be somewhat inflated.
Correction
Our comparisons across indicators of implicit and explicit party affect revealed more affective polarization on the explicit measure (Cohen’s d = 2.94) than on the implicit measure (Cohen’s d = 1.06); conventional survey measures may be somewhat inflated.
Basis Study 1 (p. 695) reports the explicit effect as the larger one and concludes that cognitive processing exacerbates affective polarization. Effect sizes as corrected on p. 695.
p. 706, references
Published
Committee on Political Parties. 1950. “Toward a More Responsible Two-Party System.” American Political Science Review 44(3). doi:10.1002/ncr.4110391113. Grimmer, Justin, and Gary King. 2011. “General Purpose Computer-Assisted Clustering and Conceptualization.” Proceedings of the National Academy of Sciences 108(7): 264–350.
Correction
Committee on Political Parties. 1950. “Toward a More Responsible Two-Party System.” American Political Science Review 44(3), Part 2, Supplement.
Grimmer, Justin, and Gary King. 2011. “General Purpose Computer-Assisted Clustering and Conceptualization.” Proceedings of the National Academy of Sciences 108(7): 2643–50.
Basis The printed DOI belongs to an article in the National Civic Review.
p. 707, references
Published
Jost, John T., Jack Glaser, Arie W. Kruglanski, and Frank J. Sulloway. 2003. “Political Conservatism as Motivated Social Cognition.” Psychological Bulletin 129(3): 3–39. Klofstad, Casey A., Rose McDermott, and Peter K. Hatemi. 2012. “The Dating Preferences of Liberals and Conservatives.” Political Behavior 35(3): 1–20.
Correction
Jost, John T., Jack Glaser, Arie W. Kruglanski, and Frank J. Sulloway. 2003. “Political Conservatism as Motivated Social Cognition.” Psychological Bulletin 129(3): 339–75.
Klofstad, Casey A., Rose McDermott, and Peter K. Hatemi. 2012. “The Dating Preferences of Liberals and Conservatives.” Political Behavior 35(3): 519–38.
Basis Klofstad et al.: The publisher’s metadata for the article (doi:10.1007/s11109-012-9207-z) give volume 35, issue 3, pp. 519–538. The article was published online on July 6, 2012, which matches the year in the reference and in the citation on p. 692, and appeared in the September 2013 issue.
Supplementary information
SI p. 50, section 1.4.1 and Table 2
Published
Table 2 shows, using logistic regression, that the partisan D-score significantly predicts presidential candidate support (b=0.187, se=0.018, p<.001). [...] Table 2 [...] Nagelkerke R-sq. 0.557 [...] Results from logistic regression.
Correction
Table 2 shows, using logistic regression, that the partisan D-score significantly predicts presidential candidate support (b=1.705, se=0.185, p<.001).
Corrected SI Table 2: logistic regression of the supported candidate (Obama = 0, Romney = 1). Standard errors in parentheses; * p < .05; ** p < .01; * p < .001. Term Estimate (Intercept) −0.449* (0.122) Partisan D-score 1.705* (0.185) Democrat −2.205* (0.207) Republican 2.138* (0.214) Nagelkerke R-sq. 0.634 Log-likelihood −444.488 AIC 896.975 BIC 917.732 N 1,325 Basis IATScholarshipFull.R calls glm() without a family argument, so the published estimates (b = 0.187, log-likelihood −392.319, AIC 794.639) come from a linear probability model. The corrected table is the logistic regression the text describes, with Nagelkerke’s R-squared computed from the logistic likelihood.
SI p. 51, section 1.4.2
Published
Table 2 shows that the partisan D-score is related to affect for the major party candidates for president. [...] decreases feeling toward Barack Obama by 12.469 (se=1.293, p<.001)
Correction
Table 3 shows that the partisan D-score is related to affect for the major party candidates for president. [...] decreases feeling toward Barack Obama by 12.569 (se=1.293, p<.001)
Basis SI Table 3 reports the Obama coefficient as −12.569.
SI p. 54, Figure 1 (Study 1 age)
Published
Figure 1, “Age”: horizontal axis from 1920 to 2000
Correction
Corrected Figure 1, with age in years (mean 47.1).
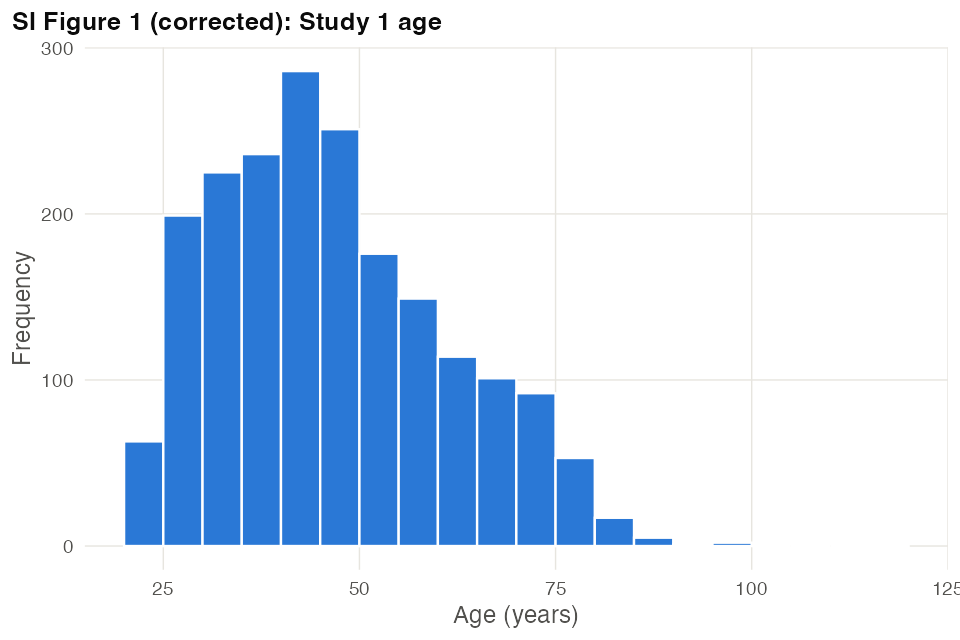
Basis The published figure plots 2012 minus the age item (Q45), which is not an age. The corrected figure converts the item as Q45 + 17, the conversion the authors’ ajps.R applies to the same item in Studies 2 and 4.
SI p. 56, Table 10
Published
Table 10: “Affectivep [sic] Polarization” 2.49∗ (0.59); “Republican” 0.02 (0.21); “(Intercept)” −0.95∗ (0.42); “Log Likelihood” −284.19; “Num. obs.” 470
Correction
Corrected Table 10. Affective polarization predicts selecting the copartisan more strongly: 3.98 (SE 0.71).
Corrected SI Table 10: logistic regression of selecting the copartisan candidate, with leaners coded by the party they lean toward. Affective polarization is the in-party minus out-party thermometer rescaled to 0-1. Standard errors in parentheses; * p < 0.05. Term Model 1 (Intercept) −1.33* (0.48) Republican −0.06 (0.25) Affective Polarization 3.98* (0.71) AIC 457.35 BIC 469.81 Log Likelihood −225.68 Deviance 451.35 Num. obs. 470 Basis The published estimates code the outcome backwards for the 95 leaners in the model: a Lean Democrat who chose the Democrat, or a Lean Republican who chose the Republican, is coded as not choosing the copartisan (ajps.R).
SI p. 66, Figure 7 (Study 3 age)
Published
Figure 7, “Age”: horizontal axis from −2000 to −1920
Correction
Corrected Figure 7, with age in years (mean 52.0; N = 814).
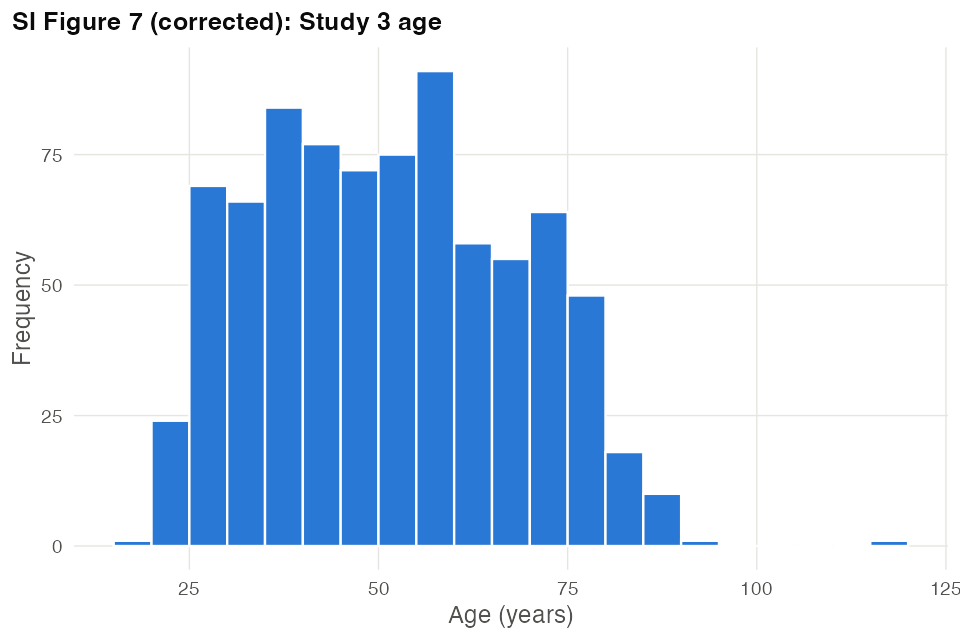
Basis trustSSI.R computes age as the age item (Q30) minus 2012, which gives negative values. The corrected figure converts the item as Q30 + 17, the conversion ajps.R applies to the same item in Studies 2 and 4.
SI p. 67, Table 20, trust-game column
Published
Table 20, “Trust Game” column: “(Intercept)” 4.29∗ [4.08; 4.51]; “Co-Partisan” 0.30∗ [0.08; 0.52]; “Independent” −0.11 [−0.34; 0.11]; “Opposing Partisan” −0.63∗ [−0.85; −0.41]; “Num. obs.” 2308
Correction
Corrected trust-game column of Table 20, with the out-of-range allocation set to missing. The dictator-game column is unchanged.
Corrected SI Table 20, trust-game column: the allocation outside the $0-$10 range is set to missing. Multilevel model with individual random effects; 95% confidence intervals in brackets; * 0 outside the 95% confidence interval. Term Trust Game (Intercept) 4.30* [4.09; 4.52] Co-Partisan 0.29* [0.07; 0.51] Independent −0.13 [−0.35; 0.10] Opposing Partisan −0.64* [−0.86; −0.42] AIC 10439.78 BIC 10474.24 Log Likelihood −5213.89 Deviance 10427.78 Num. obs. 2307 Num. groups: psid 577 Variance: psid.(Intercept) 3.16 Variance: Residual 3.70 Basis One trust-game allocation in the deposited AJPSResponsivenessNegativity.csv is −$5 with $15 kept, which the $0–$10 rule does not allow; the published model includes it.
SI pp. 68–69, Tables 21–24 (Study 4 sample composition)
Published
Tables 21–24 (“Gender”, “Race”, “Highest Level of Education”, “PID”); the counts in each table sum to 1,033
Correction
Corrected Tables 21–24, covering both games. The published tables describe only the 1,033 dictator-game respondents who completed all four rounds; the 980 trust-game respondents were omitted.
Corrected SI Tables 21-24: Study 4 respondents who completed all four rounds, by game. The deposited file lacks the authors' completion indicator; with all four allocations as the completion rule, the dictator-game column matches the published tables in total (1,033) and gender, and differs by at most two respondents in other cells. Table Category Dictator game Trust game Both Table 21: Gender Male 513 496 1,009 Table 21: Gender Female 520 484 1,004 Table 22: Race White 540 527 1,067 Table 22: Race African American 213 181 394 Table 22: Race Hispanic 114 102 216 Table 22: Race Asian 112 98 210 Table 22: Race Native American 15 24 39 Table 22: Race Pacific Islander 6 9 15 Table 22: Race Other 33 39 72 Table 23: Highest Level of Education < High School 14 16 30 Table 23: Highest Level of Education High School/GED 193 193 386 Table 23: Highest Level of Education Some College 300 285 585 Table 23: Highest Level of Education 2-year College Degree 110 121 231 Table 23: Highest Level of Education 4-year College Degree 285 247 532 Table 23: Highest Level of Education Masters Degree 96 93 189 Table 23: Highest Level of Education Doctoral Degree 15 13 28 Table 23: Highest Level of Education Professional Degree (JD/MD) 20 12 32 Table 24: PID Democrat 442 391 833 Table 24: PID Lean Democrat 101 91 192 Table 24: PID Independent 215 229 444 Table 24: PID Lean Republican 72 78 150 Table 24: PID Republican 203 186 389 Basis ajps.R tabulates the composition tables from the dictator-game subset only.
SI p. 70, references
Published
Cesarini, D., [...] Proceedings of the National Academy of sciences 105(10): 372126. Cunningham, W. A., [...] Psychological science 12(2): 16370. Greenwald, Anthony G., Debbie E. McGhee, and Jordan L. K. Schwartz. 1998. [...] Journal of Personality and Social Psychology 74(6): 146480. Sriram, N, and Anthony G. Greenwald. 2009. [...] Experimental Psychology 56(4): 28394.
Correction
Cesarini, D., [...] Proceedings of the National Academy of Sciences 105(10): 3721–26.
Cunningham, W. A., [...] Psychological Science 12(2): 163–70.
Greenwald, Anthony G., Debbie E. McGhee, and Jordan L. K. Schwartz. 1998. [...] Journal of Personality and Social Psychology 74(6): 1464–80.
Sriram, N, and Anthony G. Greenwald. 2009. [...] Experimental Psychology 56(4): 283–94.