

Executive summary
Skepticism about the value of college is easing but remains the majority view. The share saying a four-year degree is worth the cost rose from 19% to 25% over six months, yet 58% still say it is not, and given a concrete choice, 52% would advise a young person to learn a trade rather than attend any college. Views of the sector split almost exactly into thirds — 33% positive effect on the country, 32% negative, 35% neither.
The public funds the mission even where it doubts the product. Seventy percent support federal funding of university research and 61% support federal student loans. Majorities reject using research money as political leverage on every goal tested but one: 53% would allow withholding funds to press universities to combat antisemitism on campus.
Concern about campus ideology is hardening. The share calling the faculty party imbalance a serious problem rose from 21% to 25%, support for considering political viewpoints in hiring rose from 15% to 23% — the largest movement in the survey. At the same time, respondents assign the fix to universities themselves (46%), not to government (13% combined).
Partisan conflict is narrow but deep. Democrats and Republicans are nearly indistinguishable on the academic core — English, mathematics, history, the sciences — whether asked about required courses or which departments a university must maintain. They diverge almost exclusively on identity-centered fields: a 46-point party gap on requiring a race, gender, or diversity course, and 43% and 36% of Republicans would cut gender and sexuality studies and African American / ethnic studies departments outright, against 7% and 2% of Democrats.
A randomized experiment shows the partisanship is symmetric. Support for choosing an underrepresented job candidate is identical — about 20% — whether the candidate is a conservative or a person of color. Underneath, each party supports the preference for its own side (roughly 39%) and rejects the same preference for the other (7–10%).
The public wants institutions out of politics. Sixty-four percent say universities should remain neutral on controversies, and the AAUP’s first-ever political endorsement is disapproved 42% to 19%.
What changed since February
| Question | Measure | Feb 2026 | Aug 2026 | Change |
|---|---|---|---|---|
| Four-year degree worth the cost | % Yes | 19% | 25% | +6 pts* |
| Reasonable to take out student loans | % Agree | 38% | 31% | −7 pts* |
| SAT/ACT should be required | % Required | 36% | 40% | +4 pts |
| Professors push a liberal agenda | % Liberal agenda | 43% | 39% | −4 pts |
| Faculty party imbalance | % Serious problem | 21% | 25% | +4 pts* |
| Consider viewpoints in faculty hiring | % Support | 15% | 23% | +8 pts* |
| Universities should stay neutral | % Remain neutral | 60% | 64% | +4 pts |
| Who should fix the faculty imbalance | % Universities themselves | 44% | 46% | +2 pts |
| Would still get their degree (graduates) | % Yes | 83% | 84% | +1 pt |
| Has outstanding student loans | % Yes | 13% | 12% | −1 pt |
| * change exceeds the 95% margin of error. |
The movement runs in higher education’s favor on cost questions (worth the cost up 6 points) but against it on ideology questions: the share calling the faculty party imbalance a serious problem rose 4 points, and support for considering political viewpoints in faculty hiring rose 8 points. Attitudes toward student loans soured even as the value of the degree recovered — the share agreeing that loans are a reasonable way to pay for college fell 7 points.
1 General Views of Higher Education
Views of colleges’ effect on the country split into thirds
“Overall, do you think colleges and universities have a positive or negative effect on the way things are going in this country?”

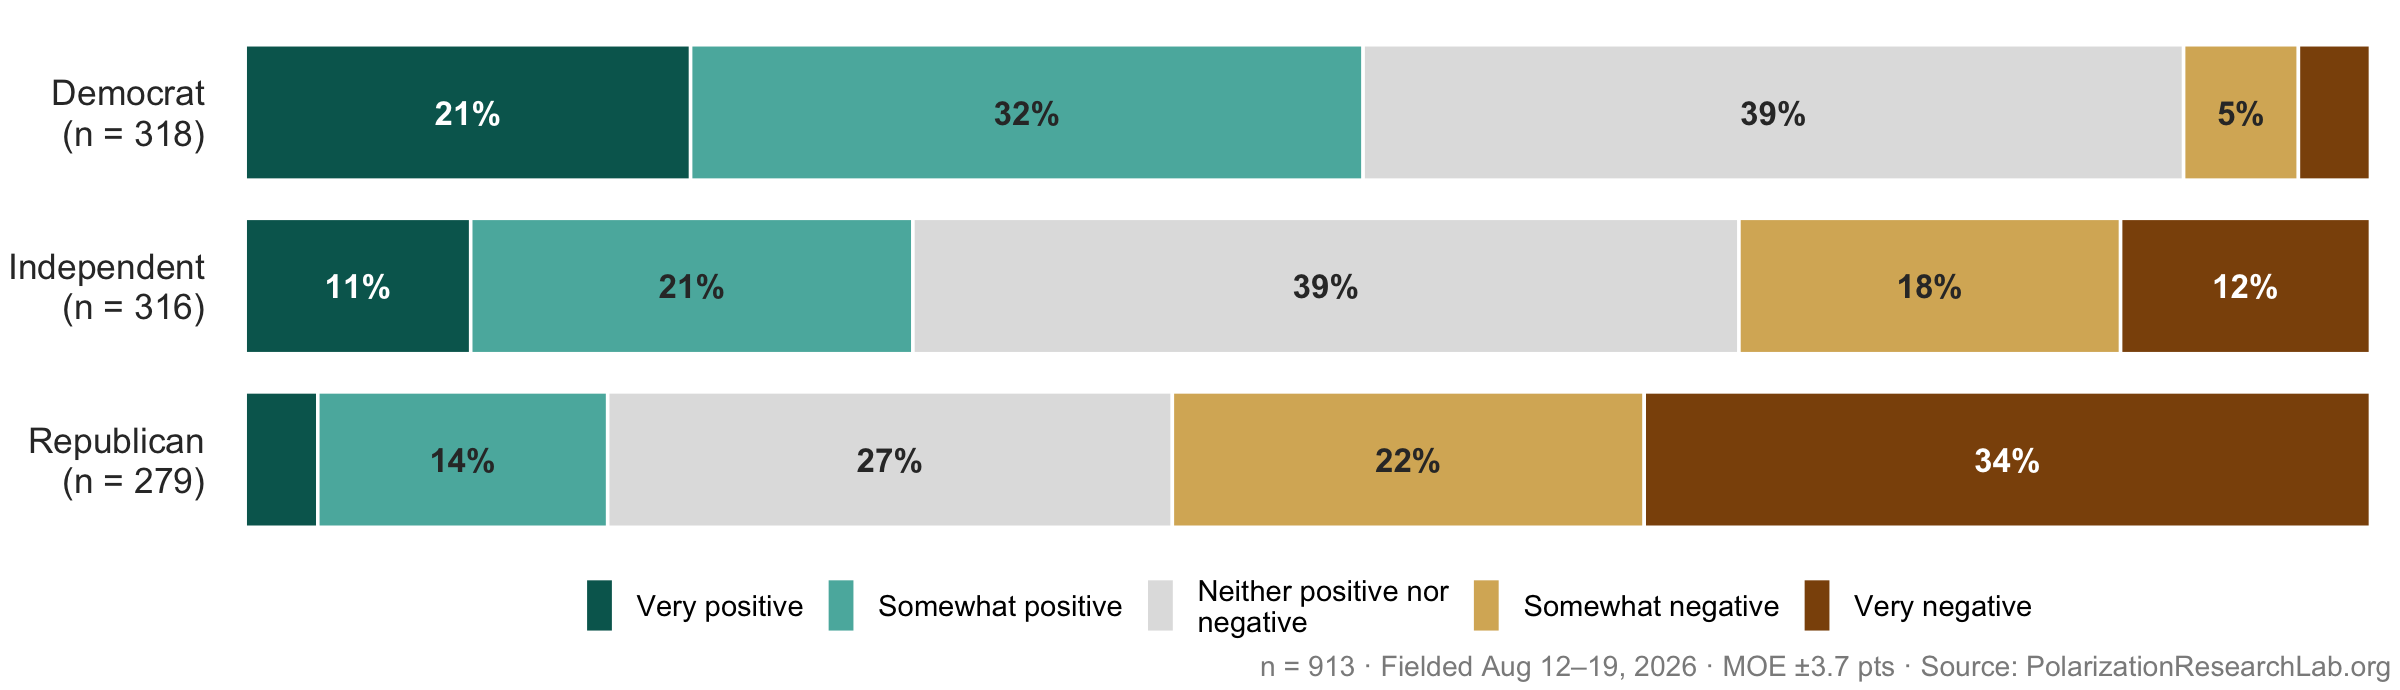
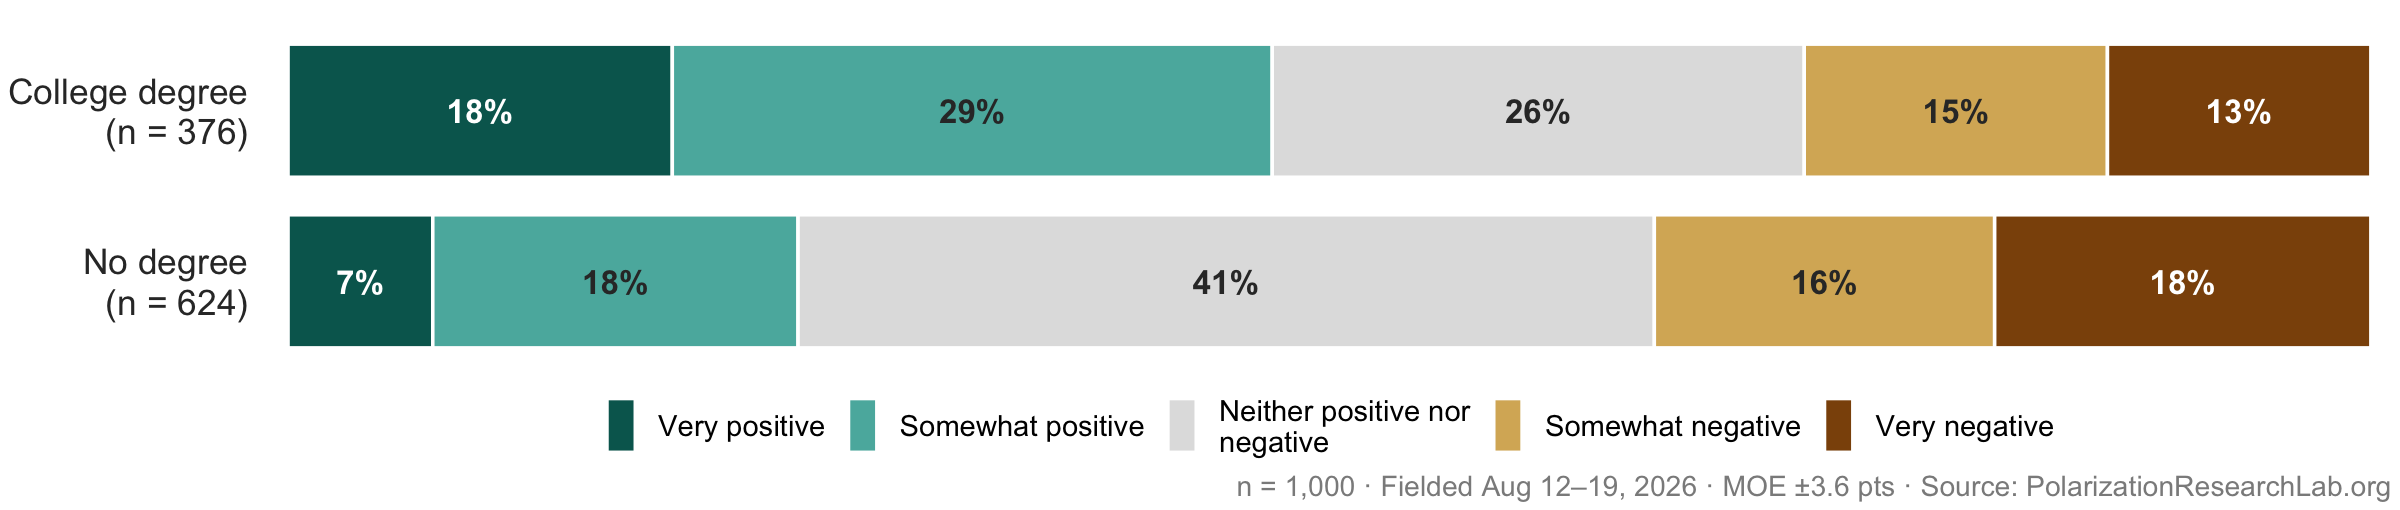
Opinion divides into near-equal thirds: 33% positive, 32% negative, and 35% neither. The plurality choosing the middle category means neither side of the higher-education debate can claim a public mandate. The party gap is wide but not absolute — a substantial share of Democrats decline to rate the sector positively, and most Republicans choose “negative” rather than the most extreme option.
A majority still says a degree is not worth the cost, but doubt is receding
“Do you think a four-year college degree is worth the cost for most people?”
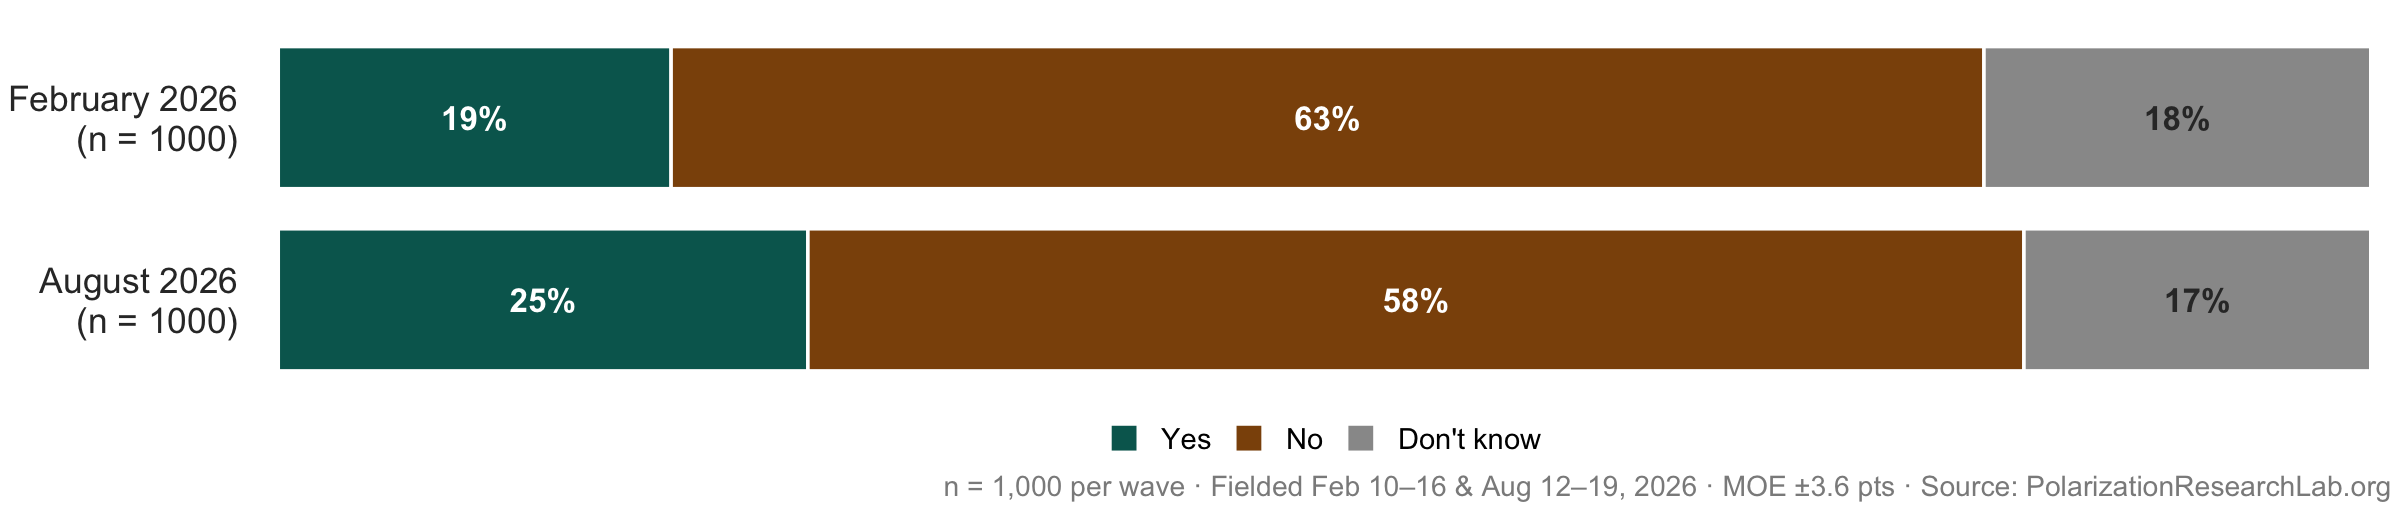
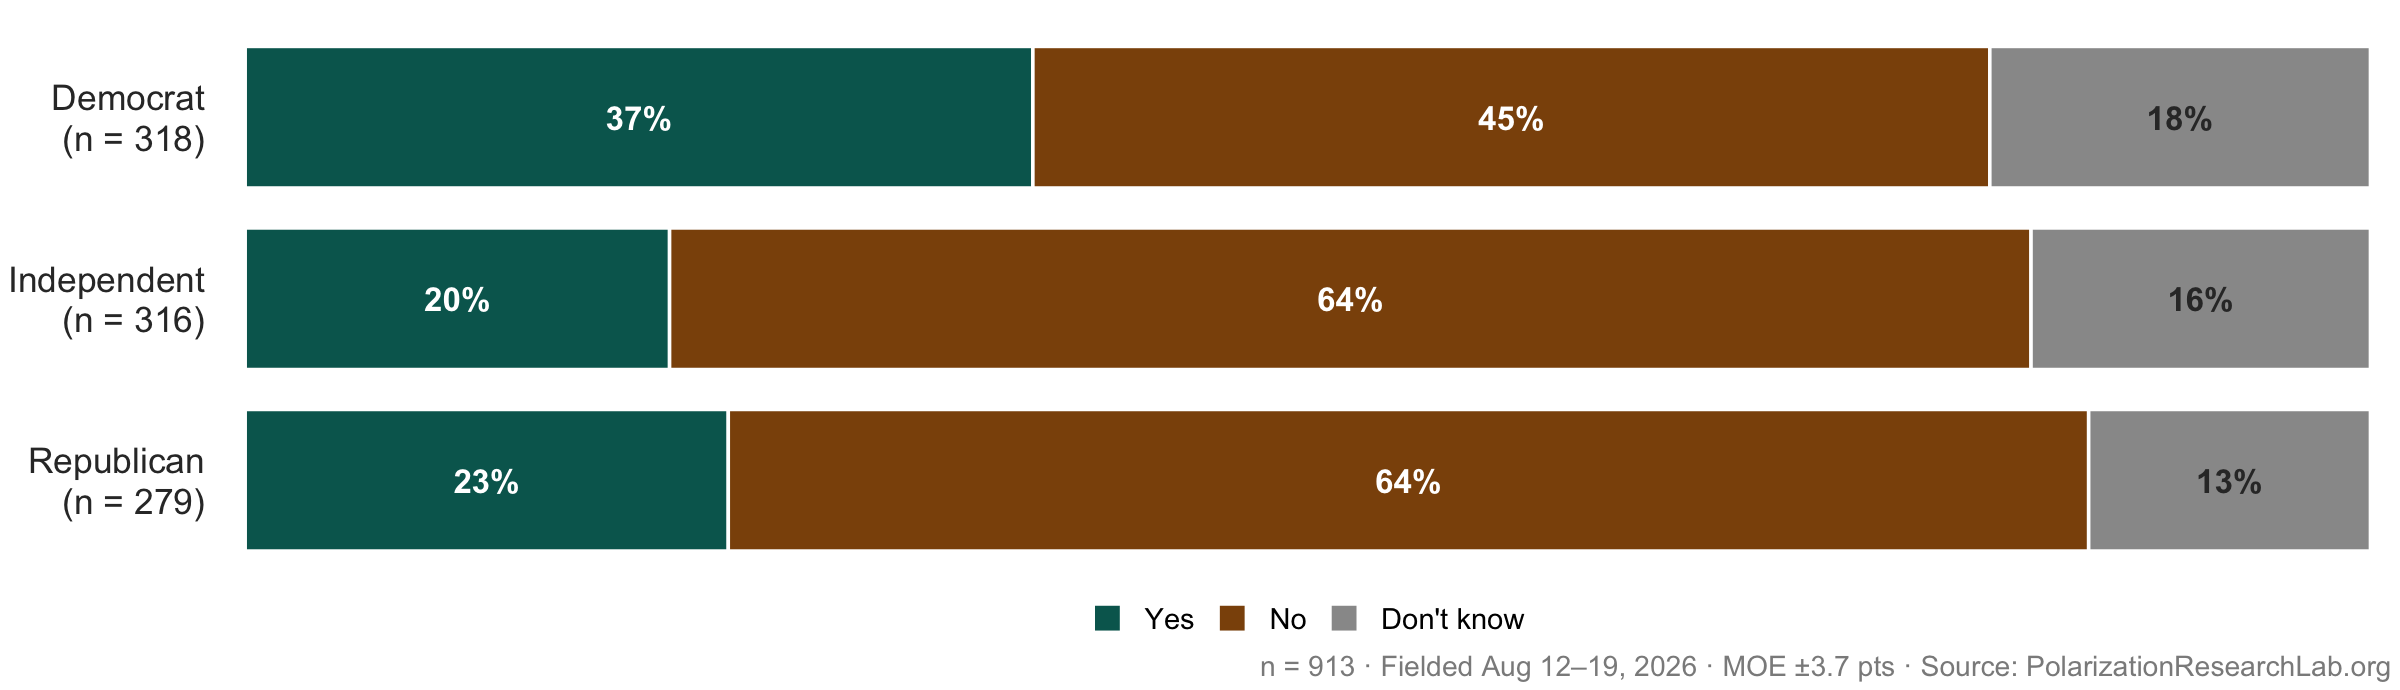
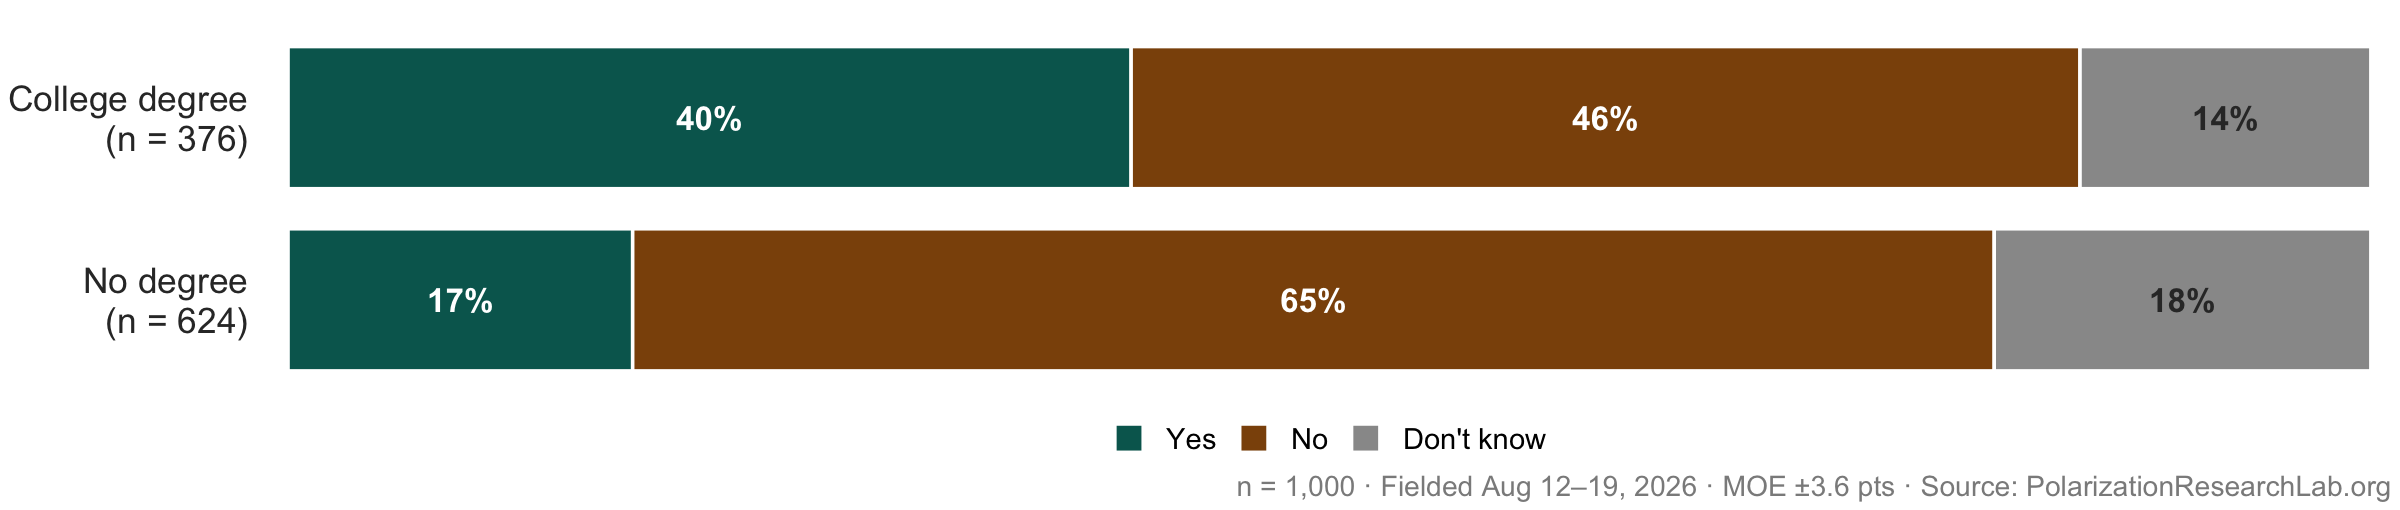
This is the largest improvement in the survey: “worth it” rose from 19% to 25%. Even so, doubters outnumber believers by more than two to one, and the doubt is bipartisan — no party group comes close to majority agreement that the degree is worth its cost.
The public sees AI eroding the value of a degree
“Does the rise of artificial intelligence make a four-year college degree more valuable, less valuable, or does it make no difference?”

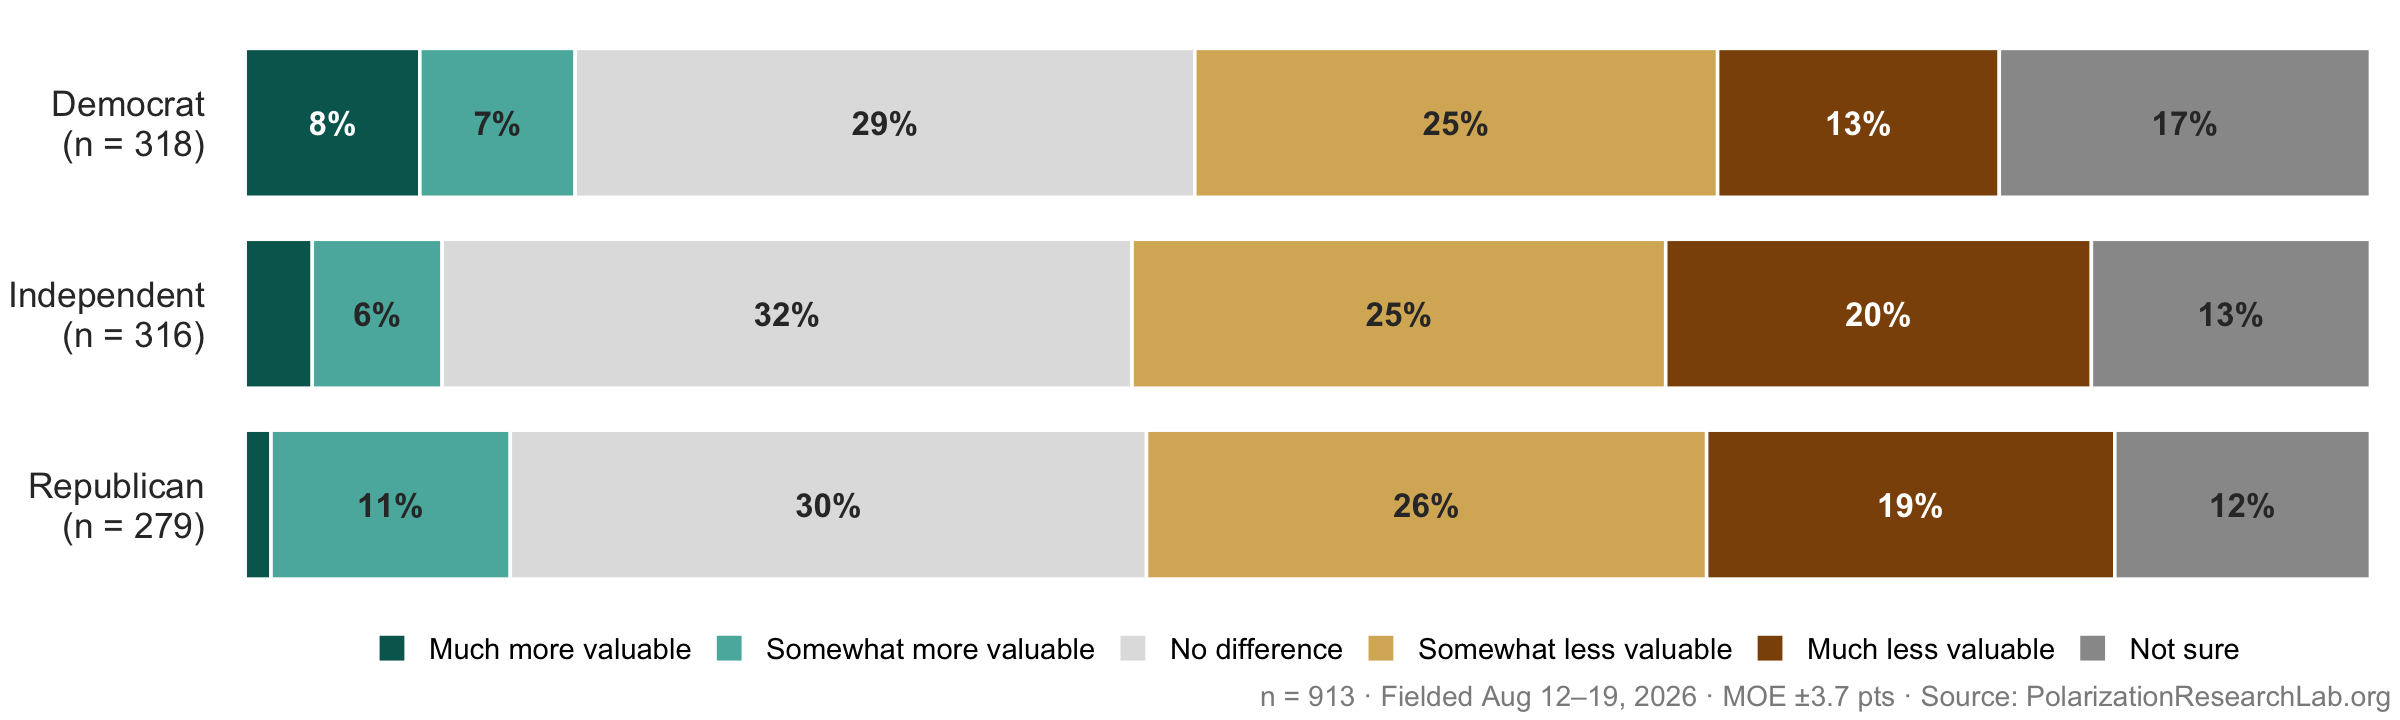
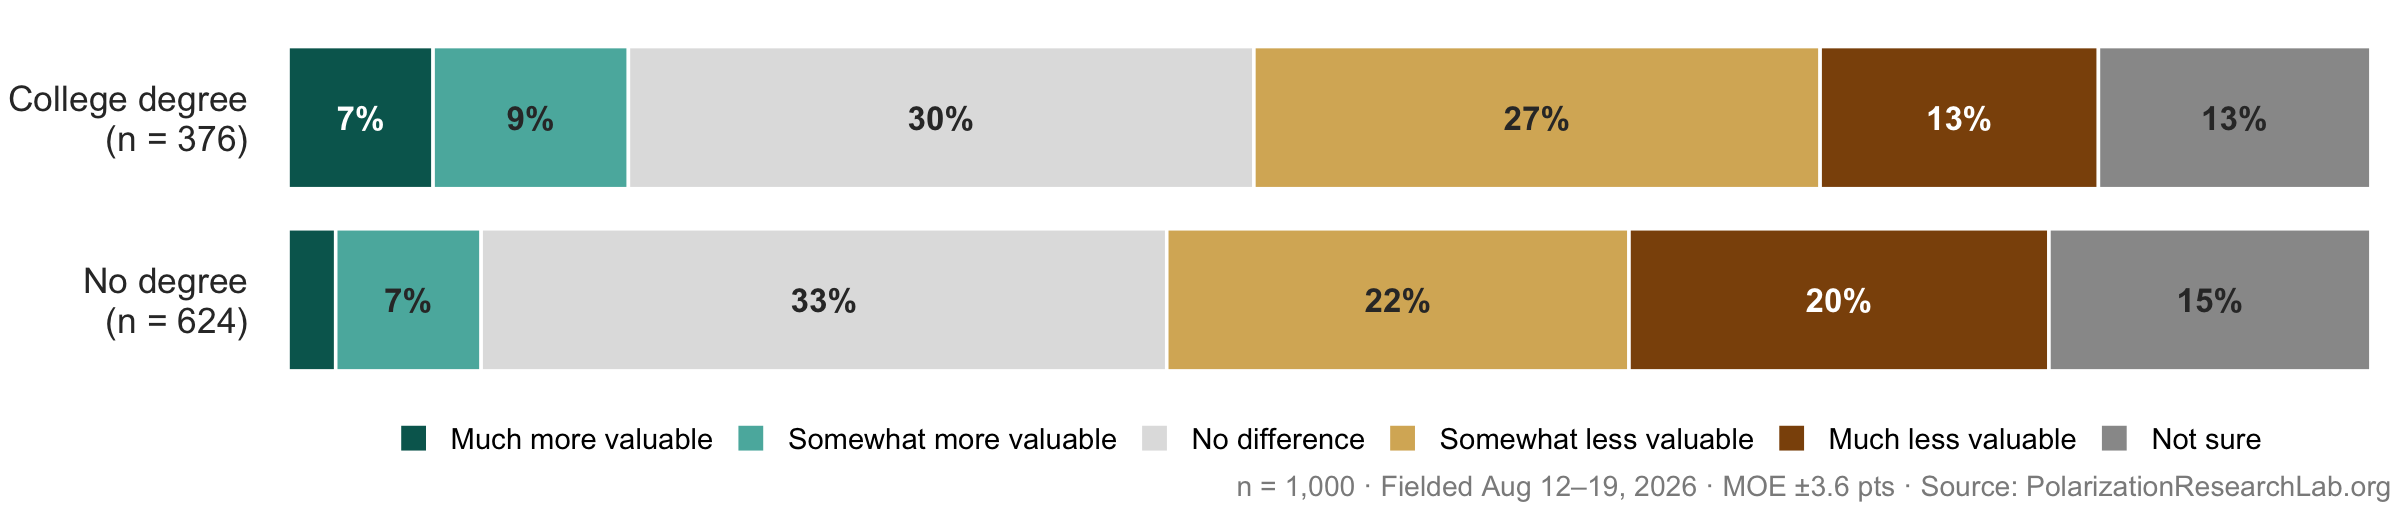
The public reads AI as a threat to the degree, not a complement: 42% say AI makes a degree less valuable, against 12% who say more valuable. About a third (32%) expect no difference, and 15% are not sure.
Half would advise a young person to learn a trade
“If a young person you cared about finished high school today, what would you advise them to do?”

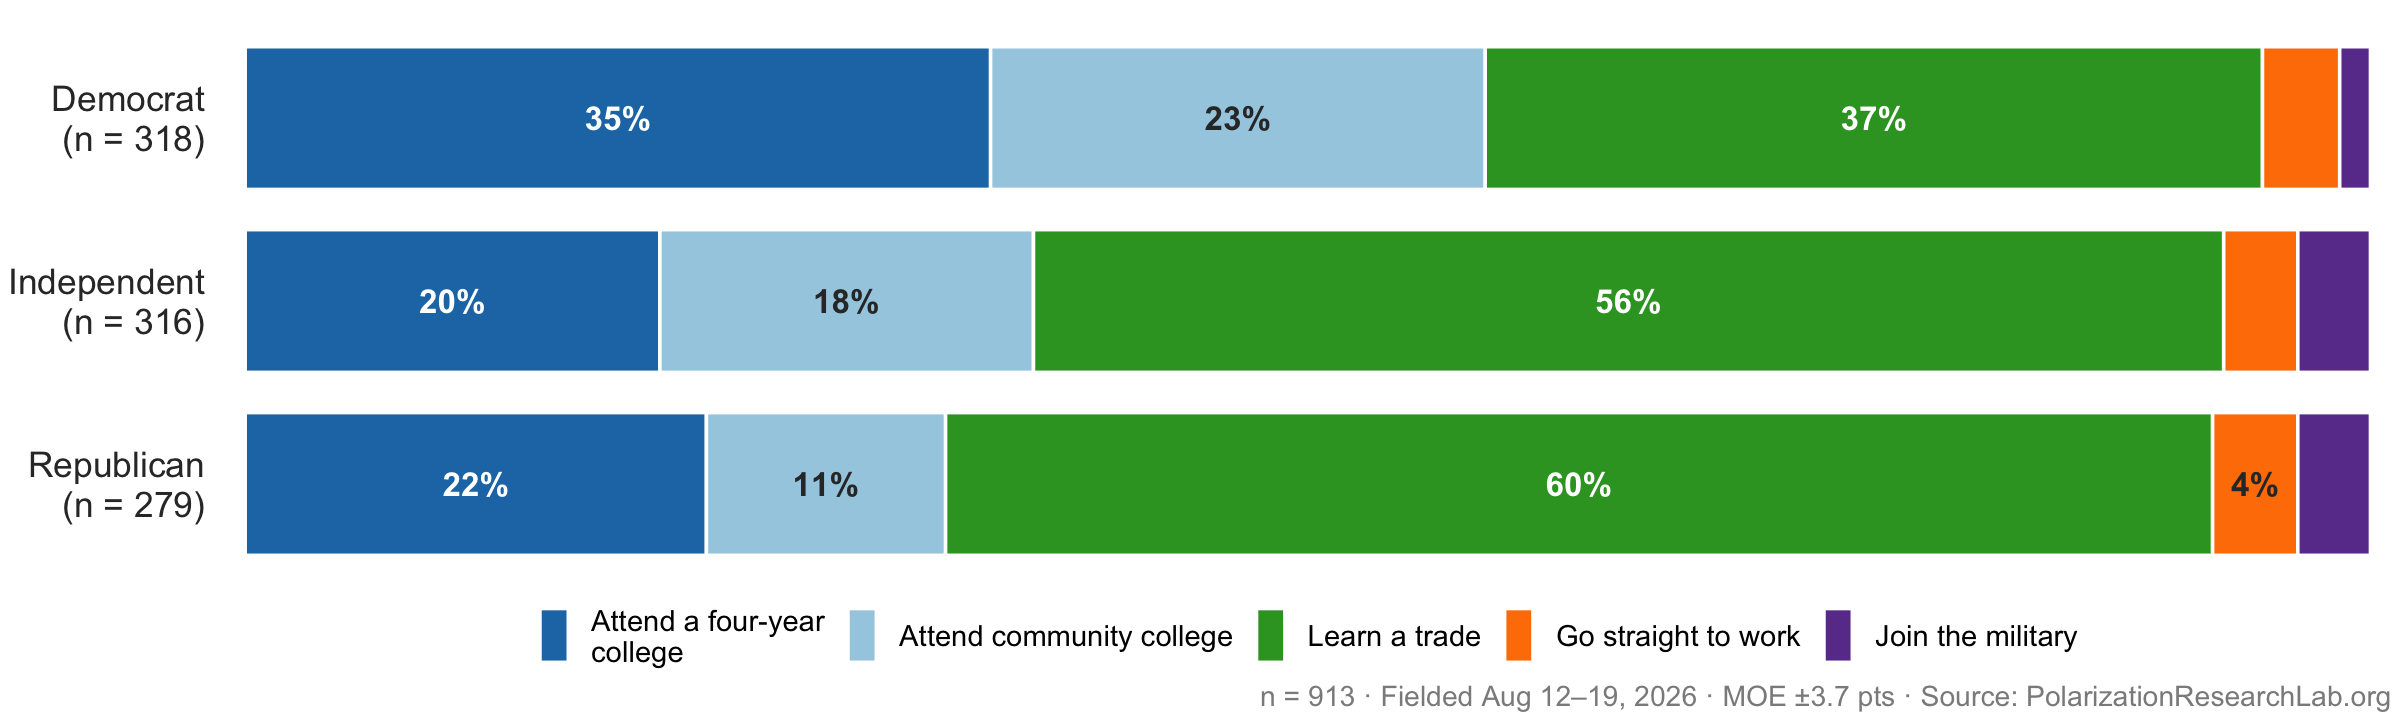
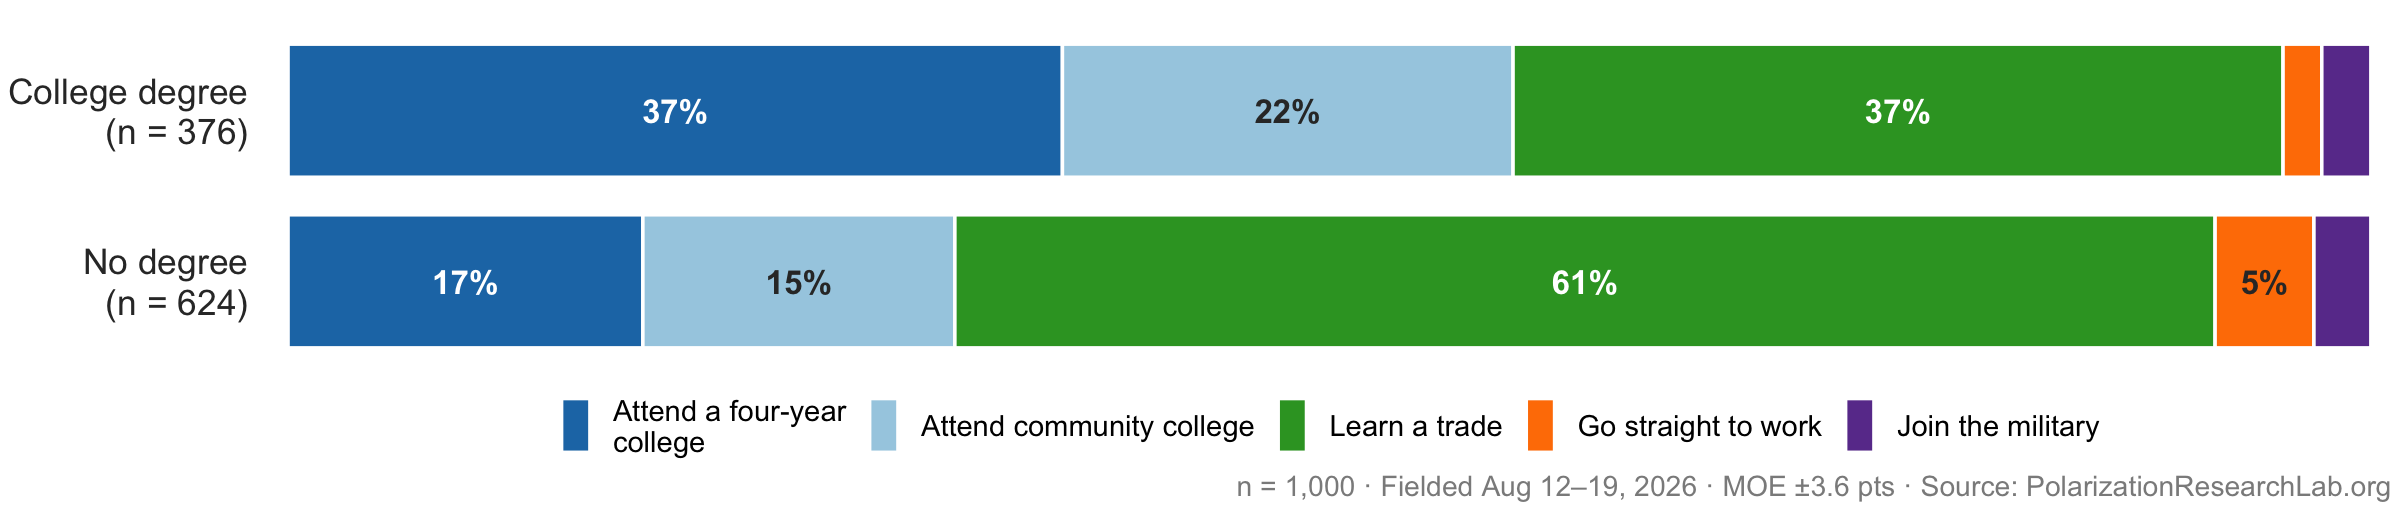
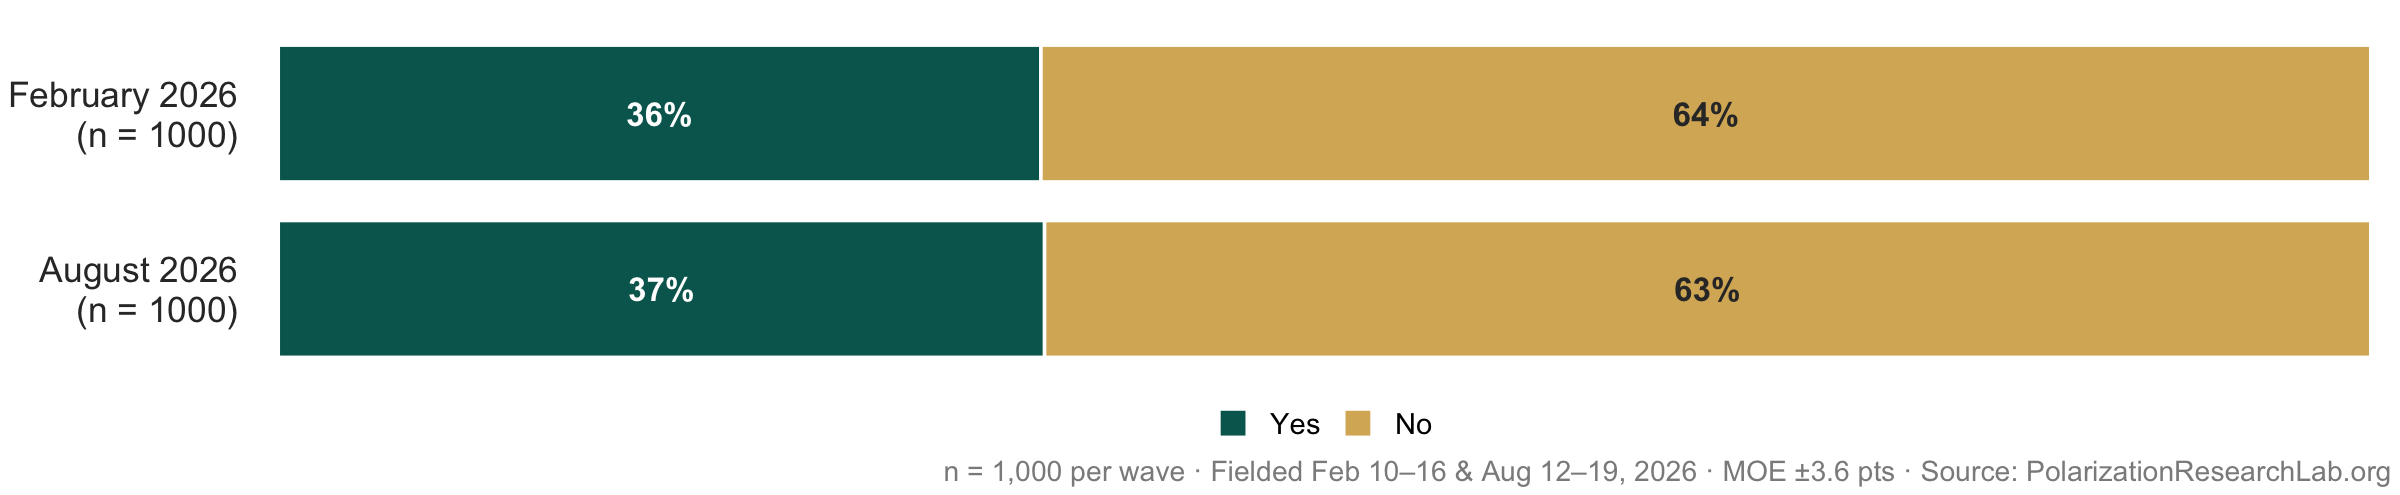
Given a concrete choice, 52% would steer a young person toward a trade and another 17% toward community college. Only 24% would advise a four-year college — a striking figure next to the roughly 37% of respondents who hold a four-year degree themselves. Almost no one recommends going straight to work (4%) or joining the military (3%).
2 Cost, Debt, and Federal Funding
Fewer now call student loans a reasonable way to pay
“For most students, it is reasonable to take out student loans to pay for a four-year college degree.”
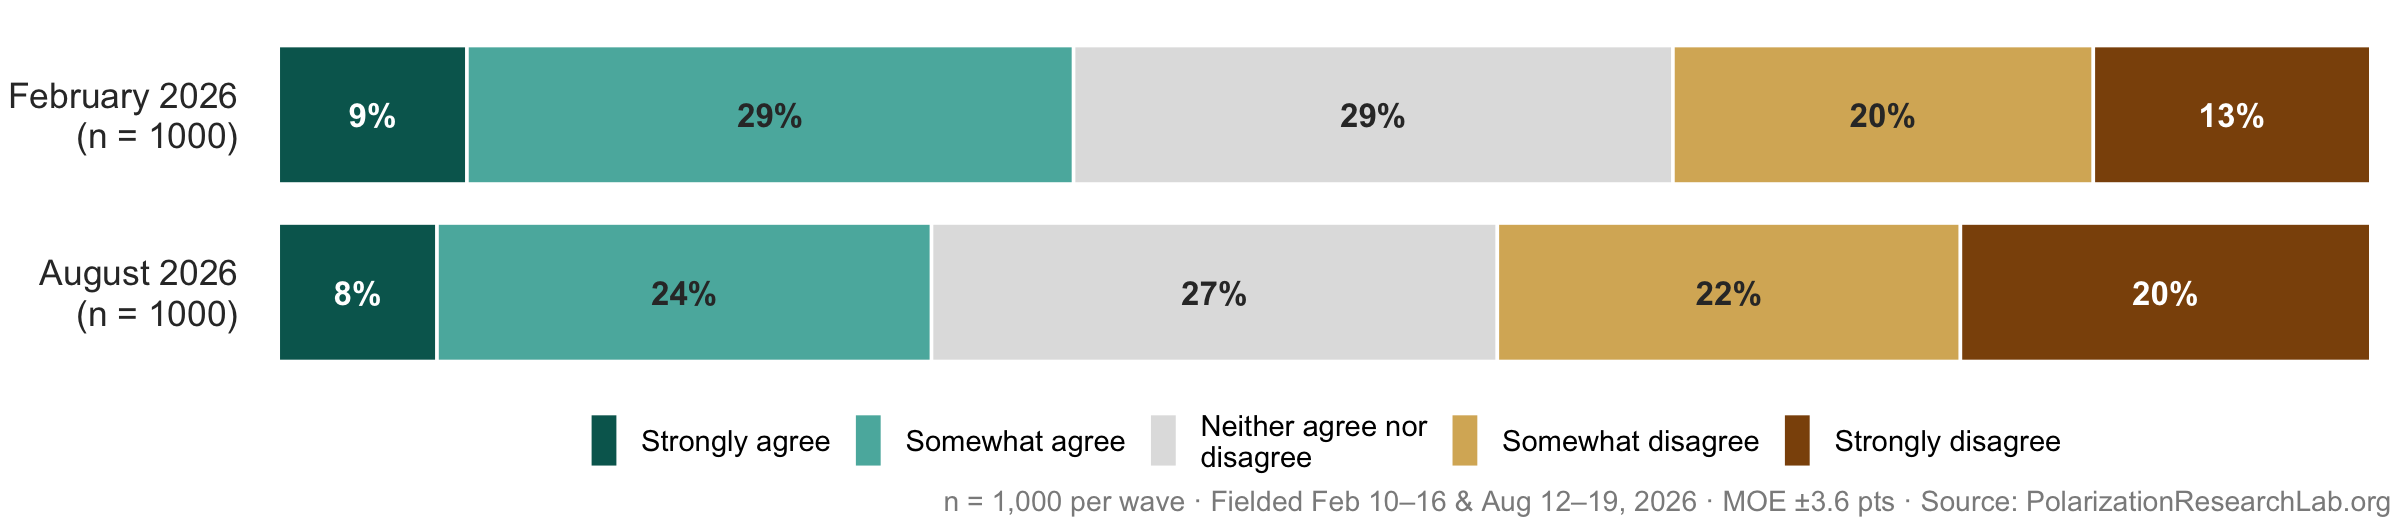
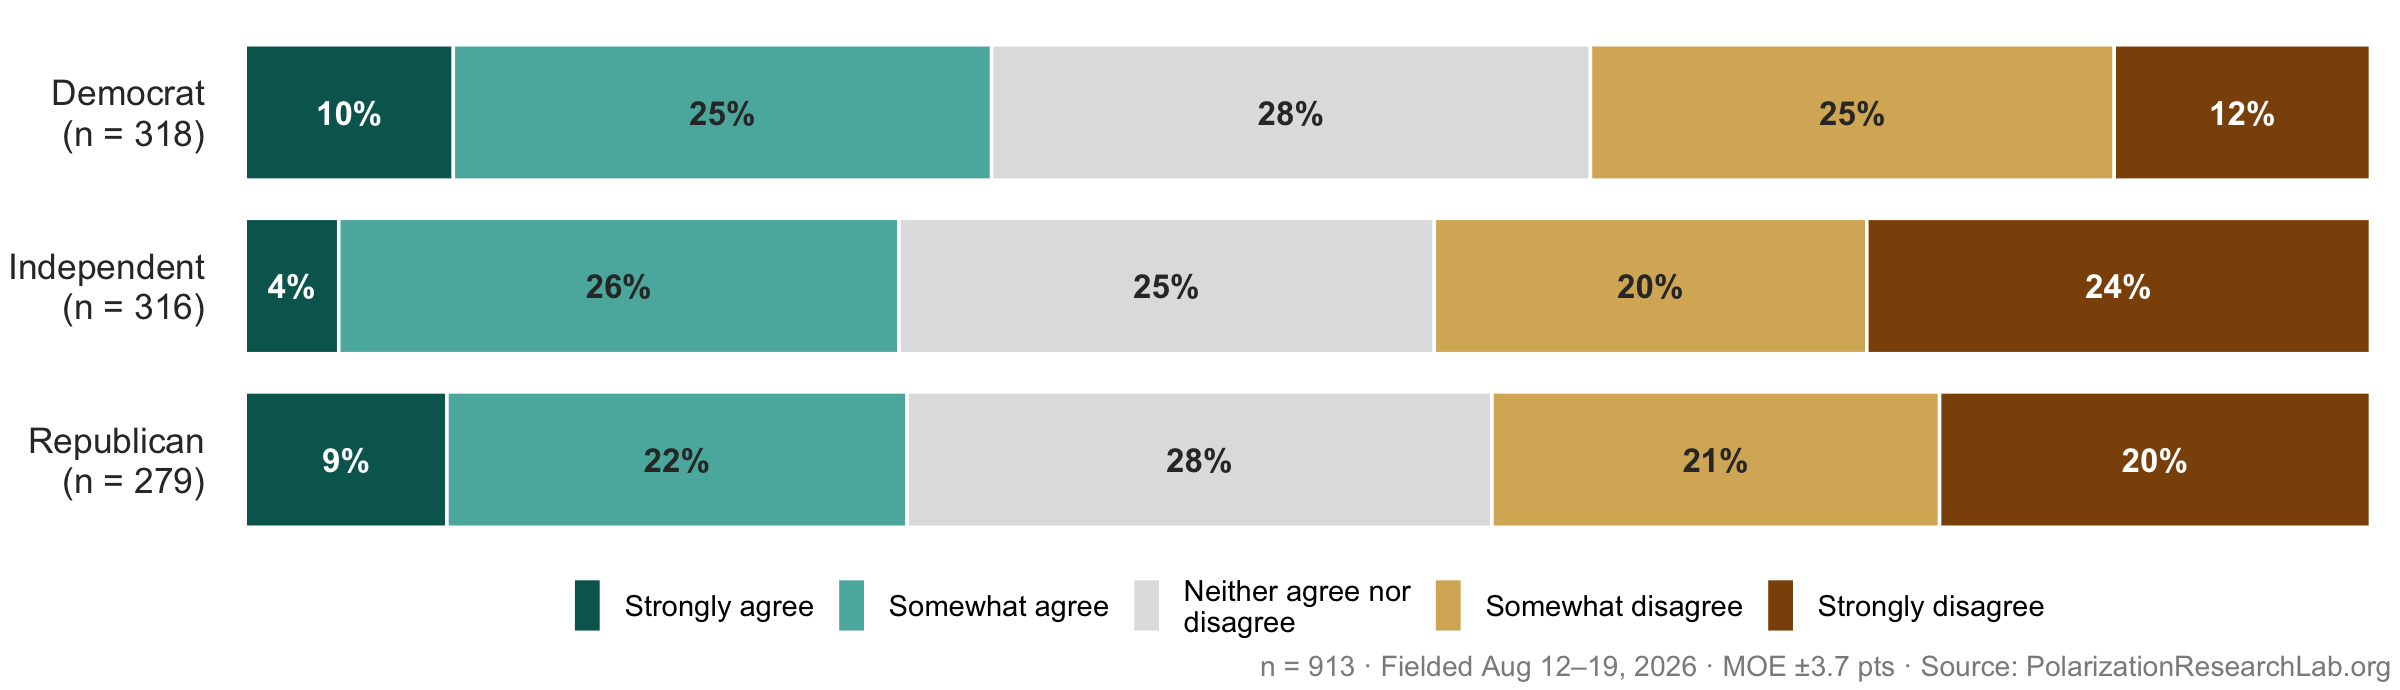
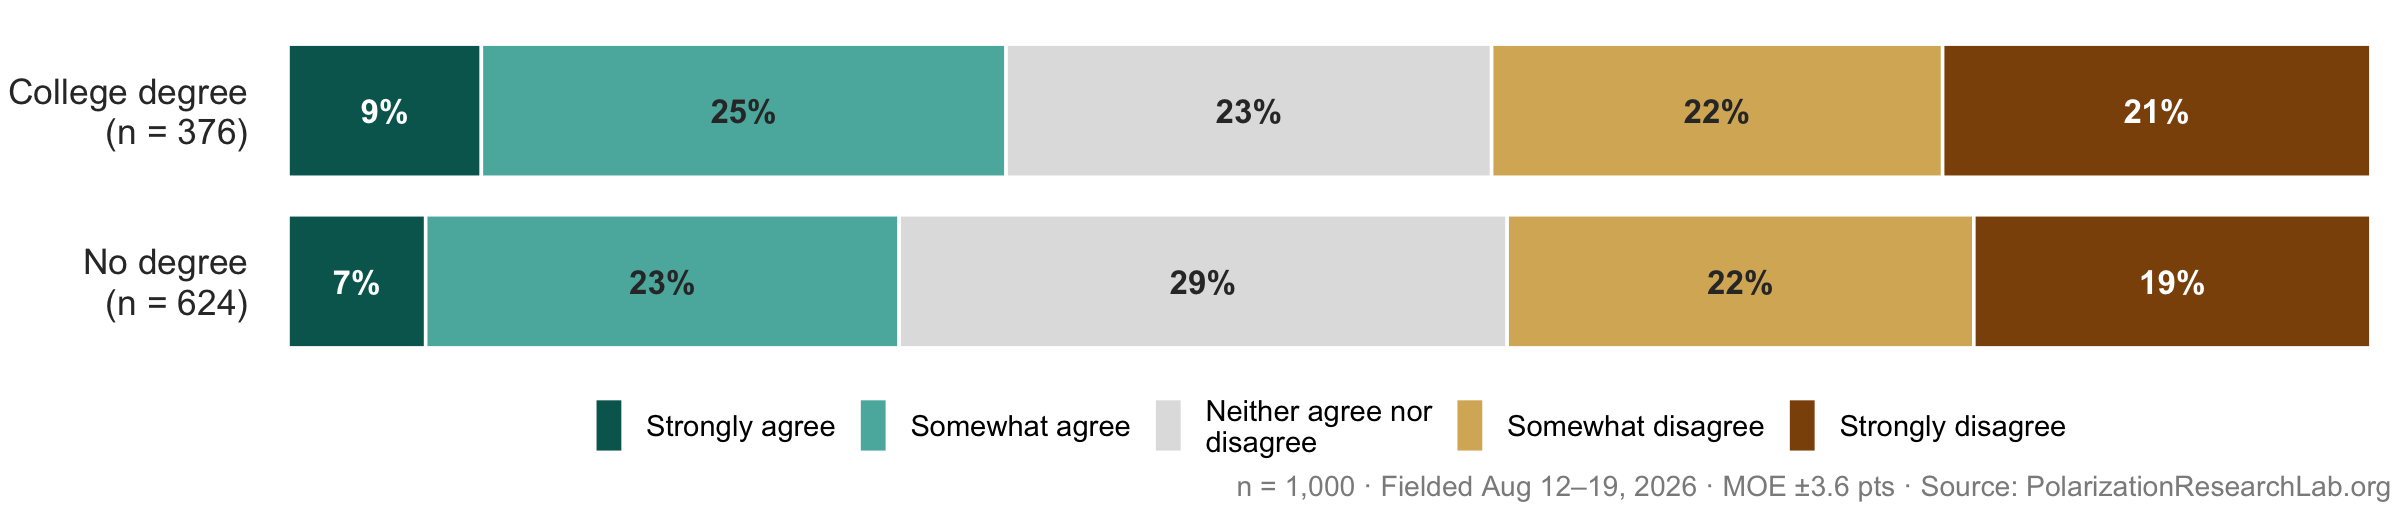
Attitudes toward borrowing moved in the opposite direction from attitudes toward the degree itself. Agreement that loans are reasonable fell from 38% to 31% while disagreement rose from 33% to 42% — disagreement now outweighs agreement for the first time across the two waves.
The federal loan program keeps broad support
“Do you support or oppose the federal government providing student loans to help people pay for college?”

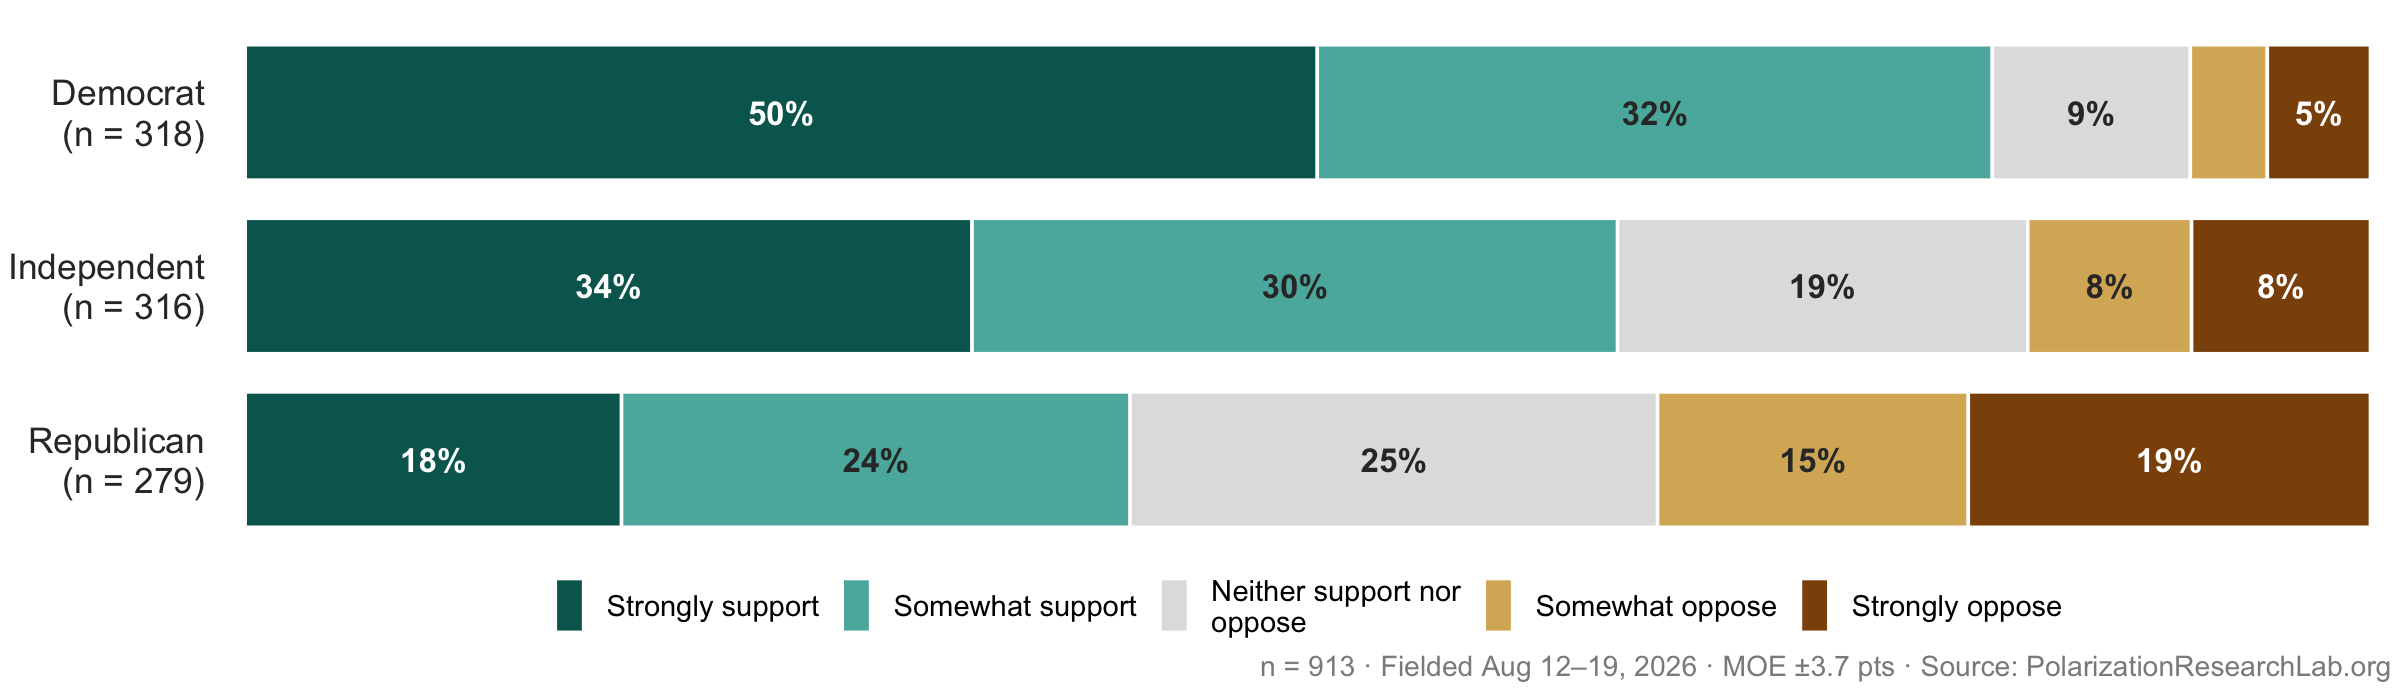
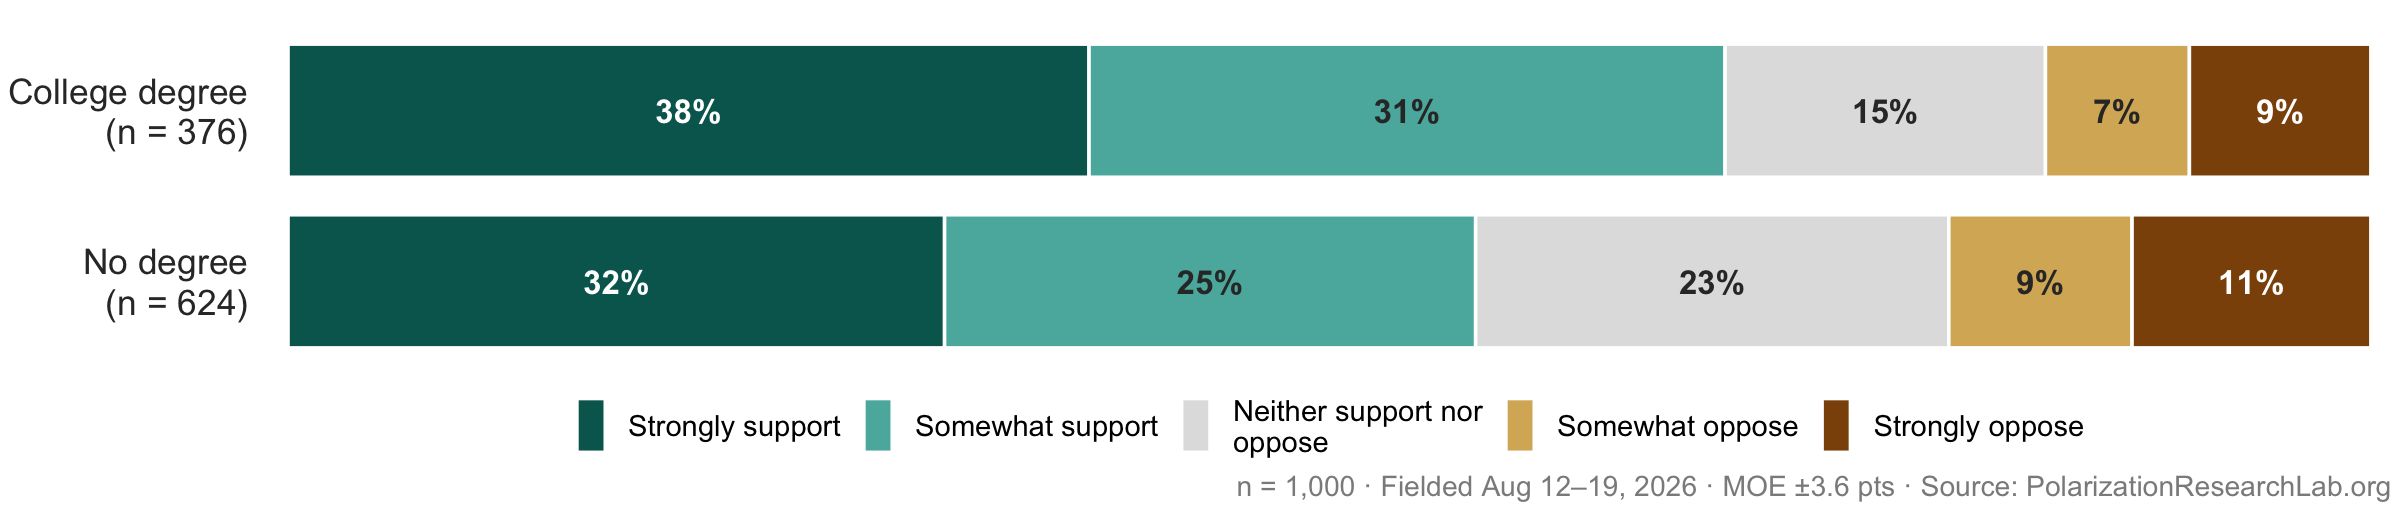
Whatever their doubts about borrowing, respondents want the federal loan program to exist: 61% support it and 19% oppose. Skepticism about whether loans are wise for students coexists with support for making them available.
Research funding is the sector’s strongest asset
“Do you support or oppose the federal government funding scientific and medical research at colleges and universities?”

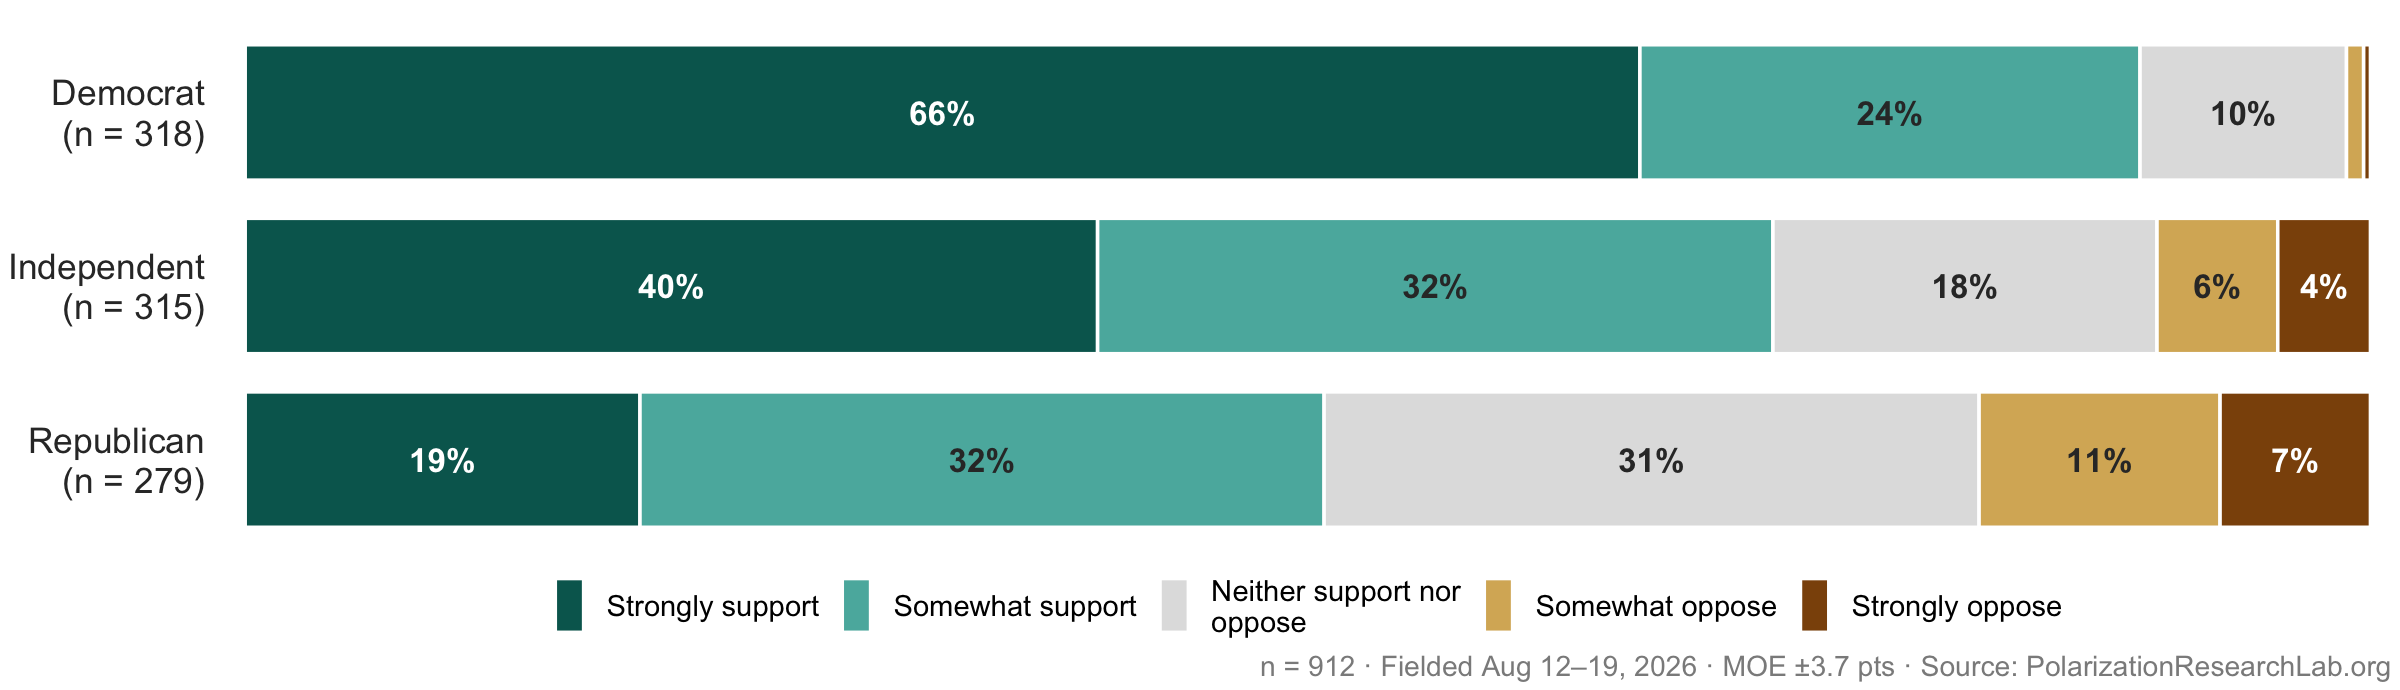
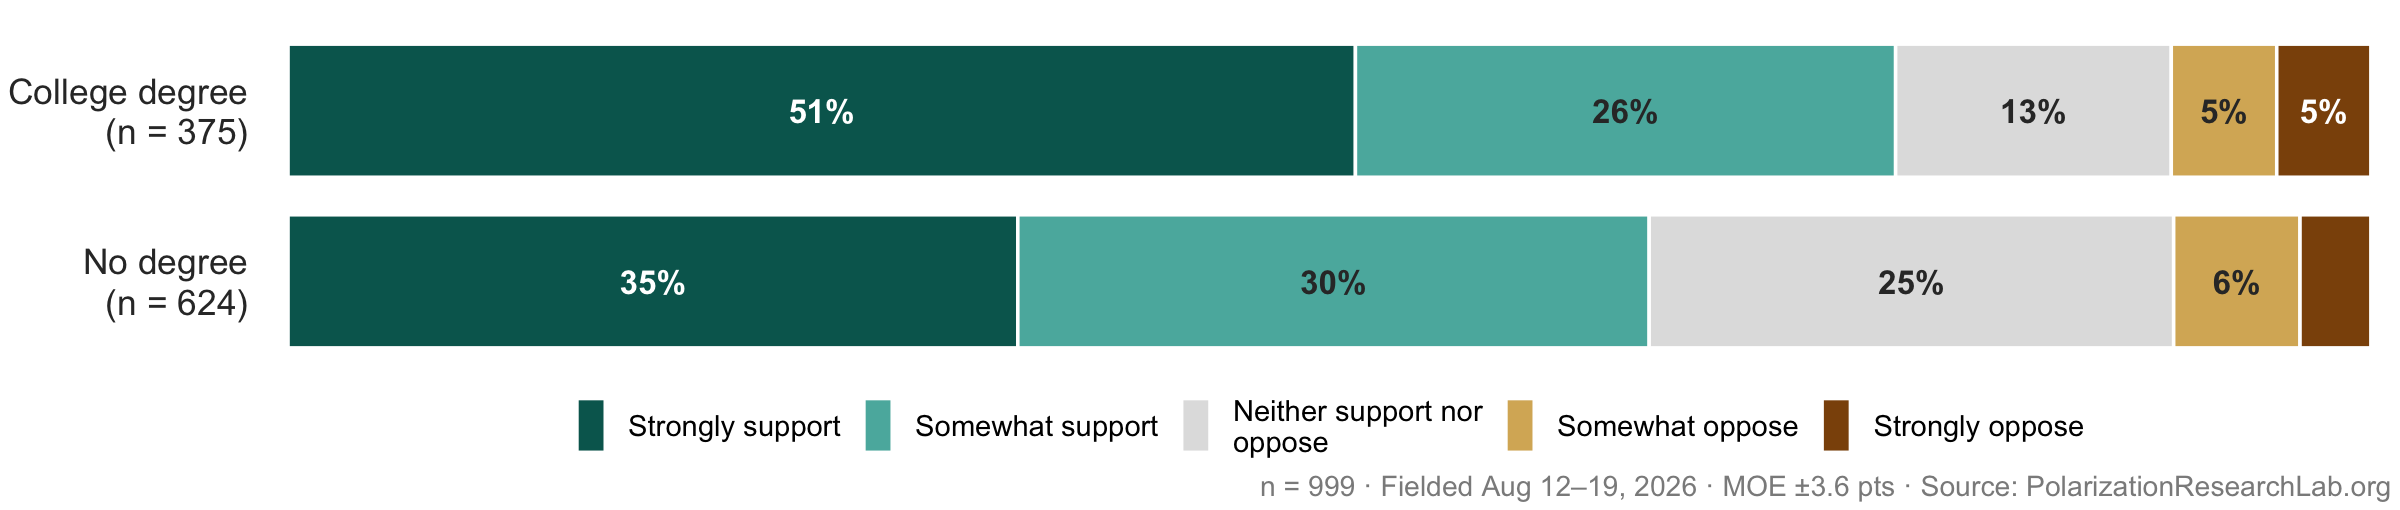
Research funding is the most popular thing universities do in this survey: 70% support it and only 10% oppose. Support holds across party lines, making this the sector’s clearest point of consensus.
Only the antisemitism goal justifies withholding research funds
“Should the federal government be allowed to withhold research funding from universities in order to pressure them to …”
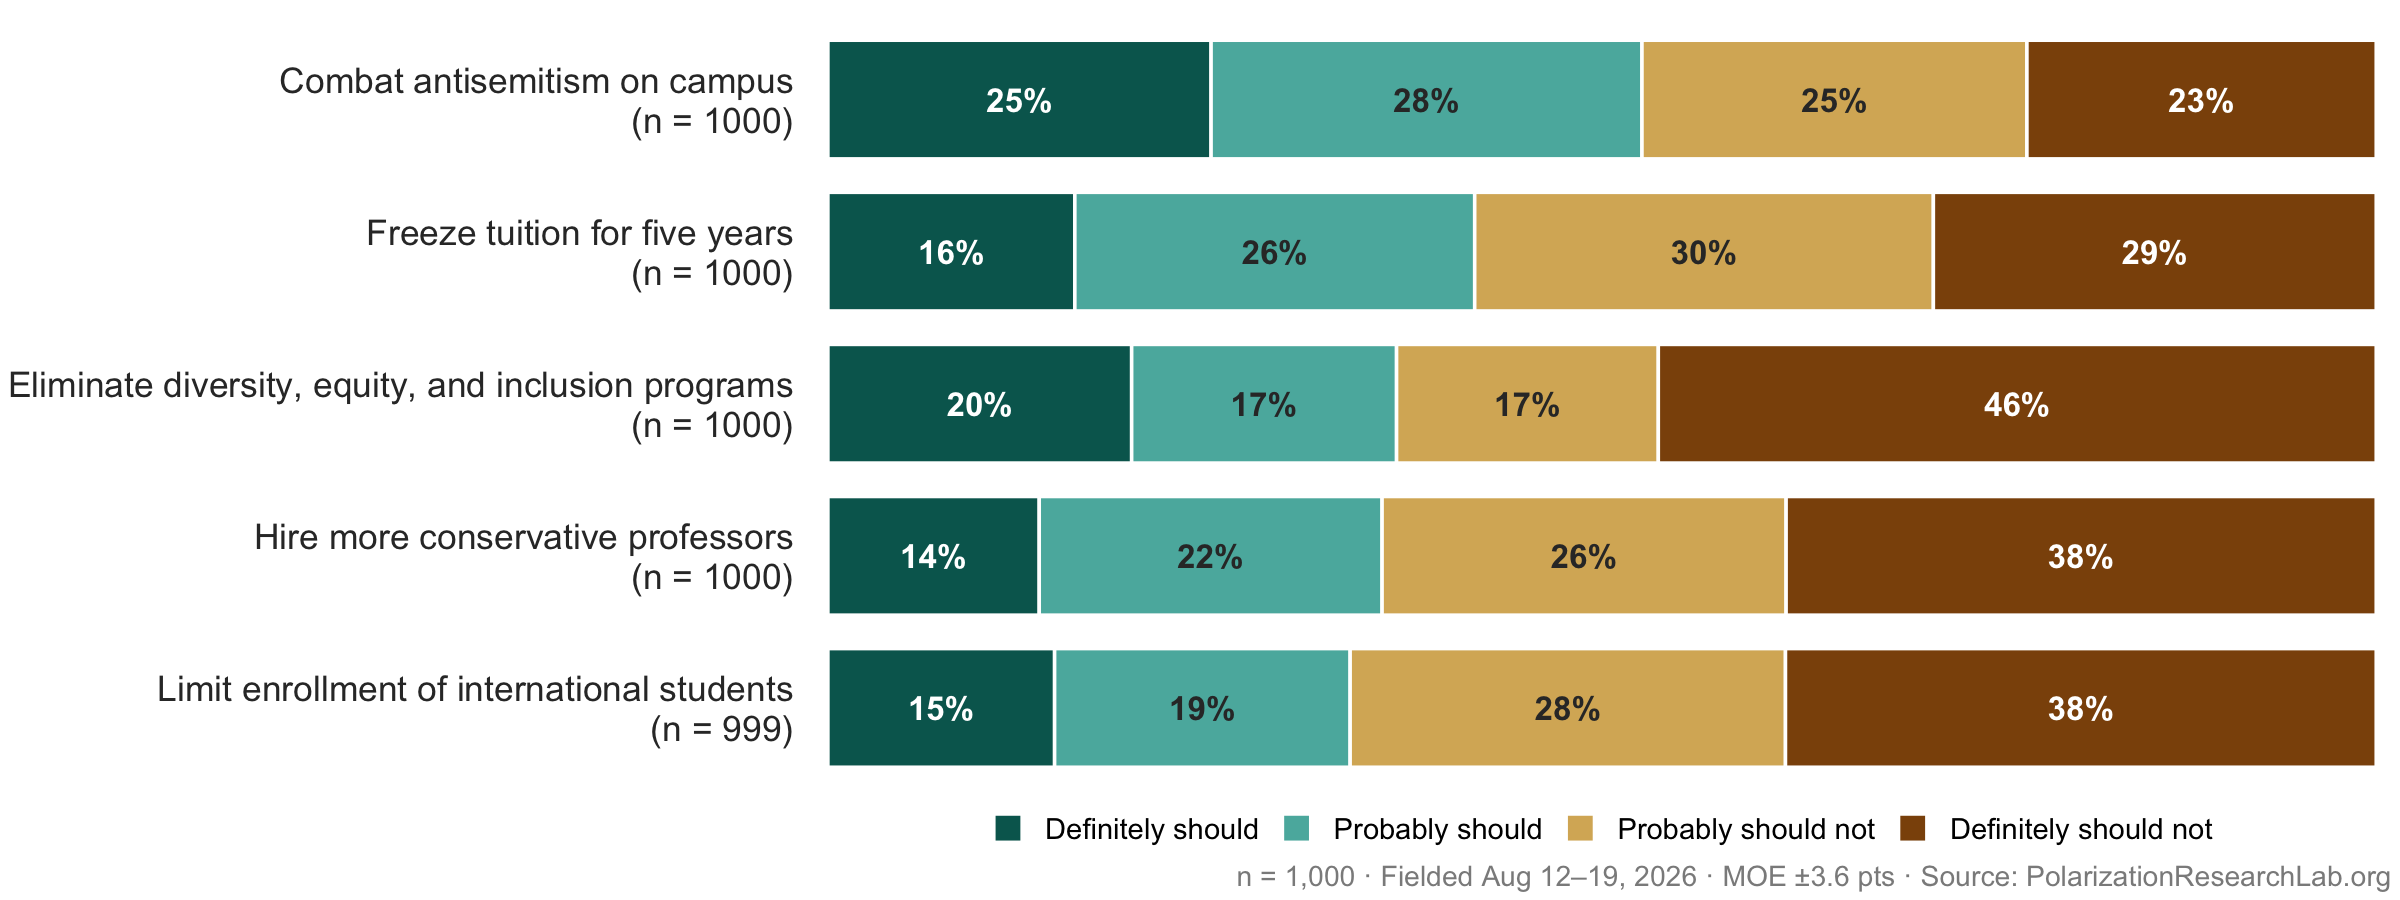
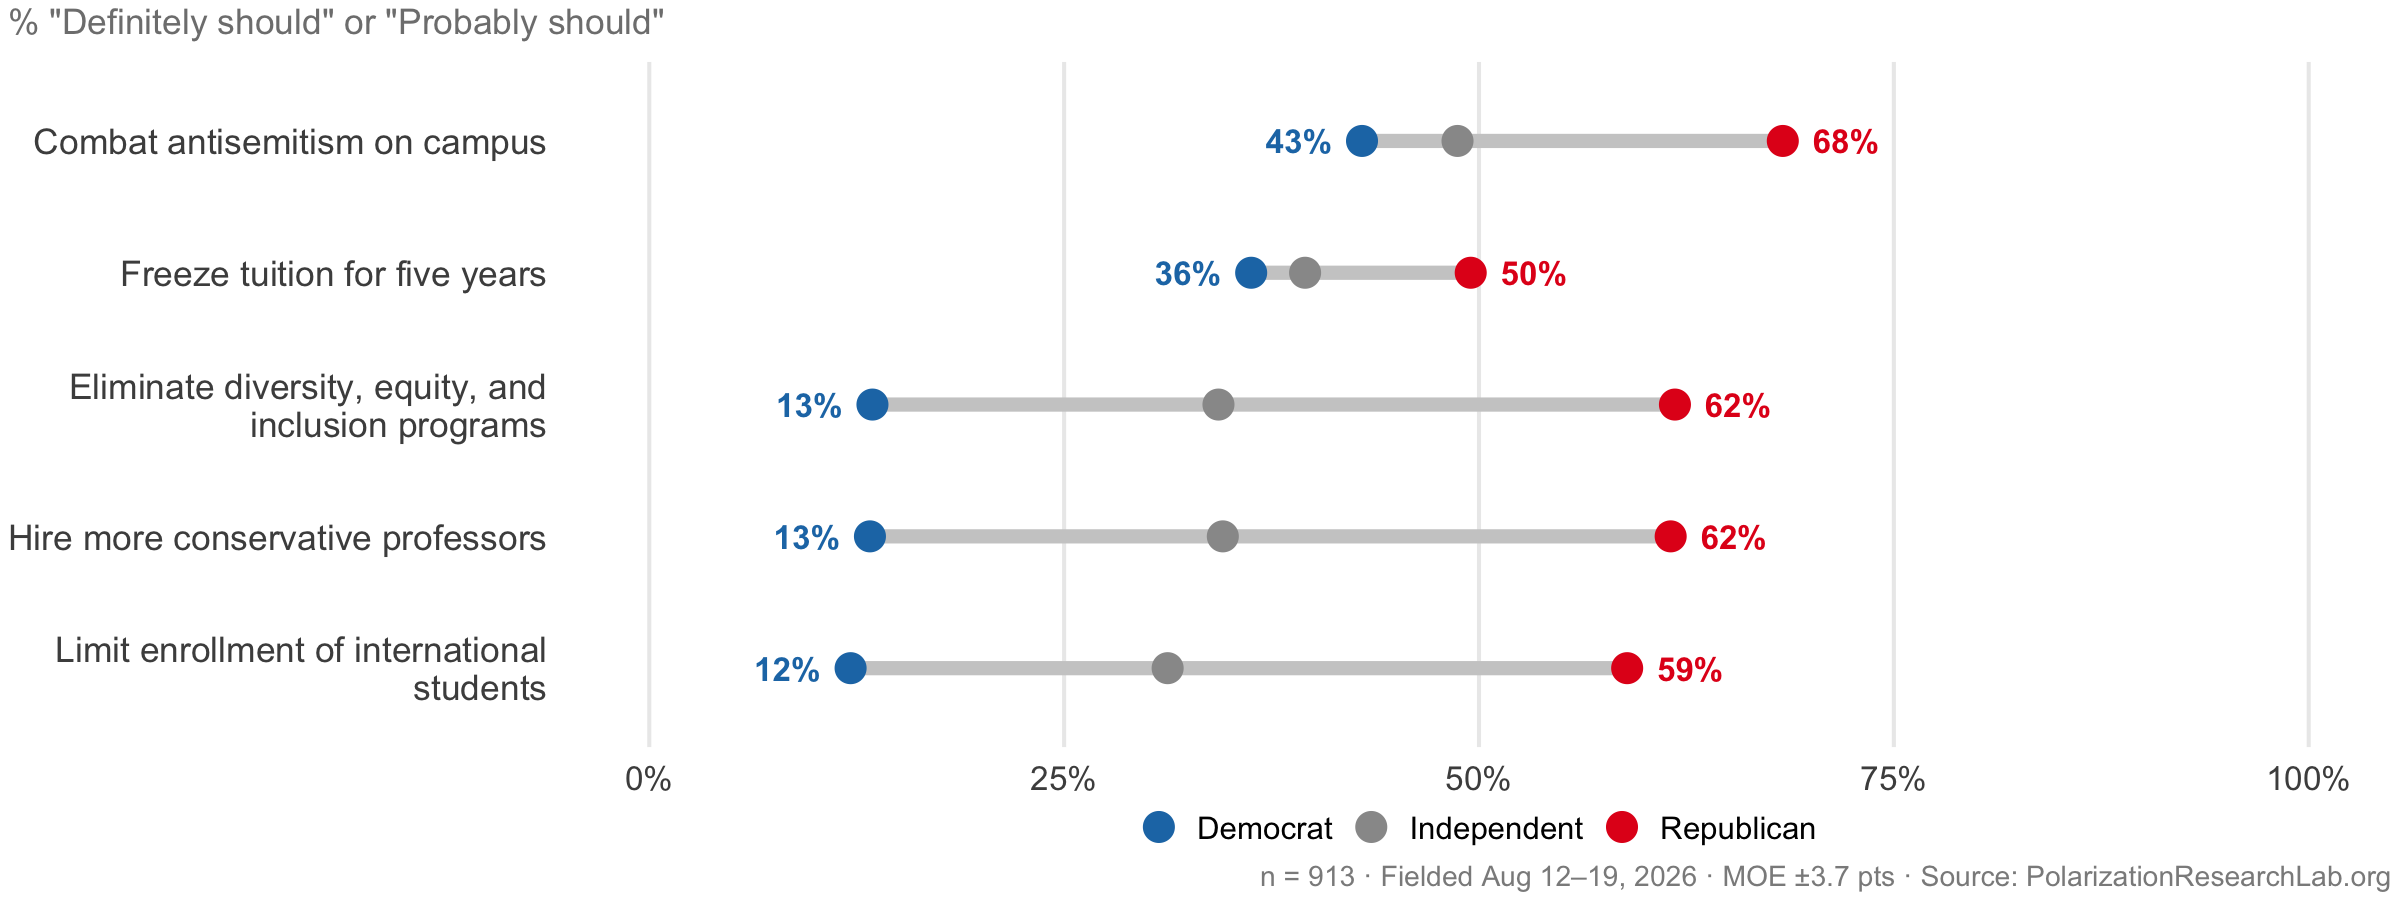
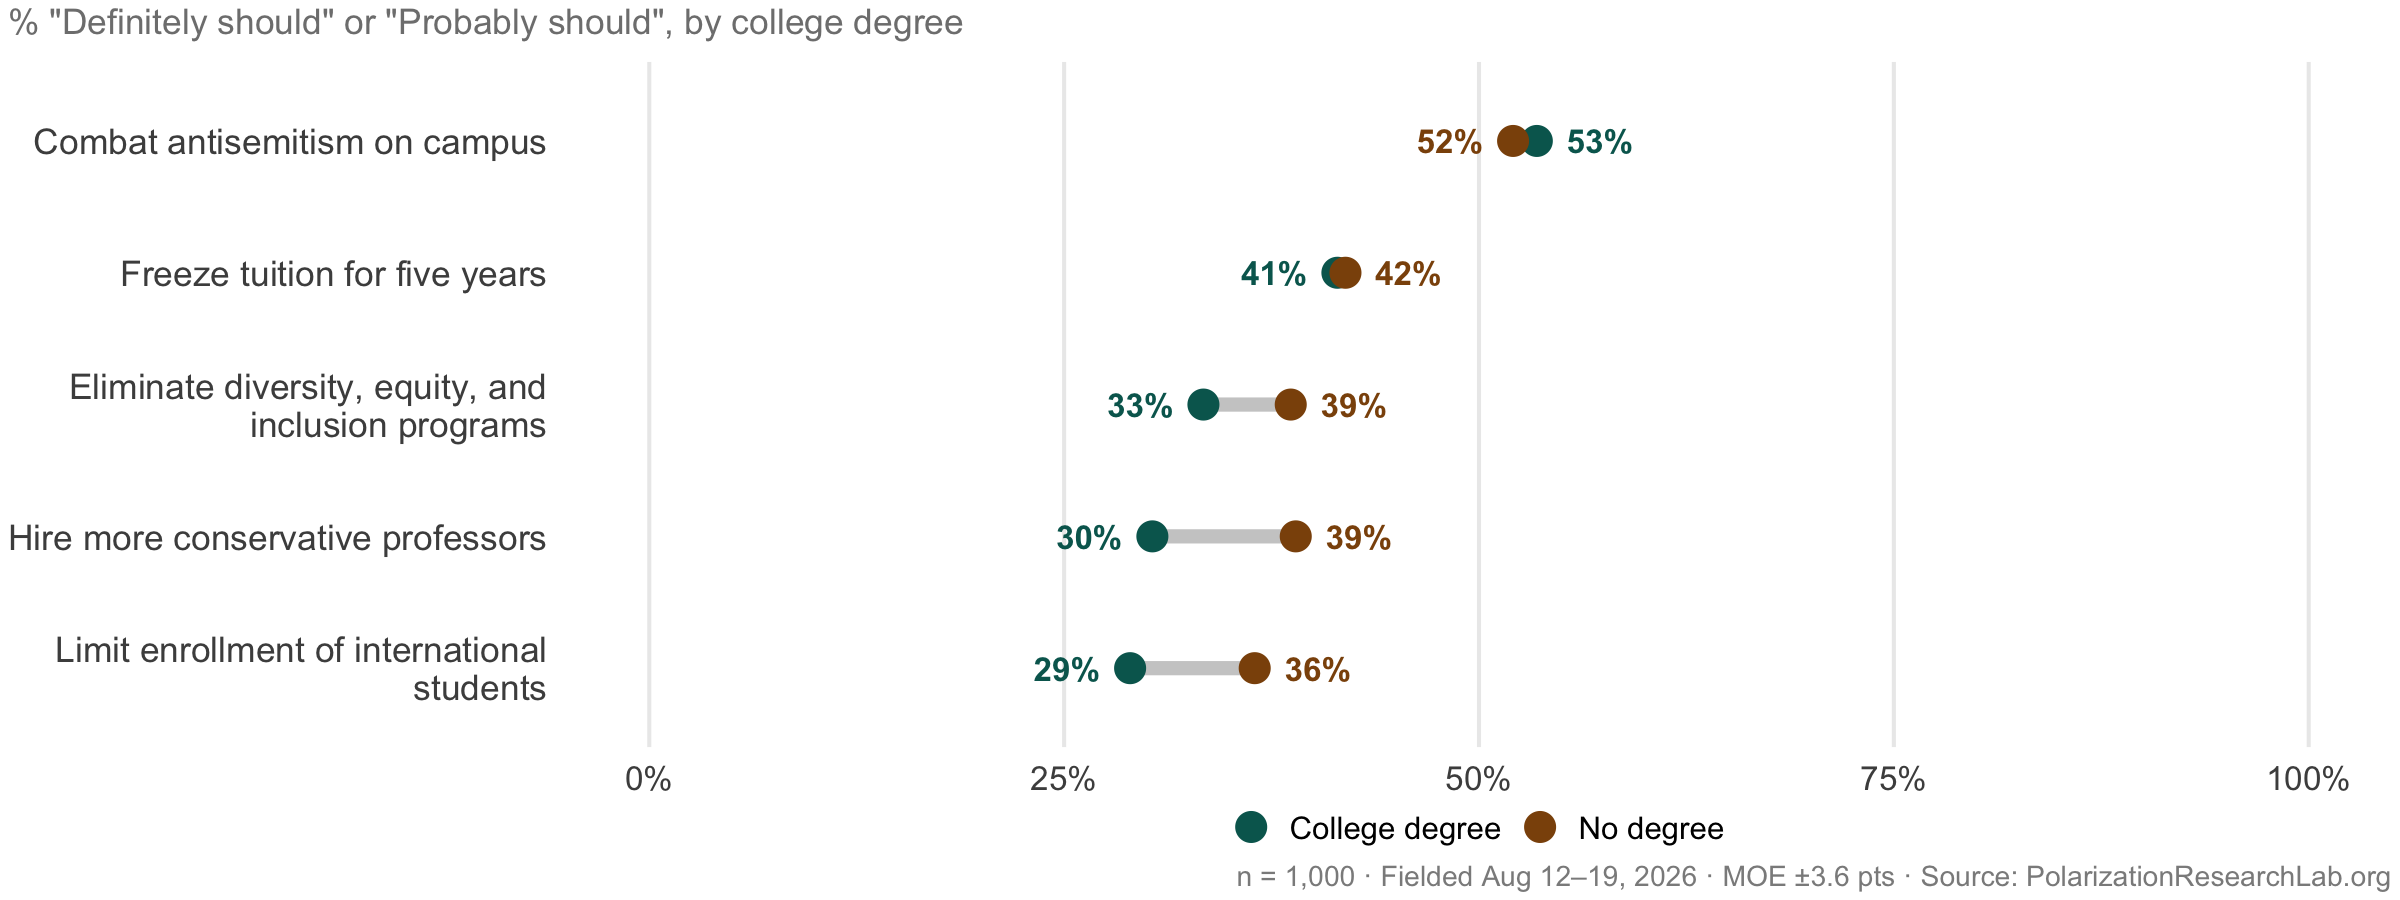
Only one goal clears majority support: 53% say the government should be able to withhold research funding to pressure universities to combat antisemitism. Every other goal is underwater, including the ones most prominent in current policy debates — eliminating diversity, equity, and inclusion programs (37% should, with 46% saying “definitely should not”) and hiring more conservative professors (36%). Even a populist economic goal, freezing tuition, draws only 42%. The public’s default is that research money should not be a political lever.
3 Admissions and Academics
Most want test scores in the admissions process
“Do you think colleges and universities should require applicants to submit SAT or ACT scores as part of the admissions process?”
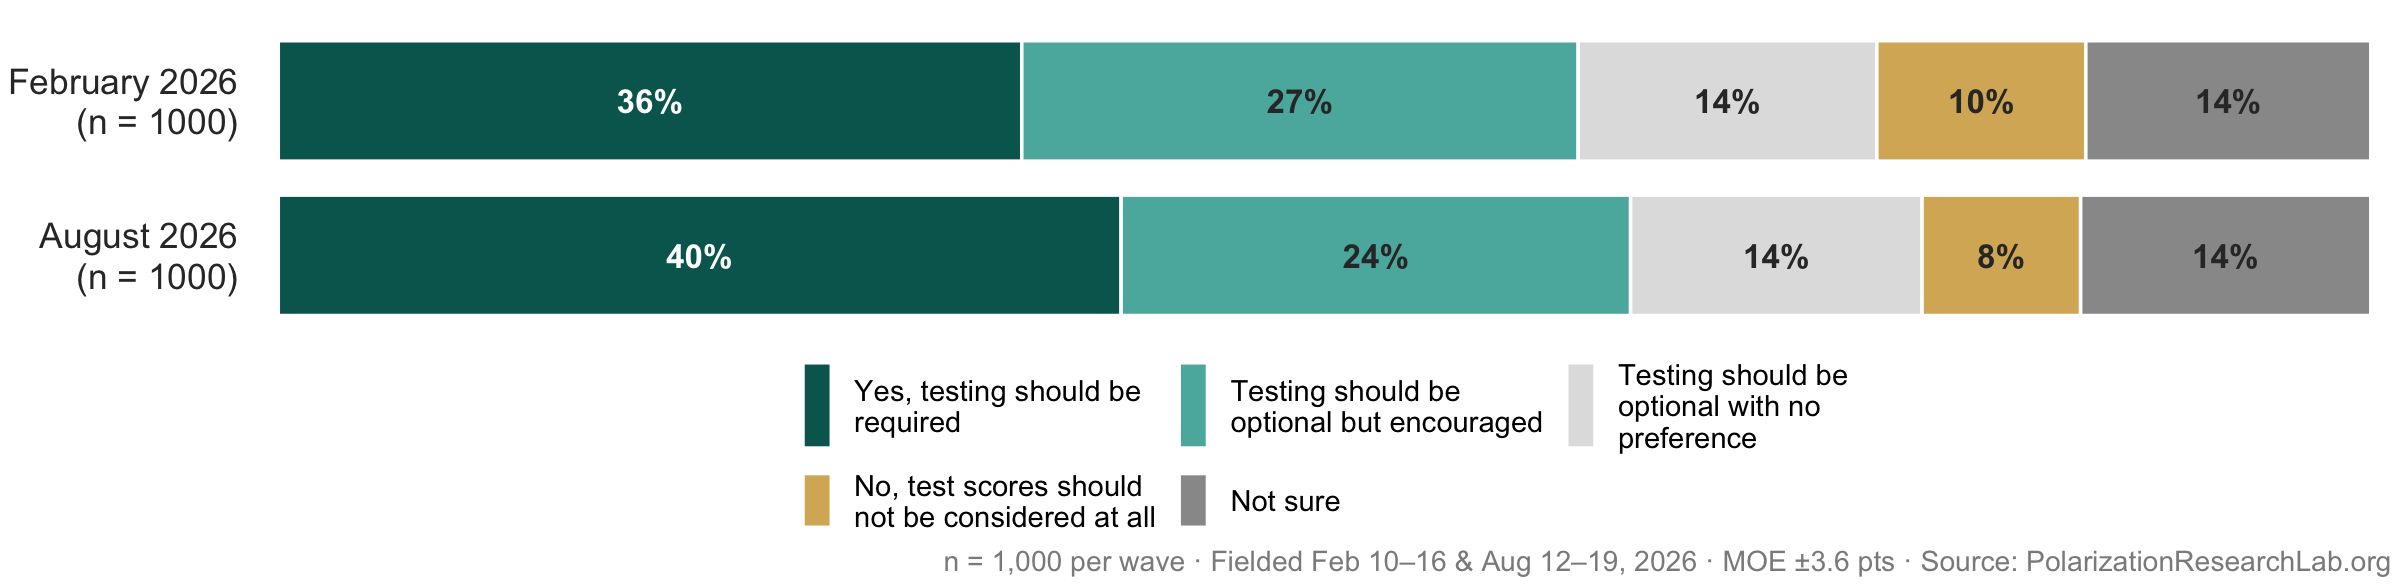
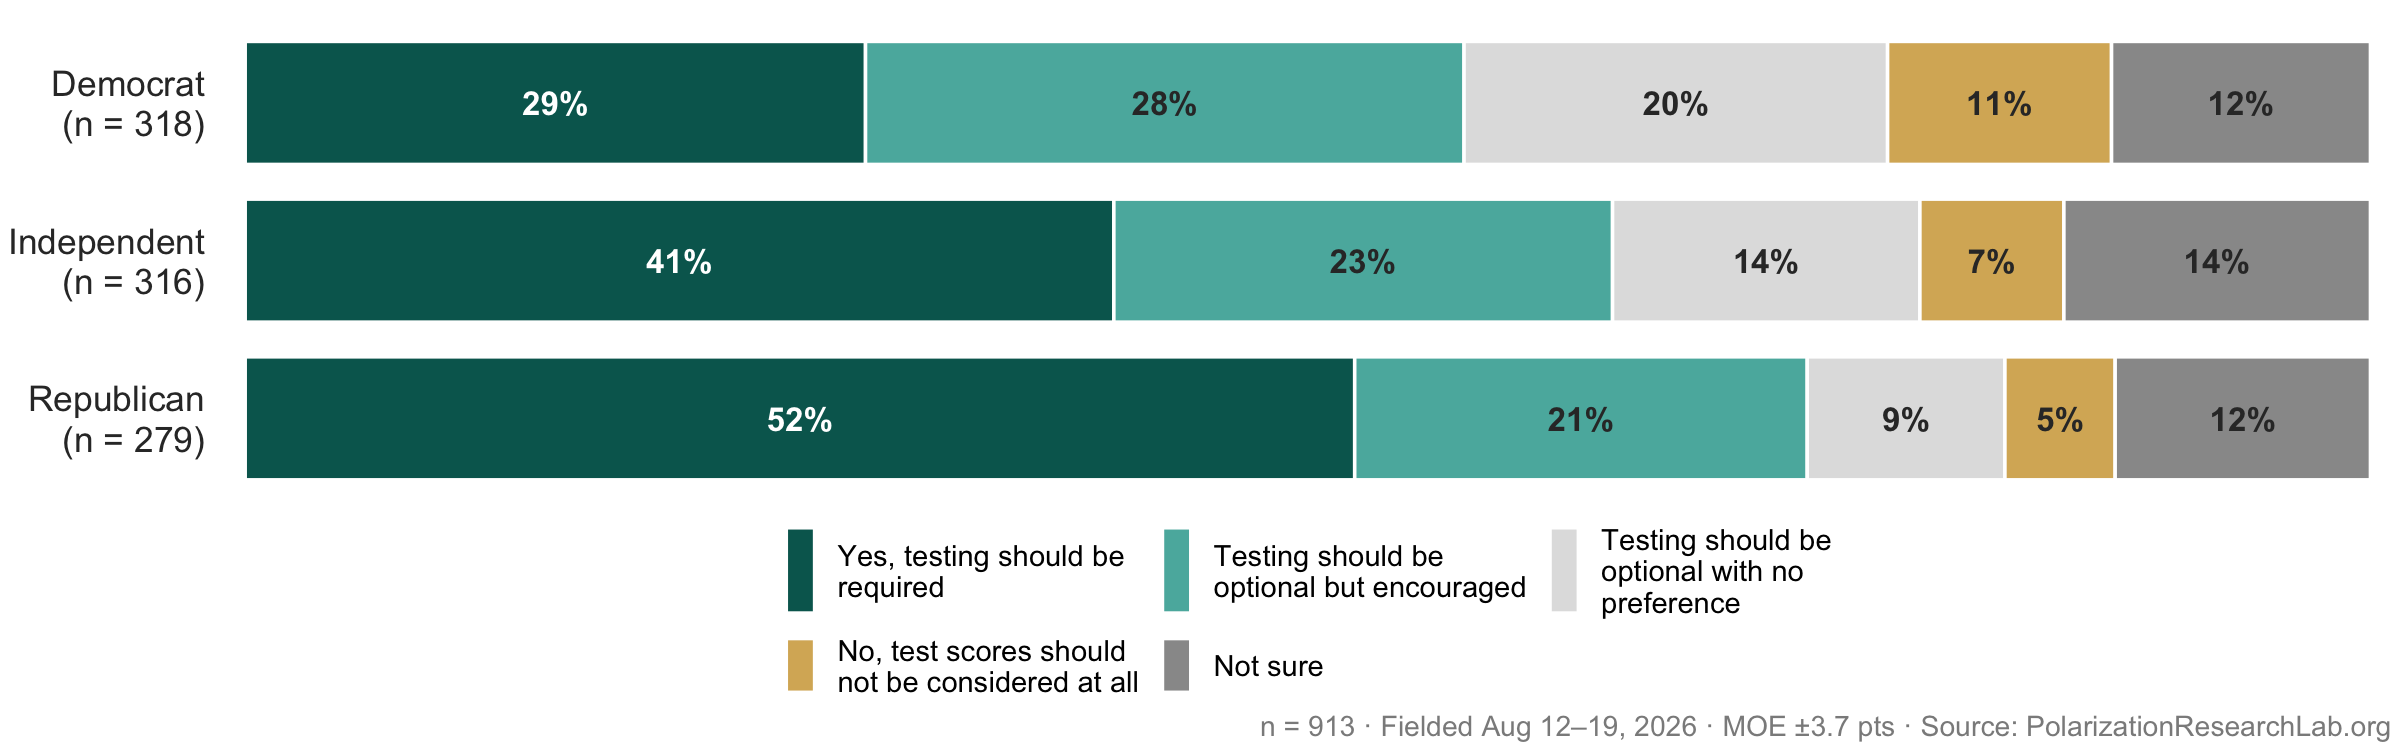
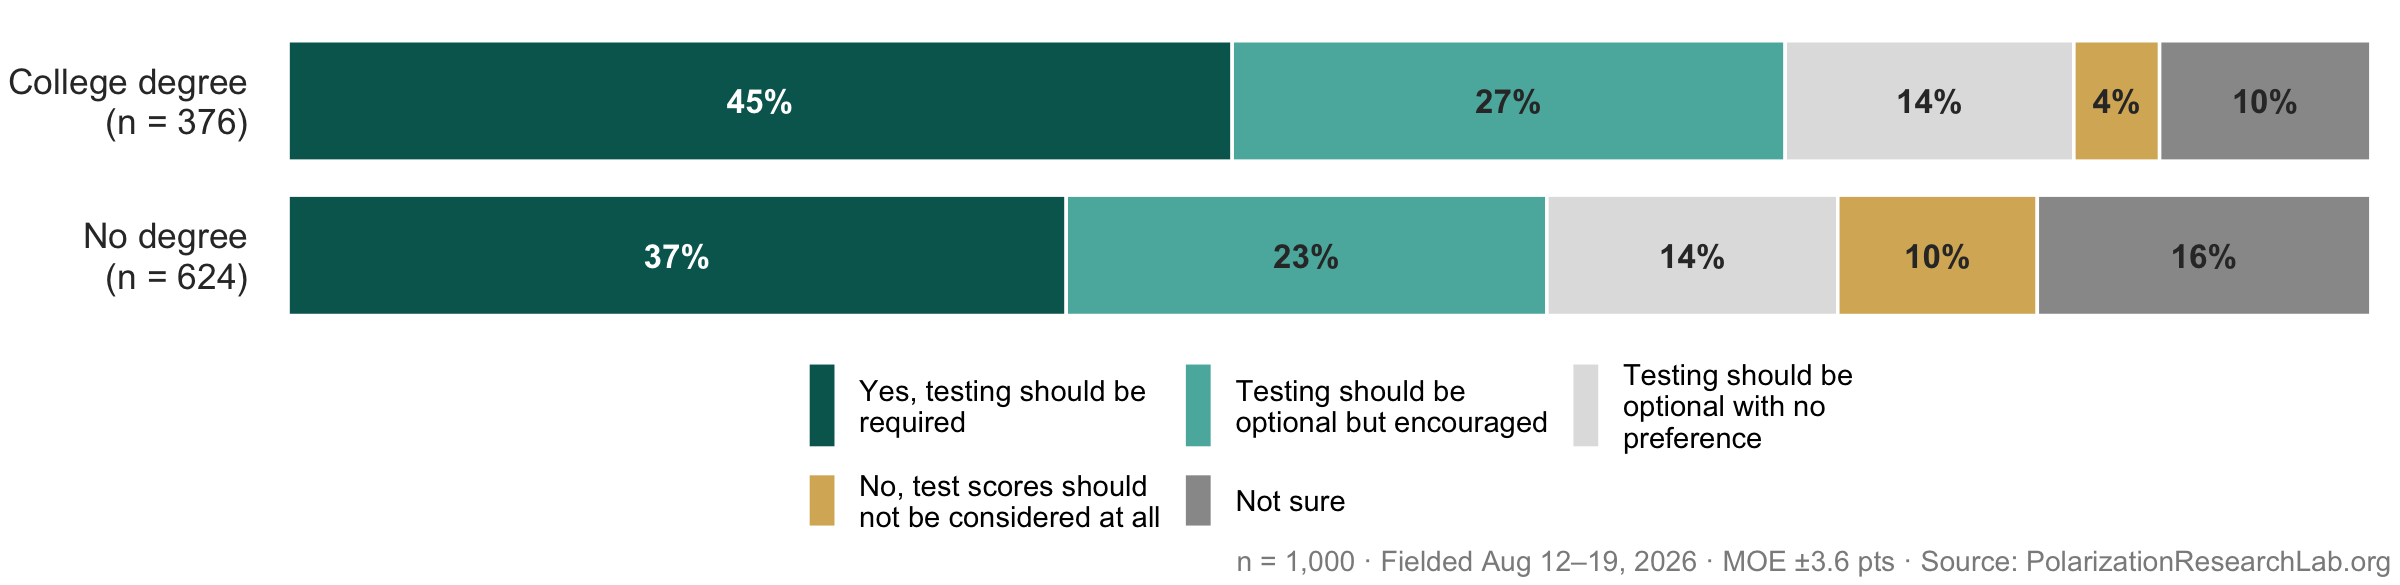
A 40% plurality says testing should be required outright, and another 24% would keep it optional but encouraged — about two-thirds of the public wants test scores in the process, while only 8% would bar them entirely. Republicans are most enthusiastic (52% say required), but even among Democrats, requiring or encouraging scores outpolls discarding them. The February–August differences are within the margin of error.
The public endorses a traditional core curriculum
“Should colleges require all students to complete at least one course in each of the following areas, regardless of their major?”
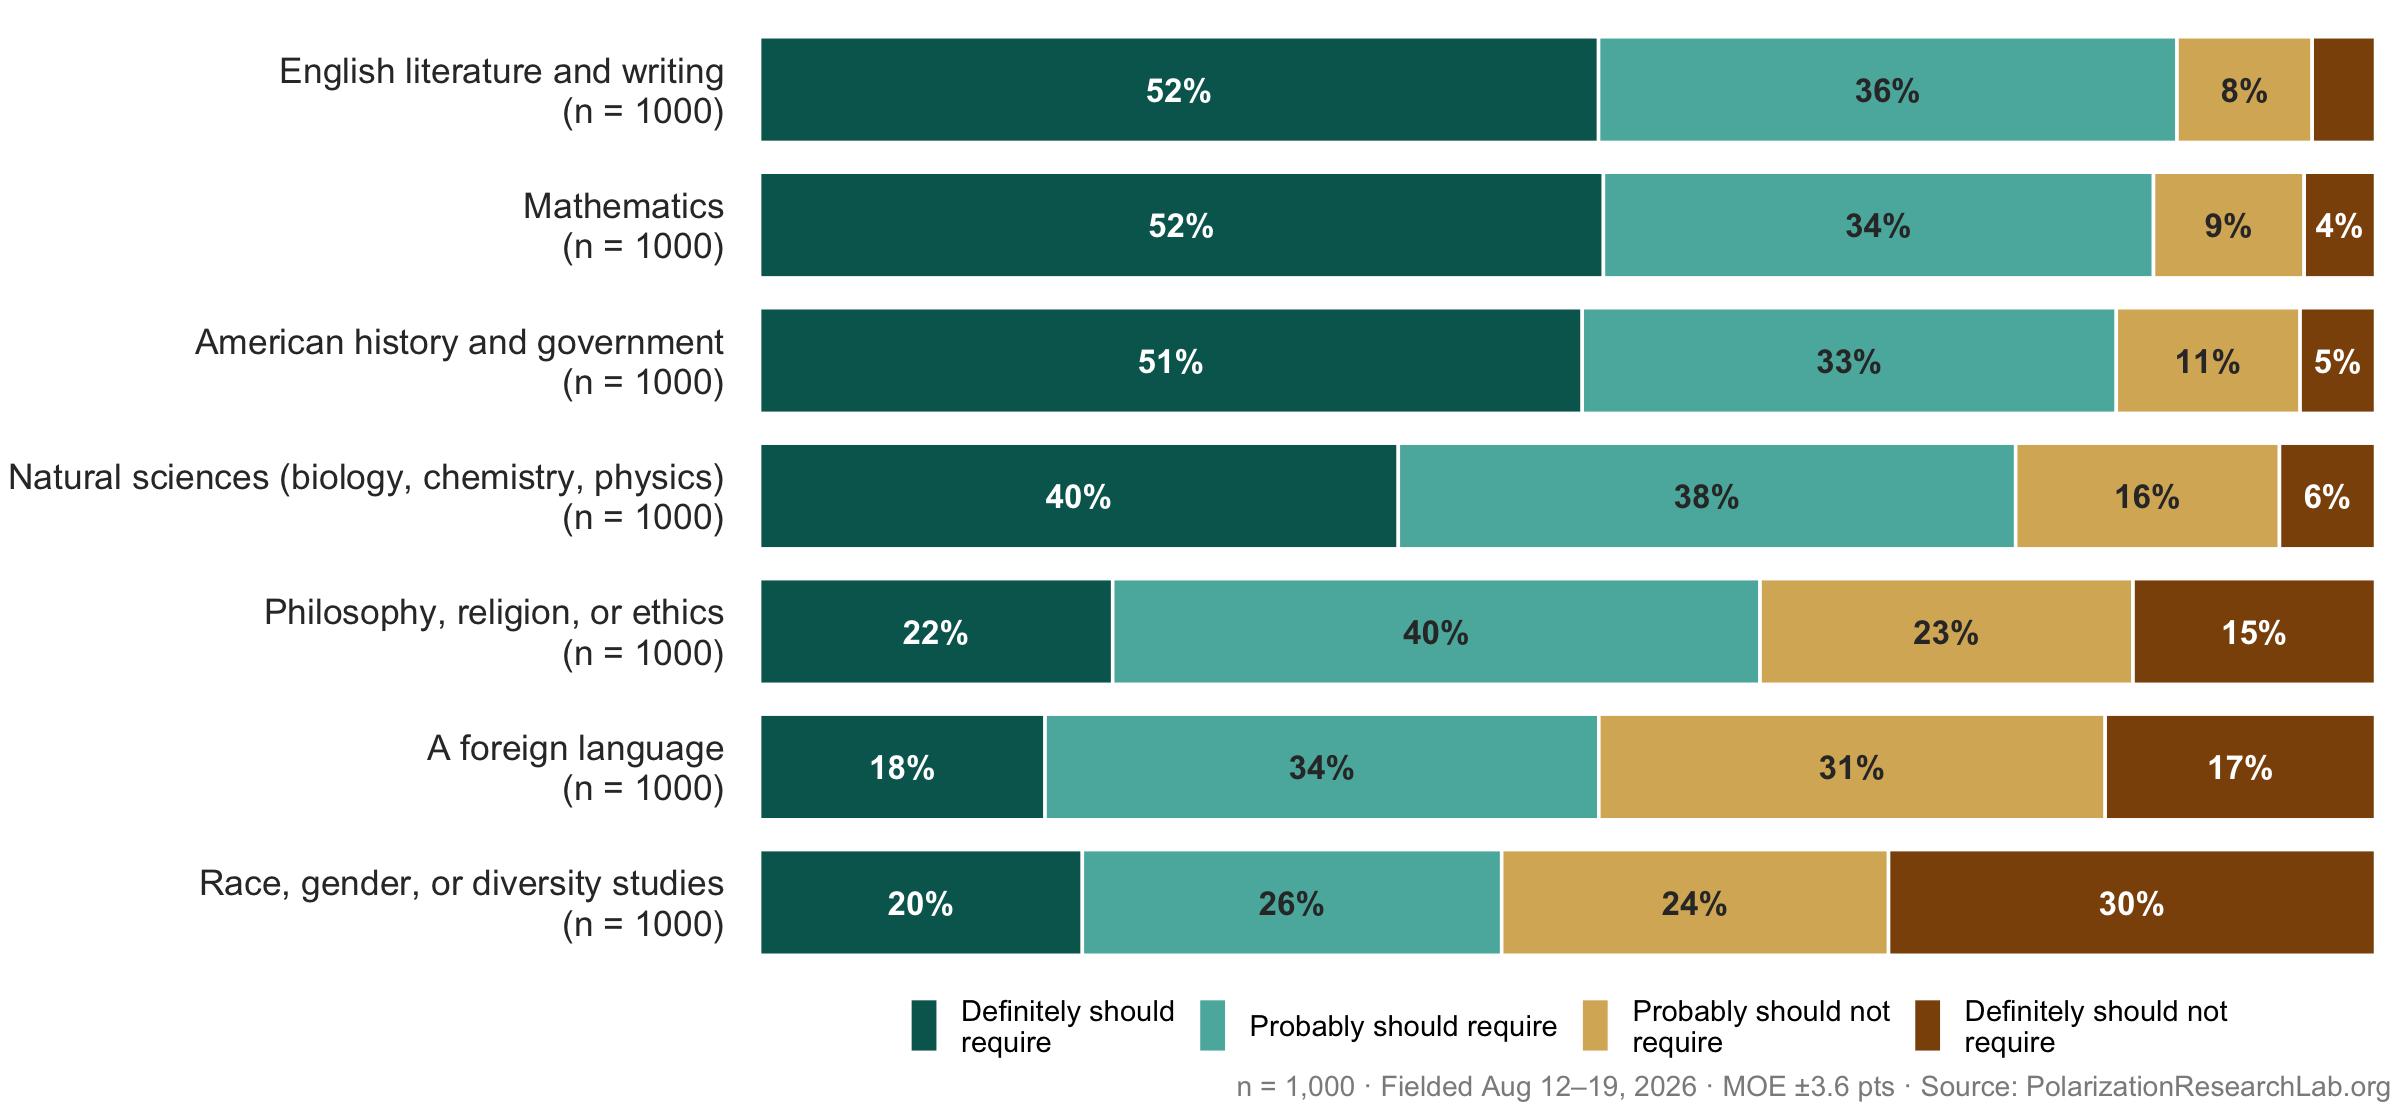
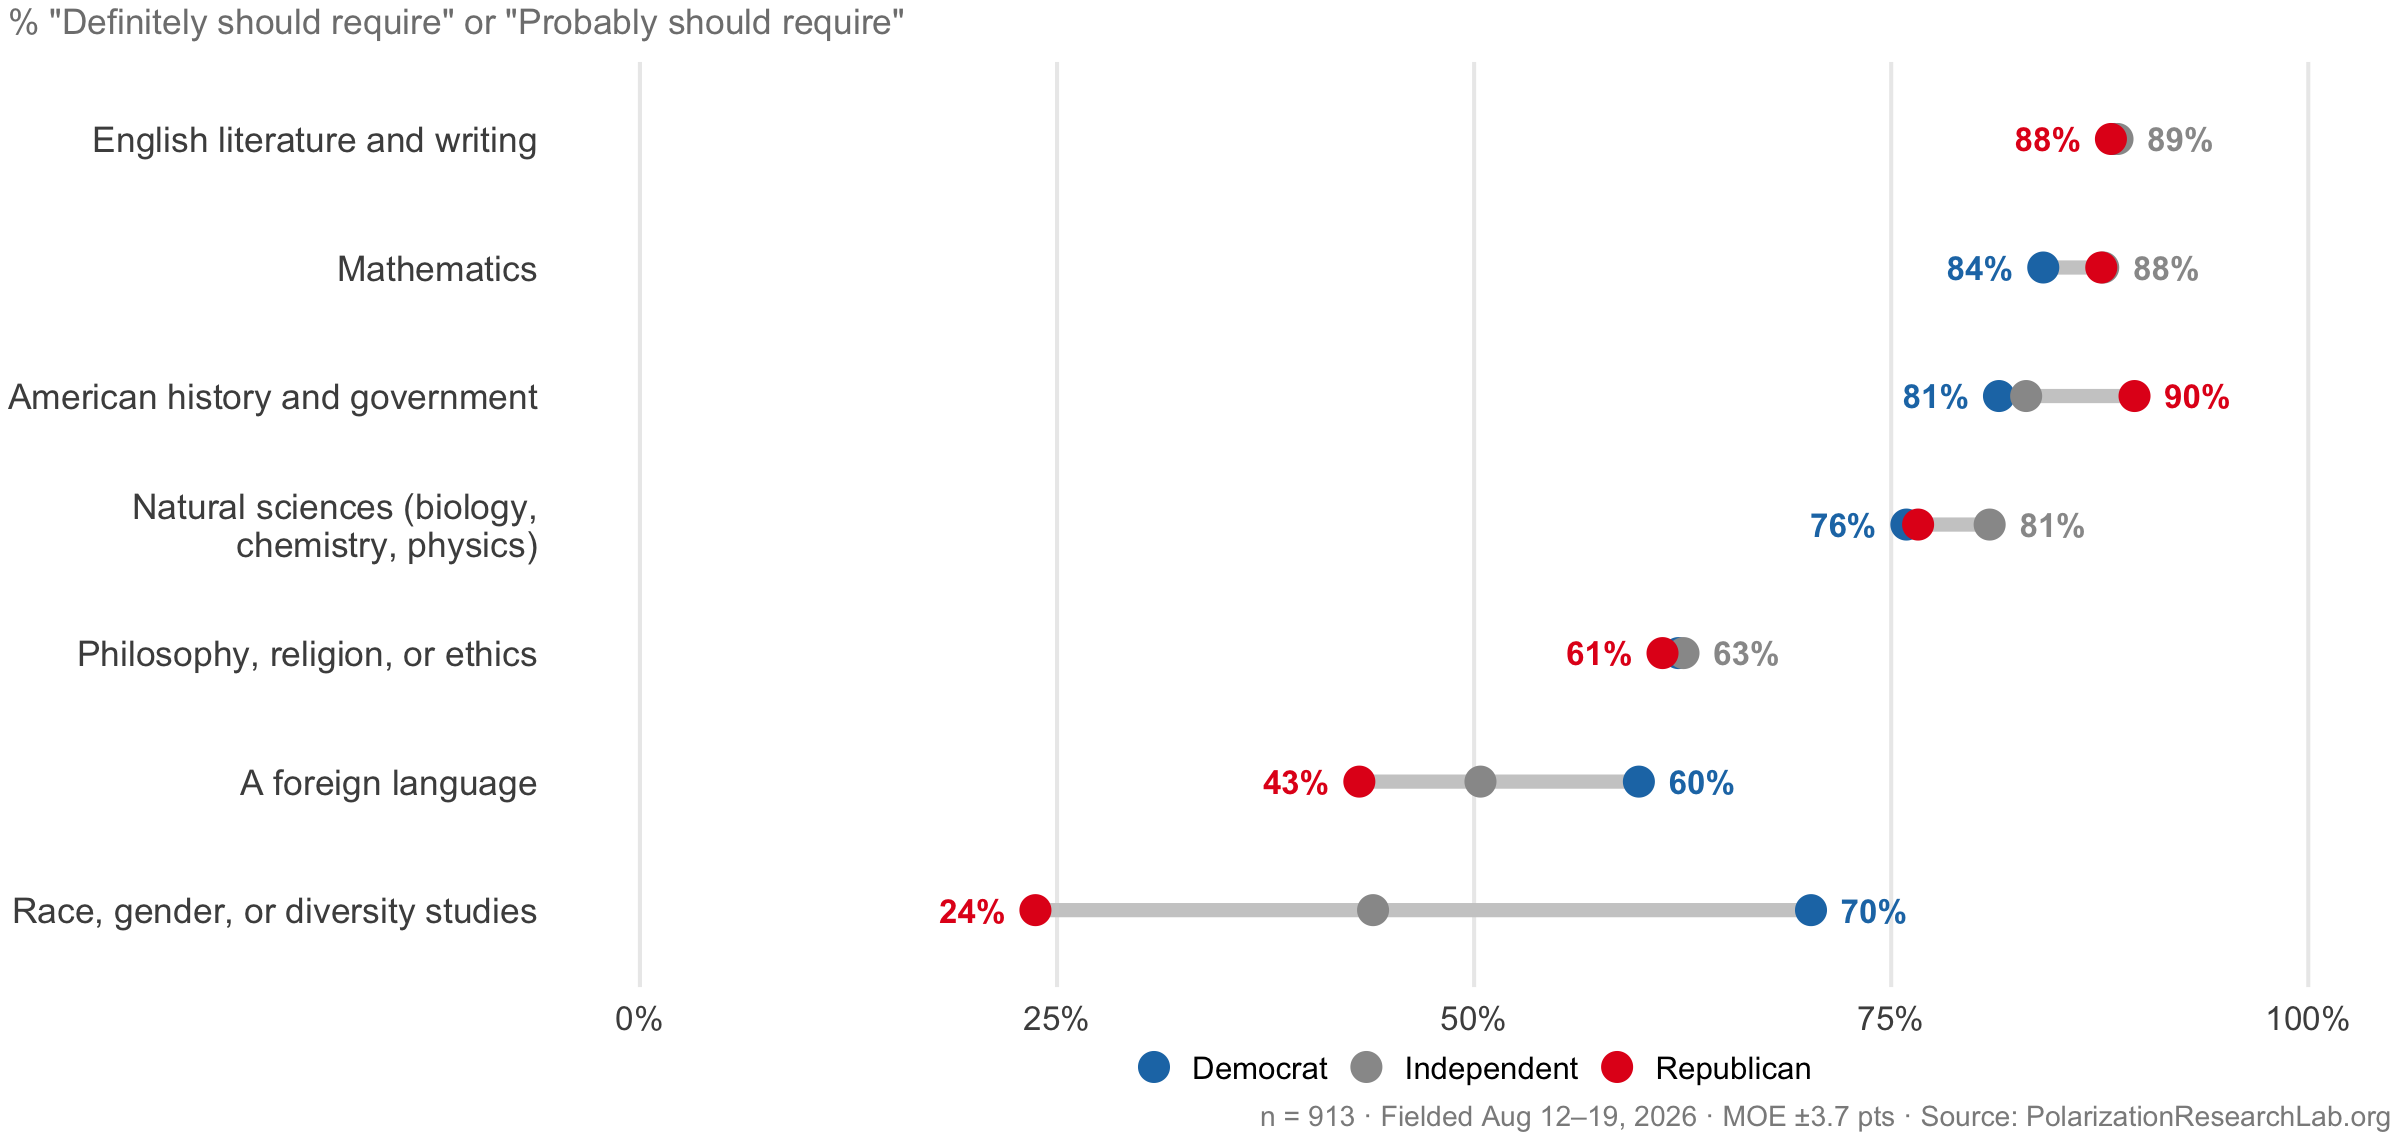
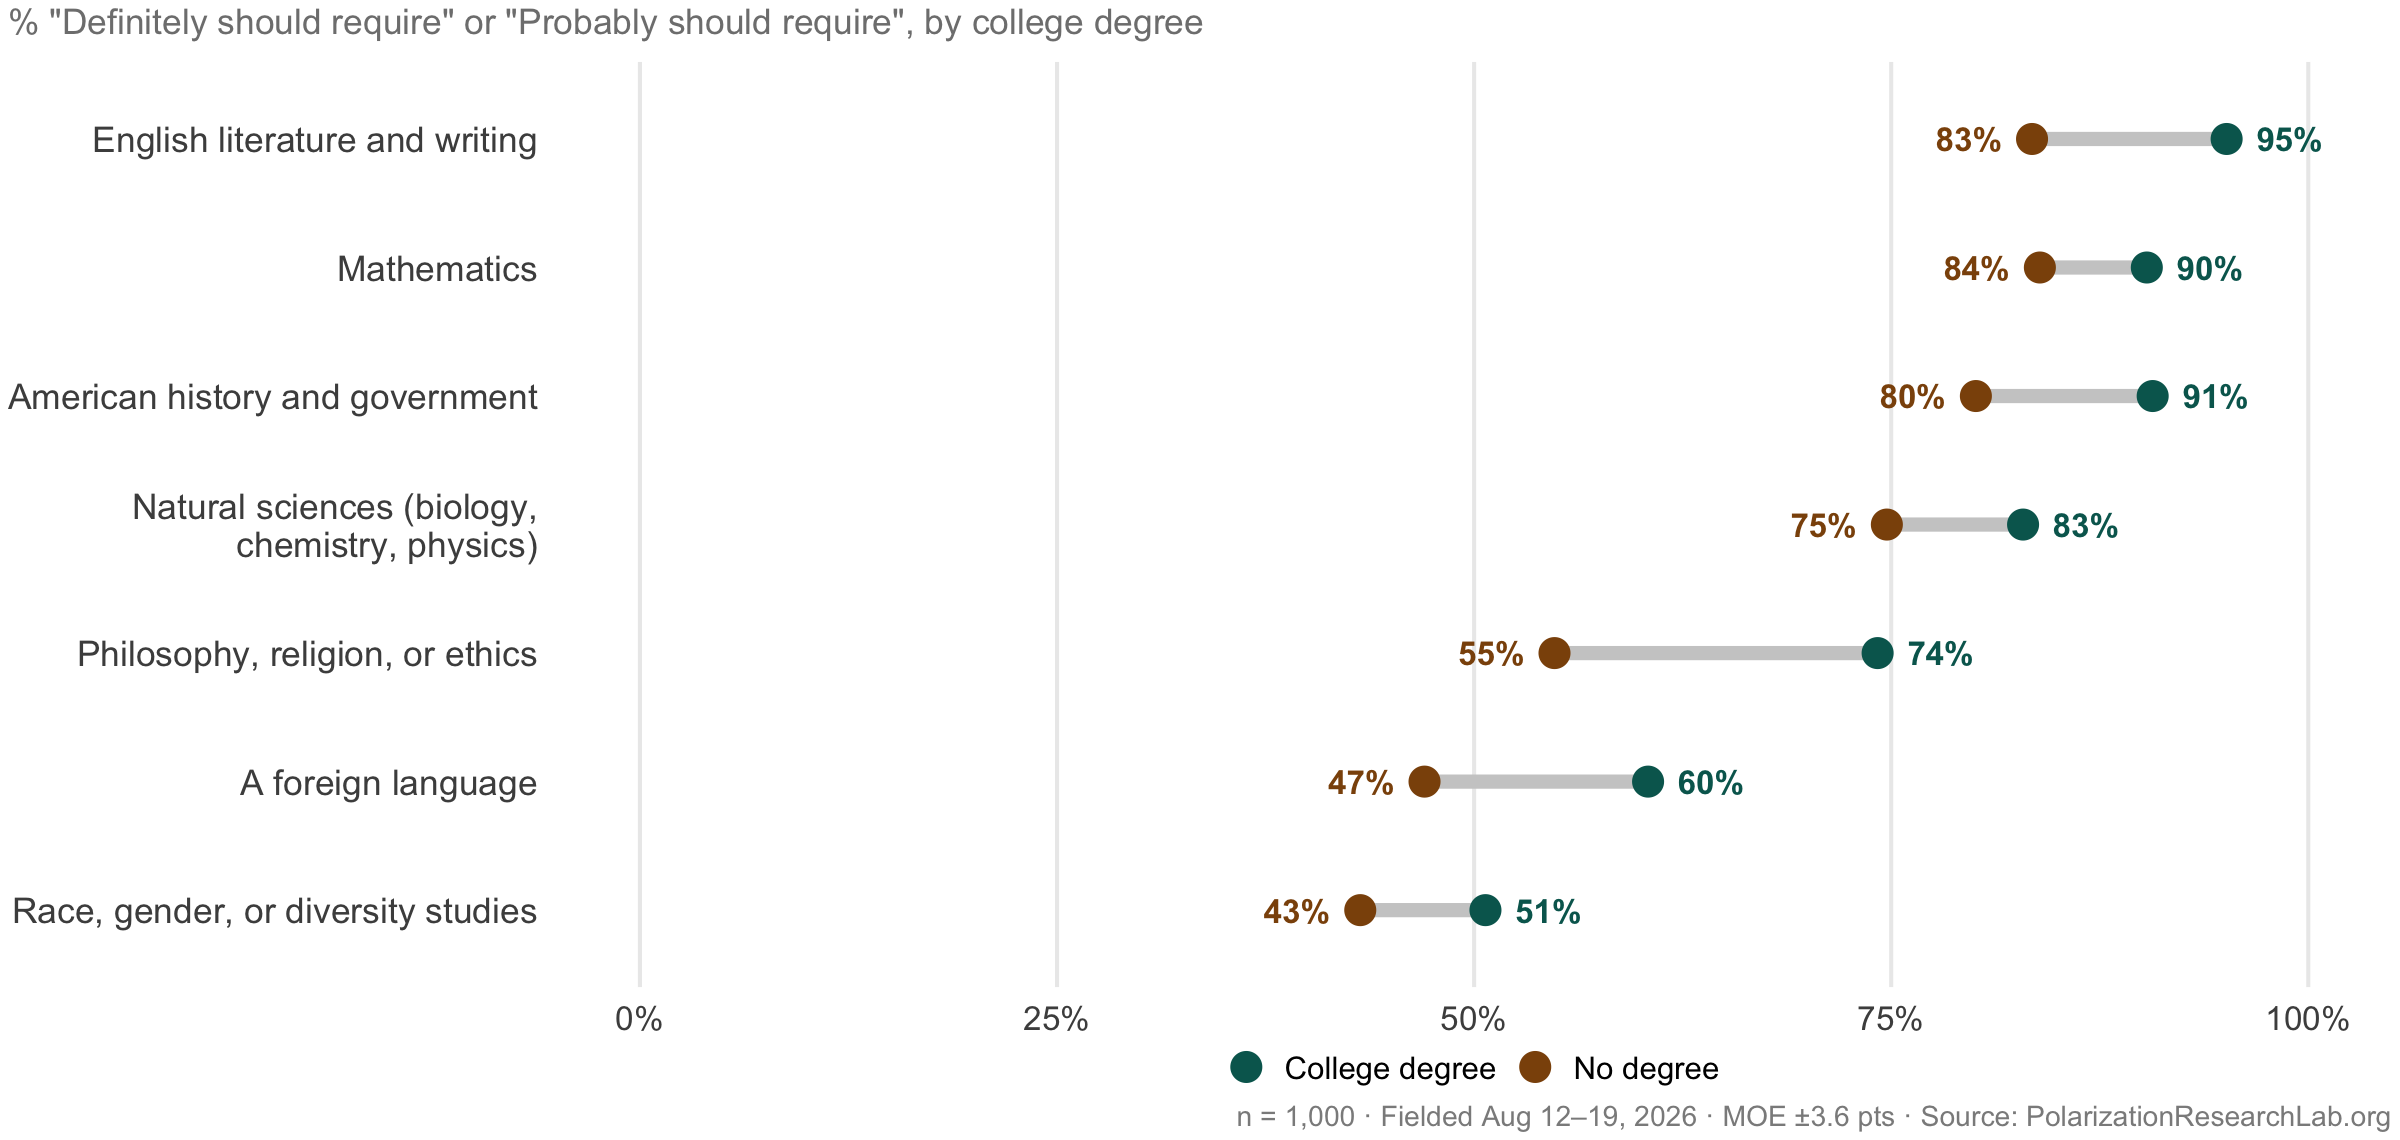
The public endorses a traditional core: English literature and writing (88%), mathematics (86%), American history and government (84%), and the natural sciences (78%) all draw broad support, with party gaps of nine points or less. Philosophy, religion, or ethics reaches 62%. The two areas below that are where the parties part ways: a foreign language (52% overall; 60% of Democrats vs. 43% of Republicans) and race, gender, or diversity studies (46% overall; 70% vs. 24% — a 46-point gap, and the only item where “definitely should not require” is the modal response).
Consensus on the canon, division over identity-centered departments
“How important is it for a typical university to maintain a department in each of the following fields?”
Every respondent rated mathematics, biology, and English; five additional fields were drawn at random from a pool of twelve, so the rotating items have smaller samples (roughly n = 400 each, and 110–140 per party).
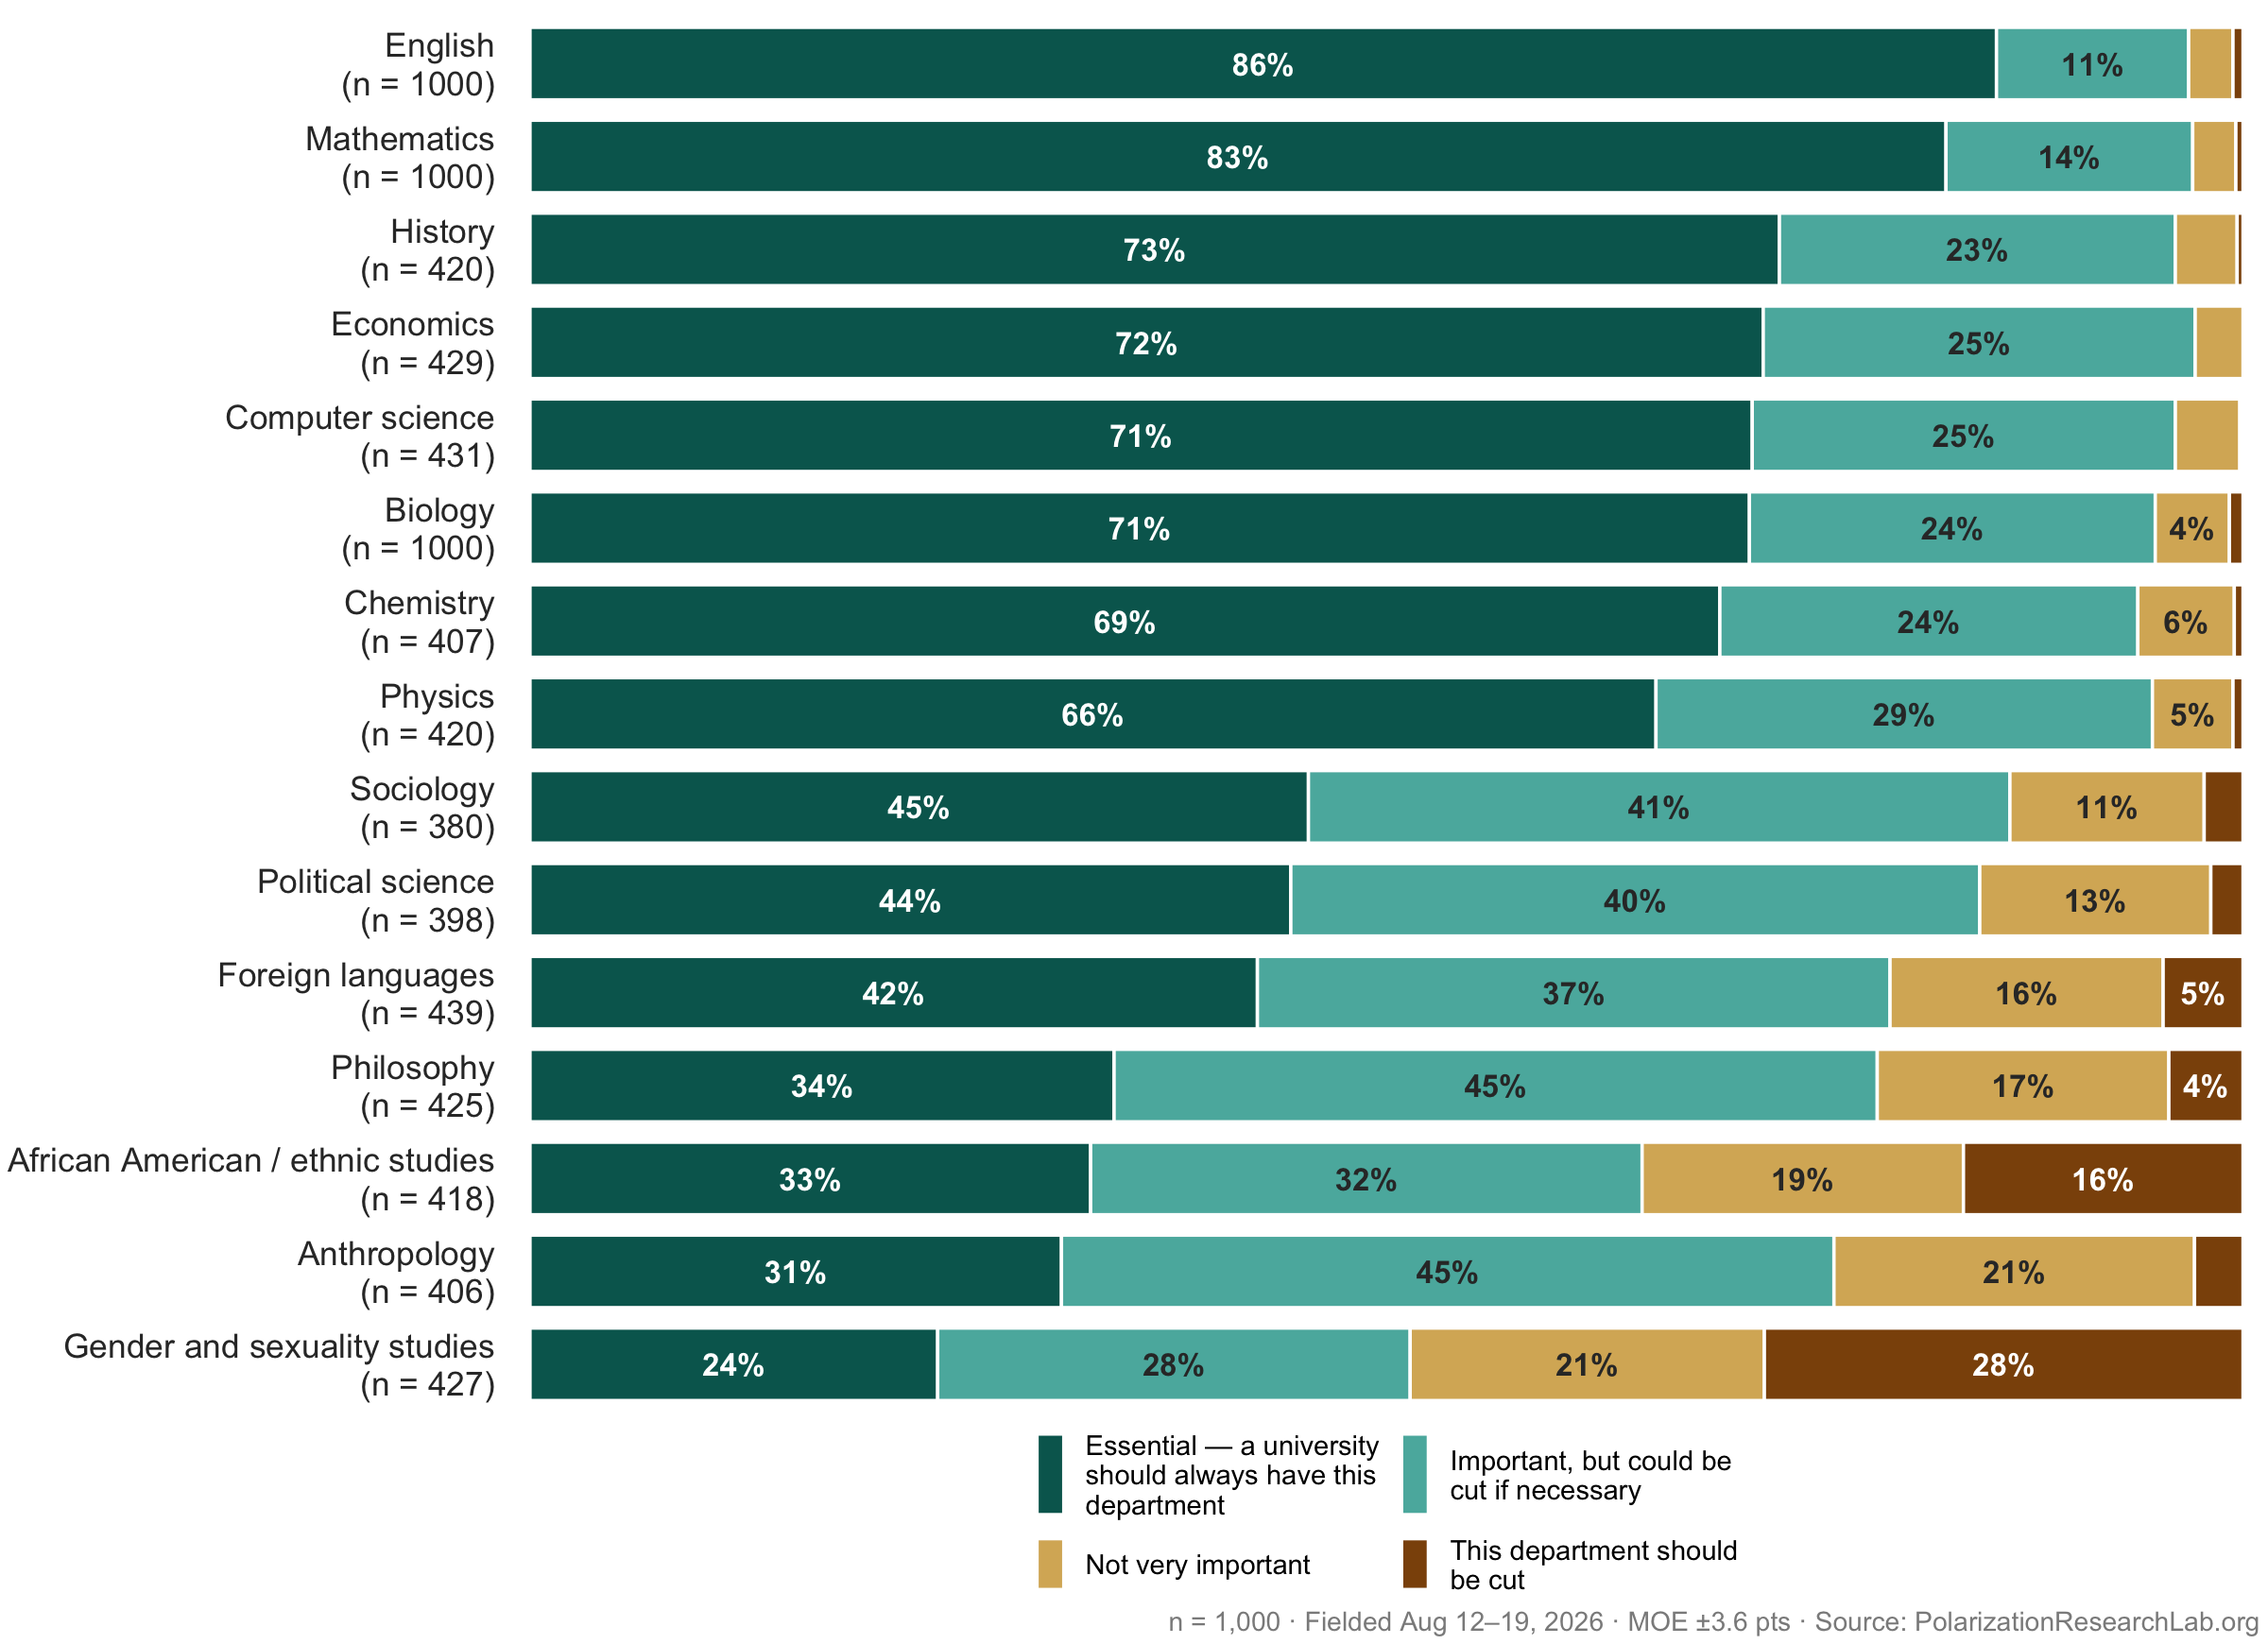
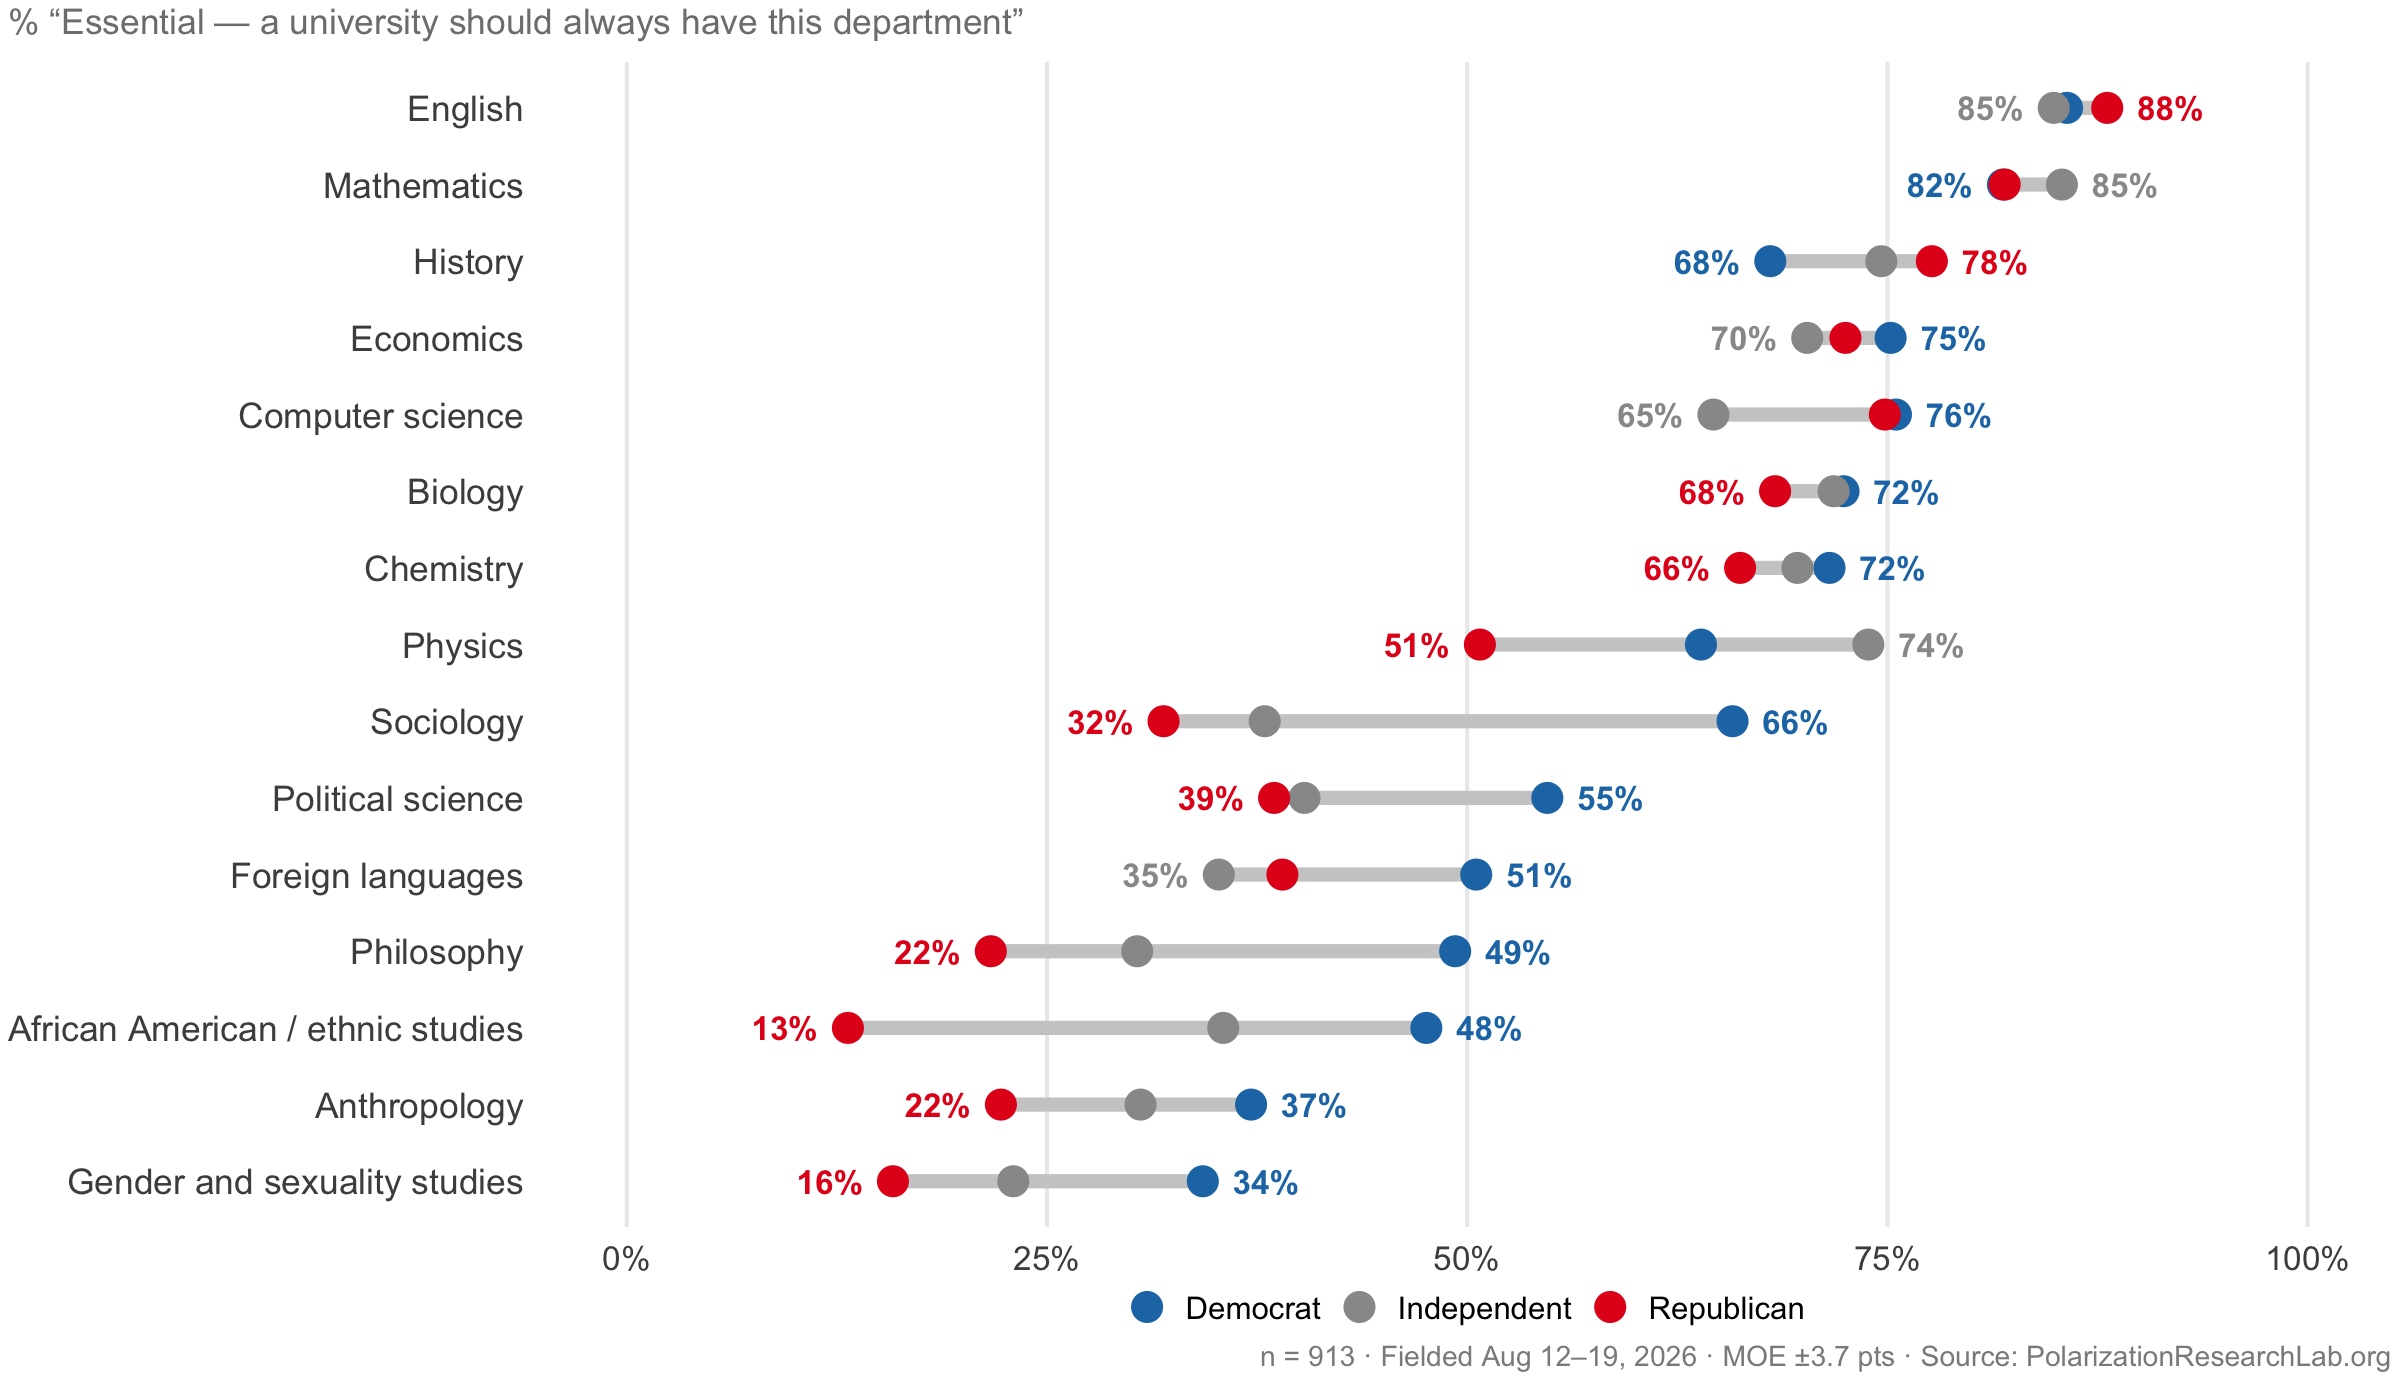
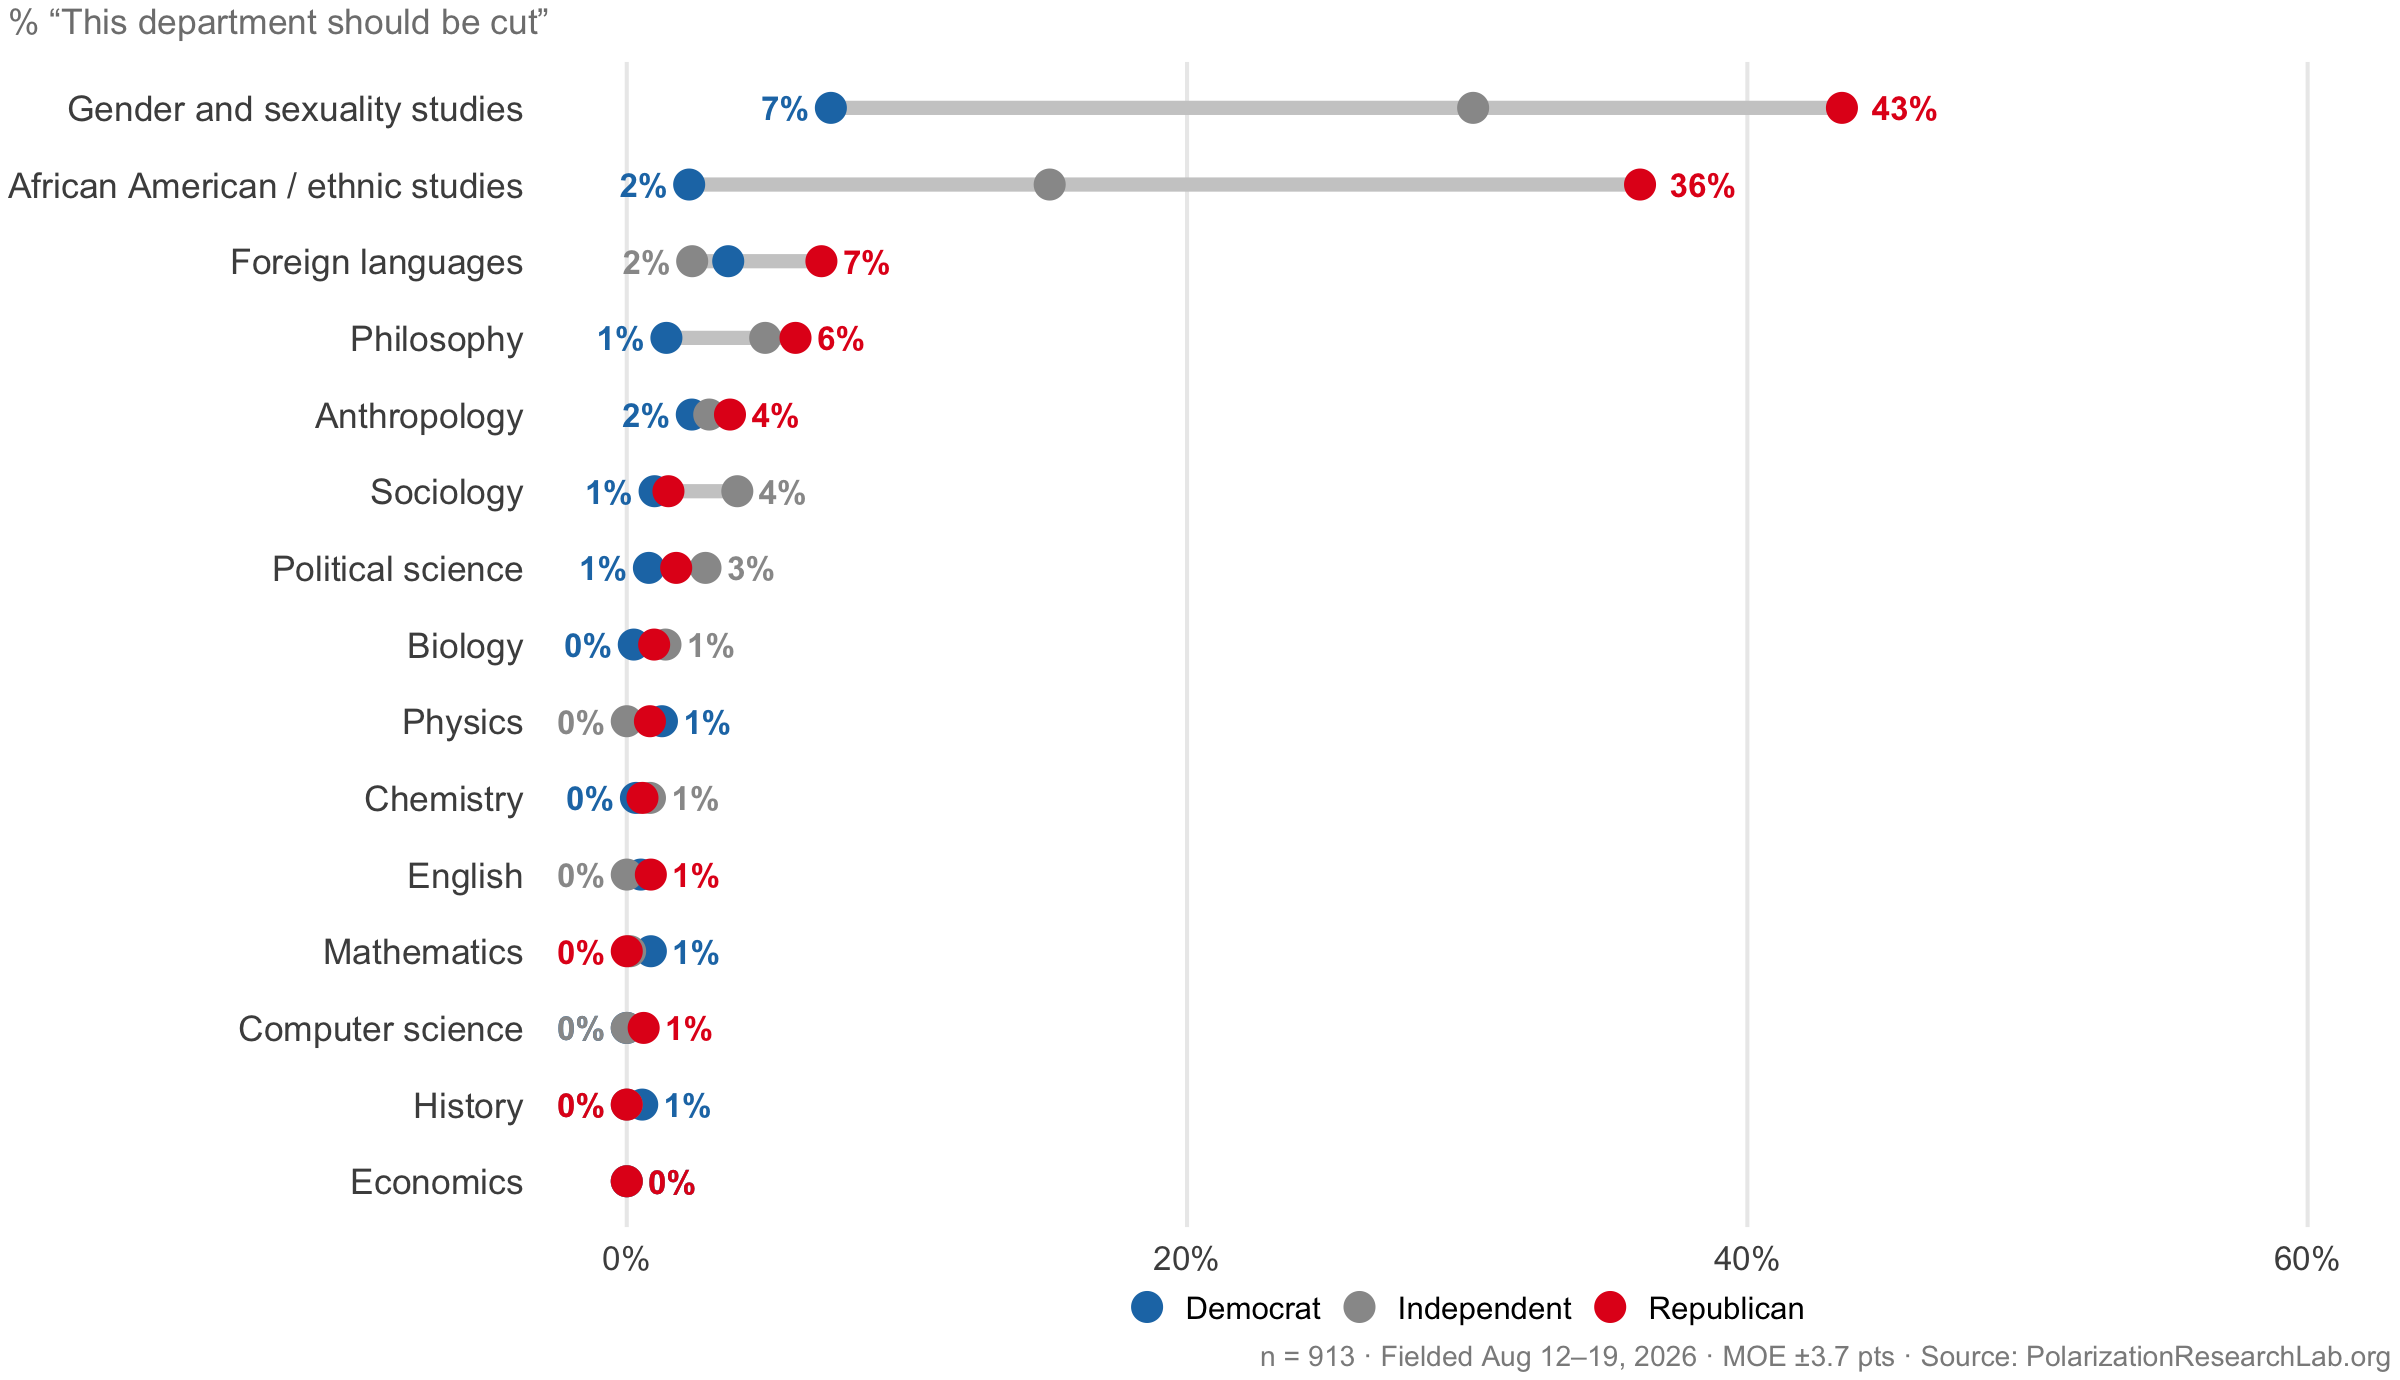
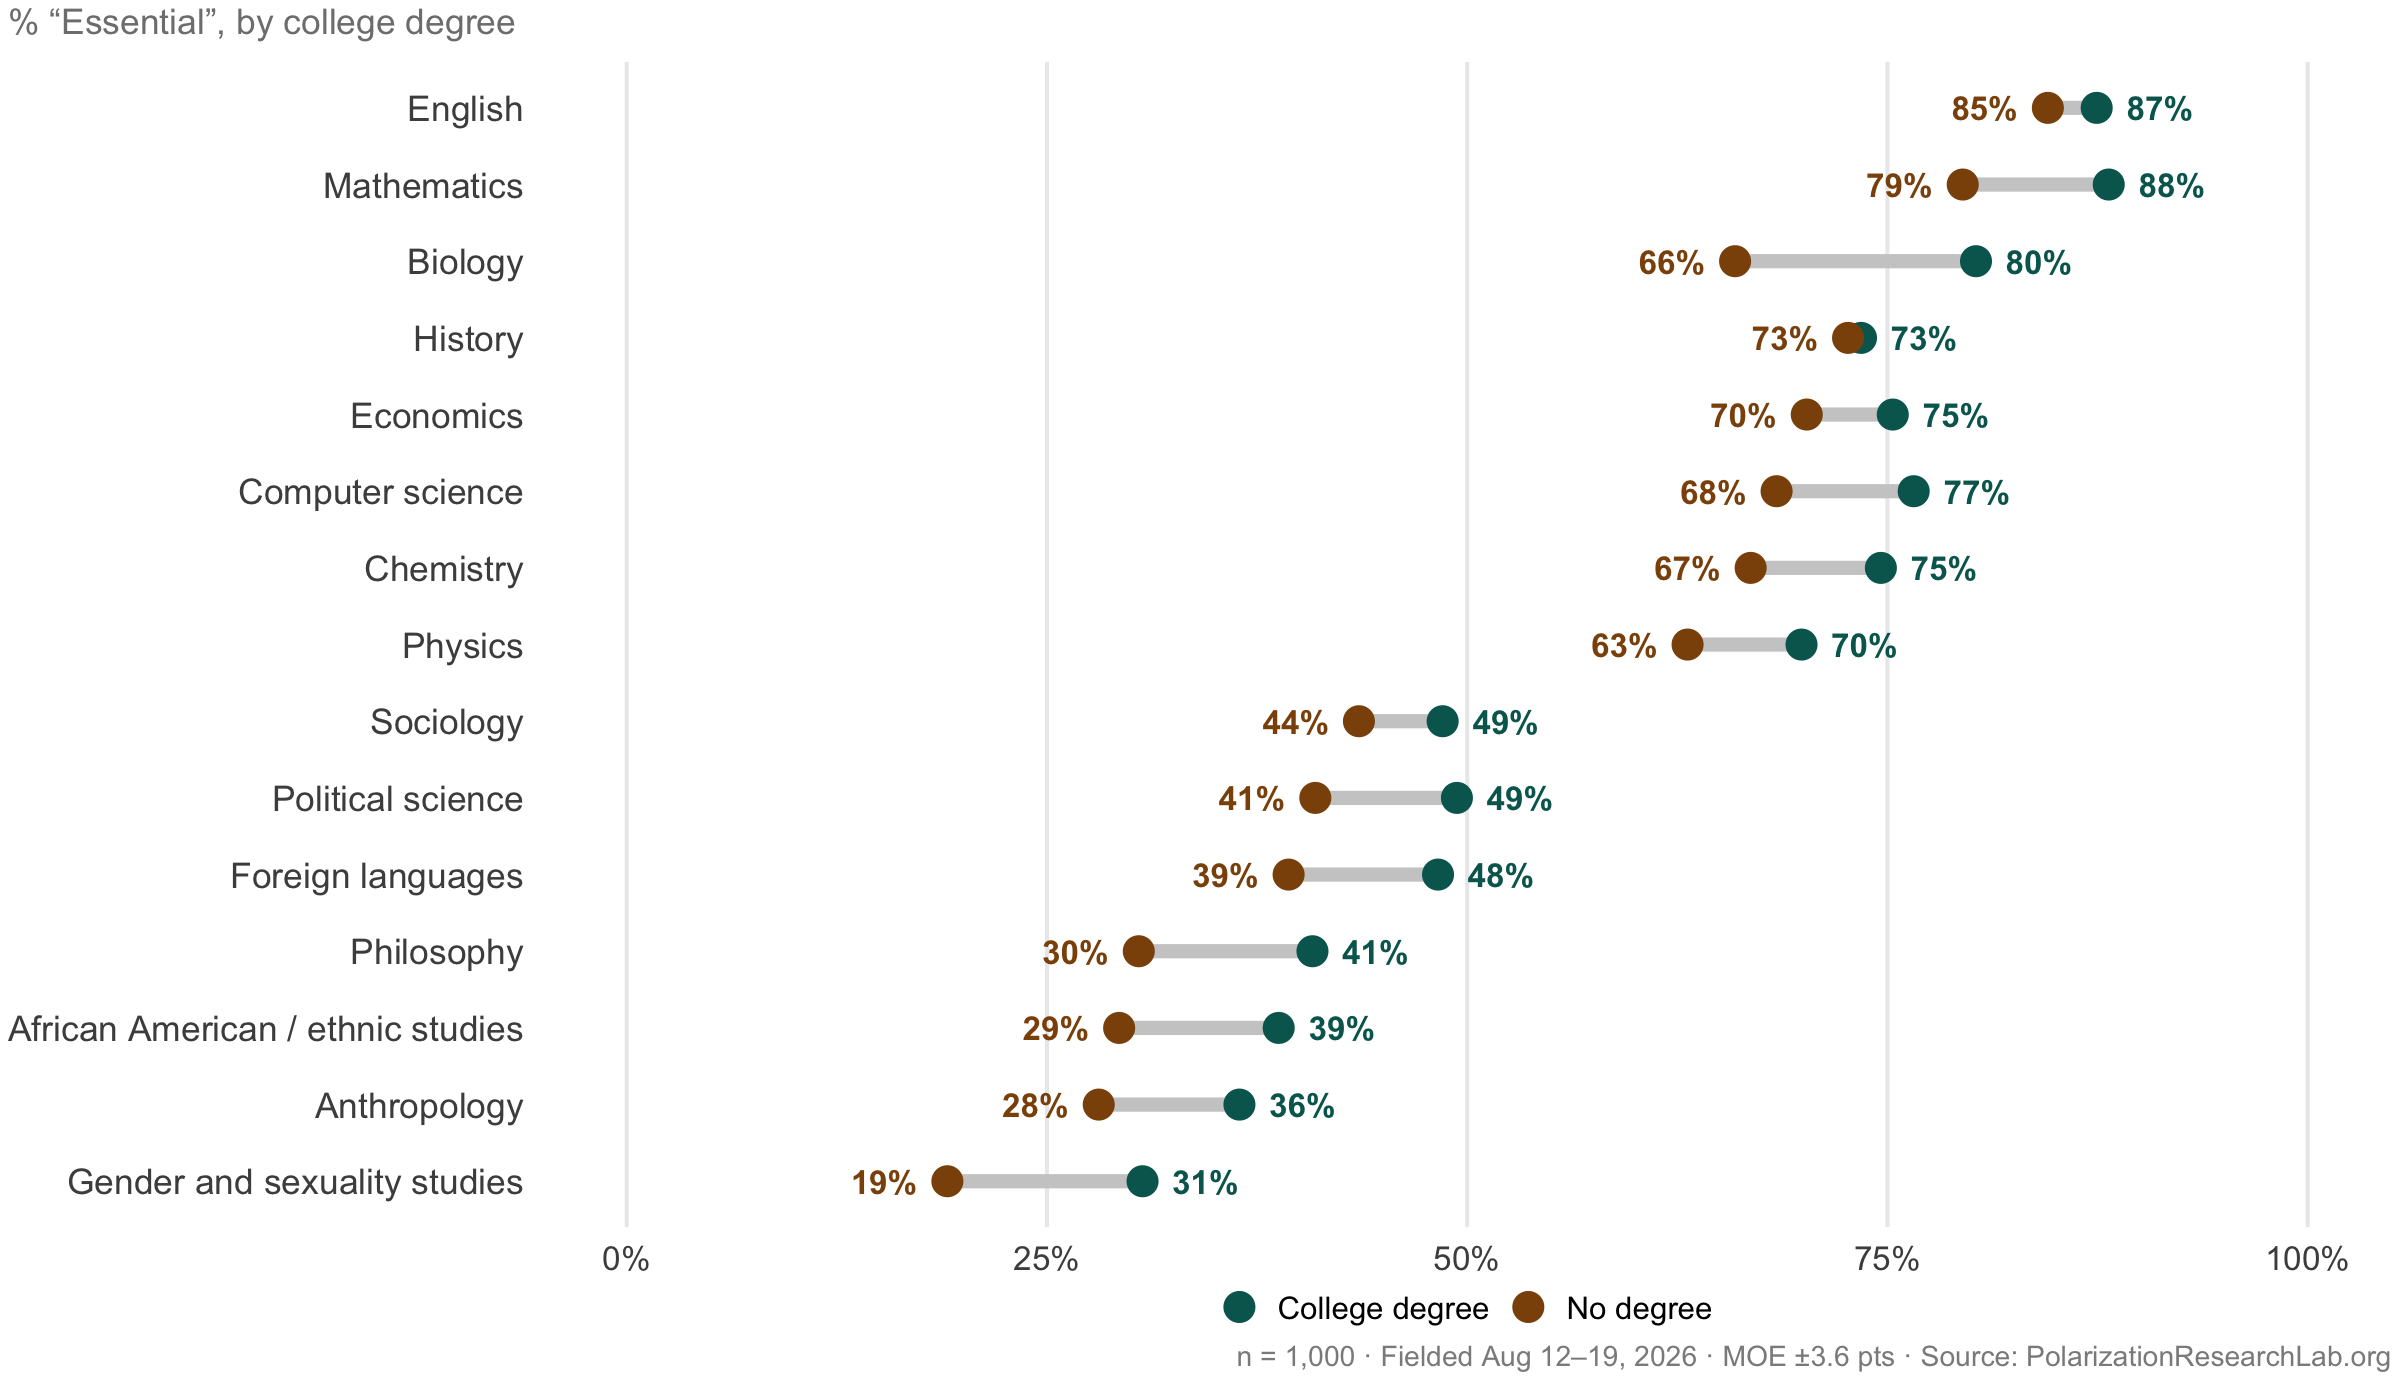
The results form three tiers. The anchors and the hard sciences are consensus fixtures: two-thirds or more call English, mathematics, history, economics, computer science, biology, chemistry, and physics essential, and essentially nobody in either party would cut them. The social sciences and humanities occupy a middle tier (roughly 30–45% essential) where the dominant answer is “important, but could be cut if necessary.” The identity-centered fields stand apart: gender and sexuality studies is the only department where more respondents would cut it (28%) than call it essential (24%). That bottom tier is almost entirely a partisan artifact — 43% of Republicans would cut gender and sexuality studies and 36% would cut African American / ethnic studies, against 7% and 2% of Democrats. For every other department, including sociology and political science, the “cut” share stays in single digits in all three party groups.
4 Faculty Ideology and Hiring
A slim majority sees professors as politically neutral
“Do you think most college professors generally push a particular political agenda in their teaching?”
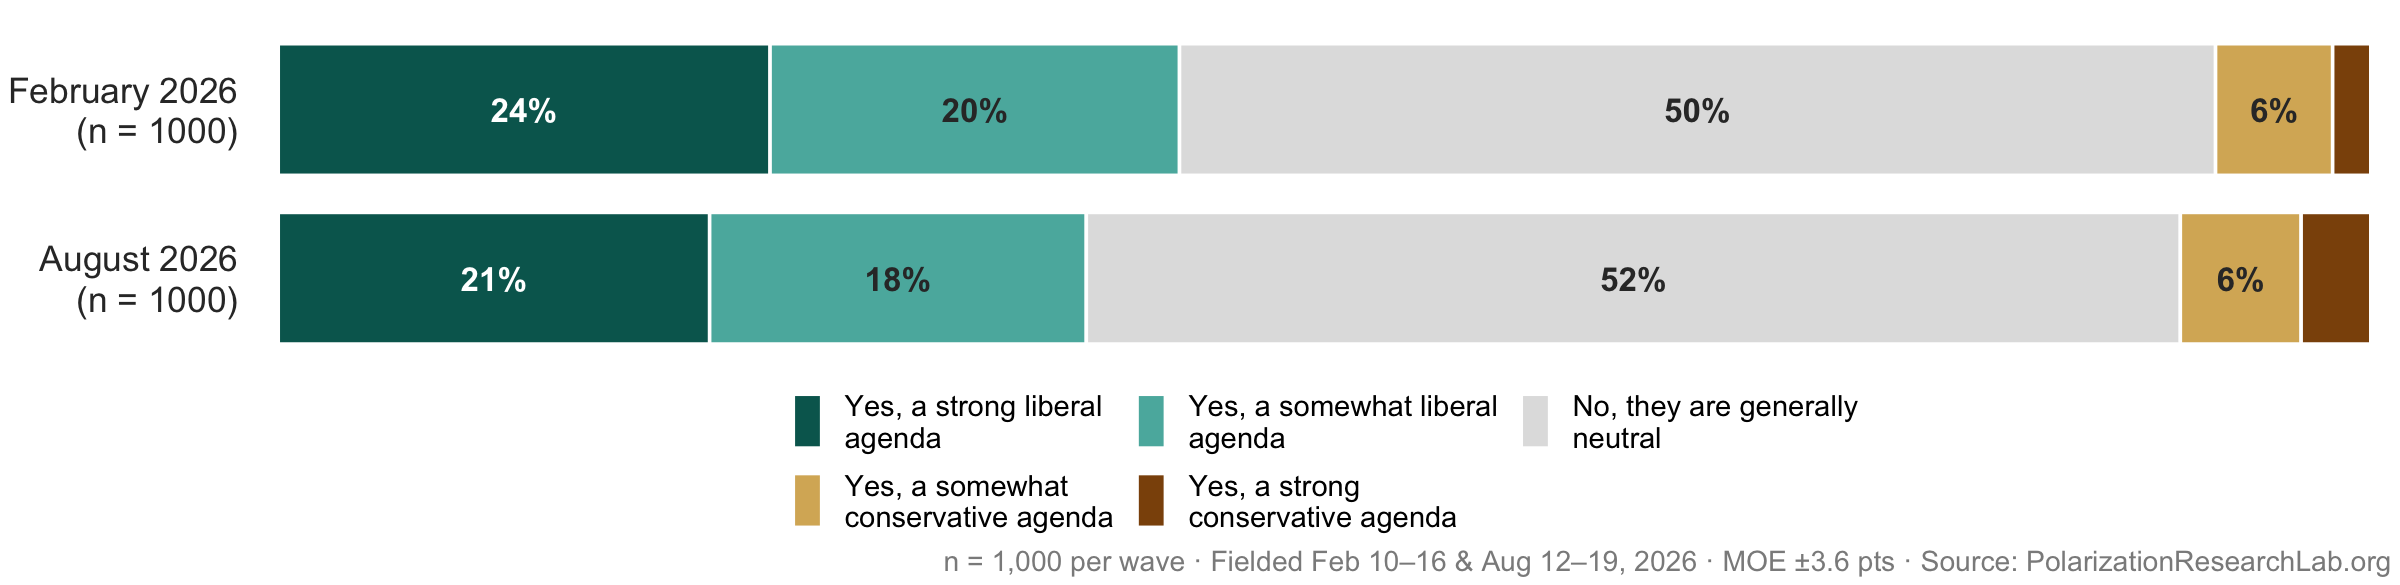
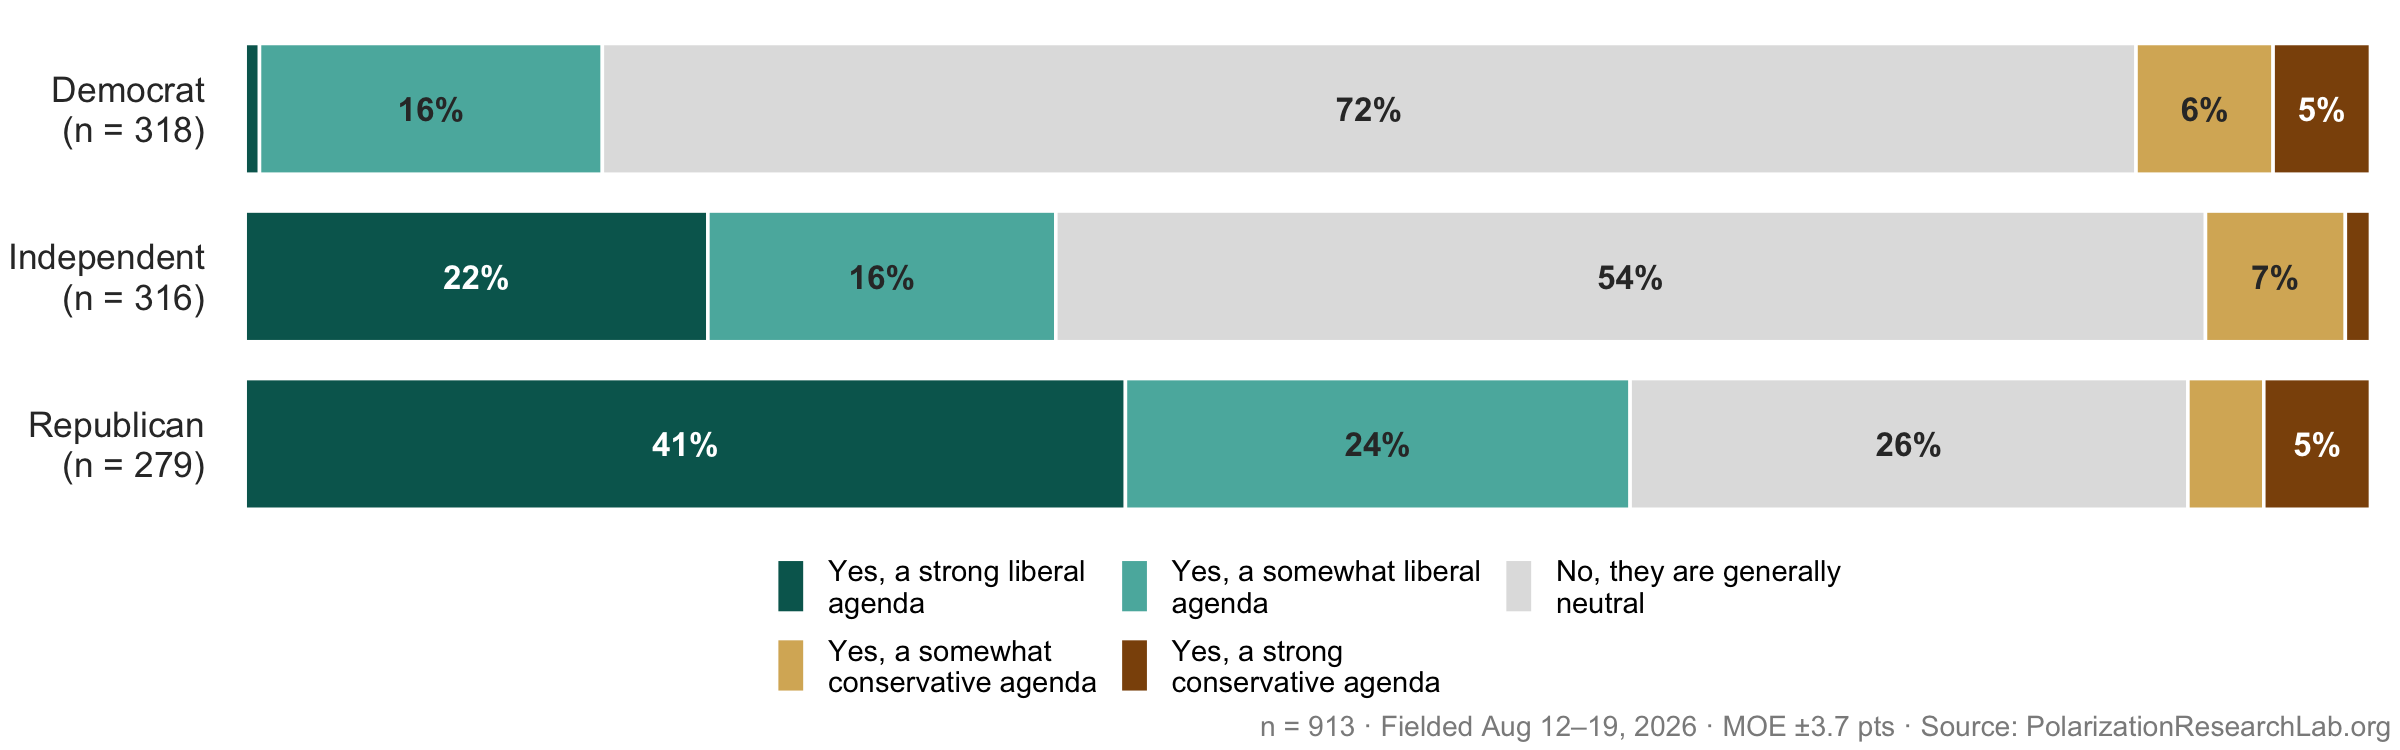
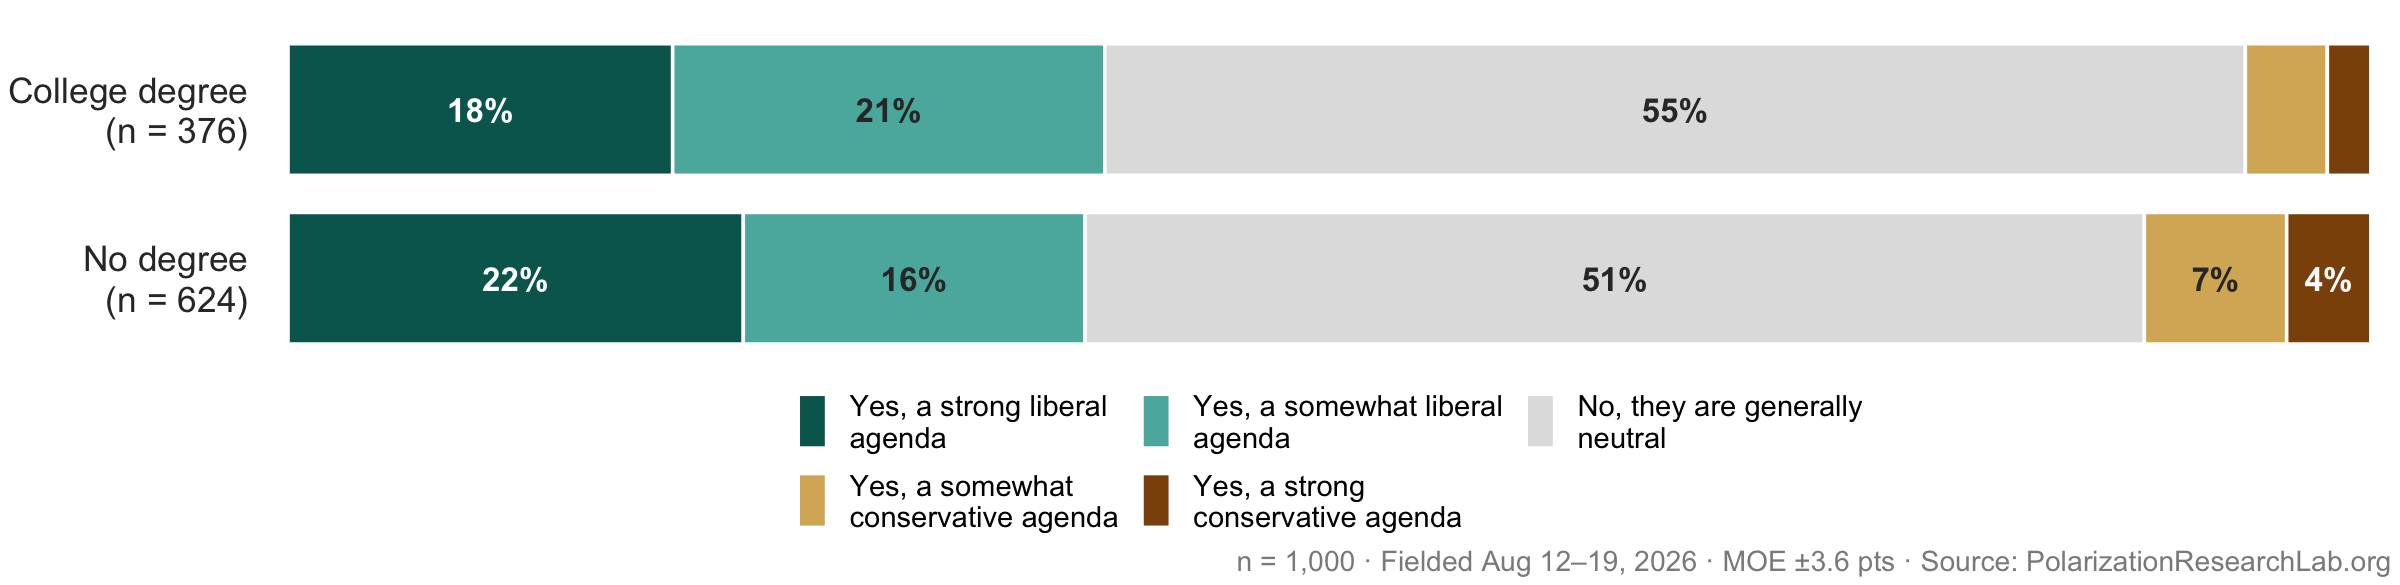
A slim majority (52%) says professors are generally neutral. Among those who perceive an agenda, it is overwhelmingly a liberal one — 39% against 9% who see a conservative agenda. Neither figure changed significantly between February and August.
Concern about the faculty party imbalance is growing
“About 25% of Americans identify as Republican, but on average only 6% of faculty identify as Republican. How much of a problem do you think this is?”
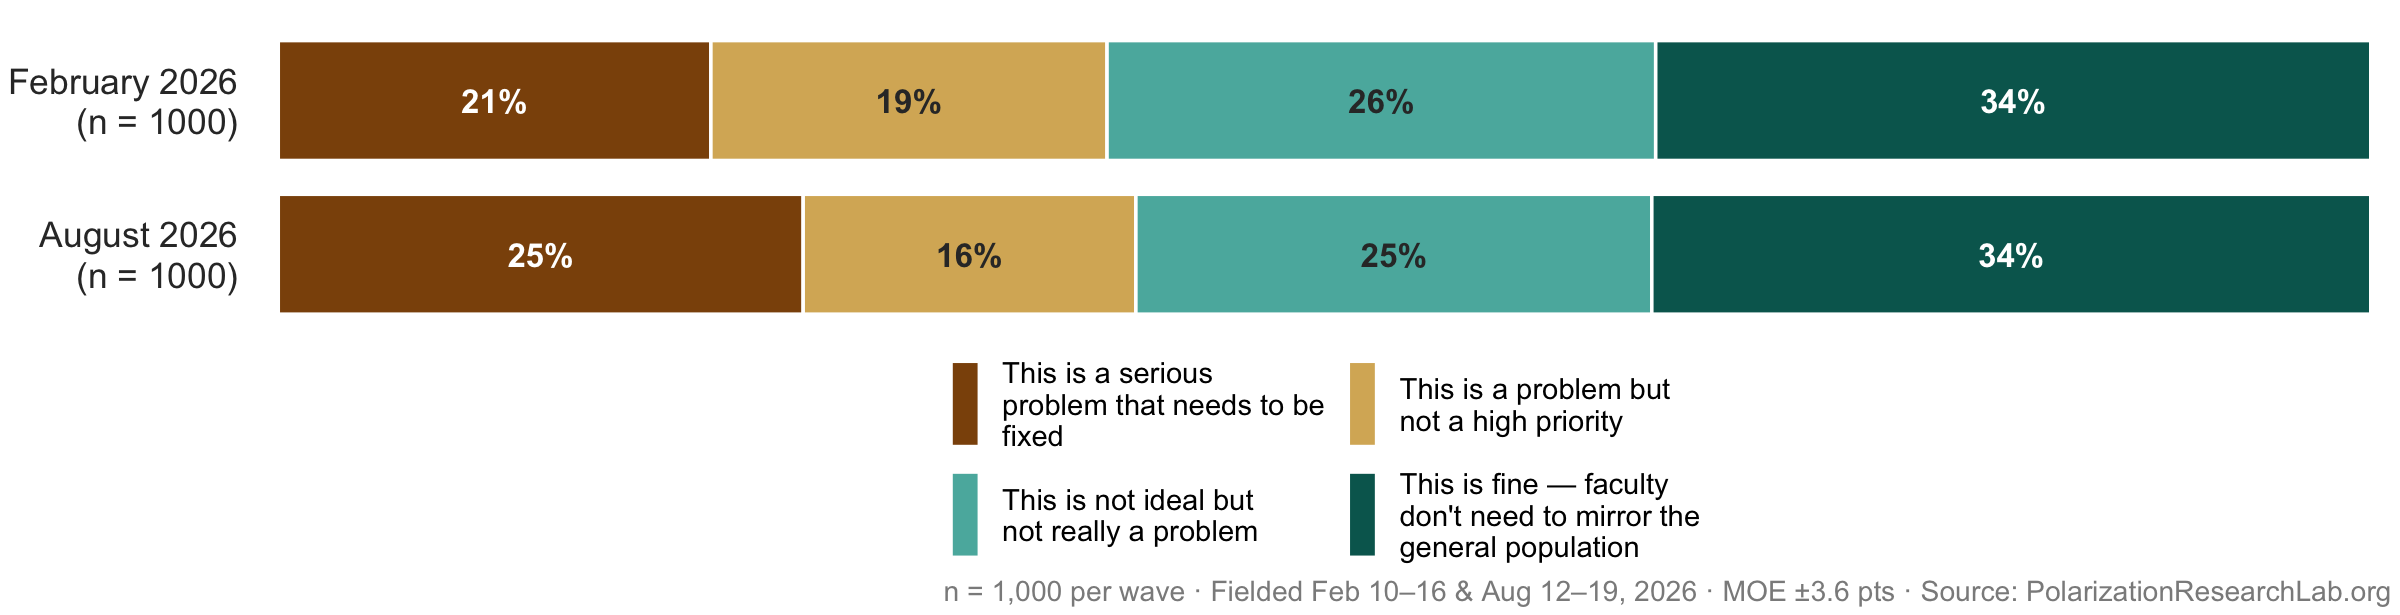
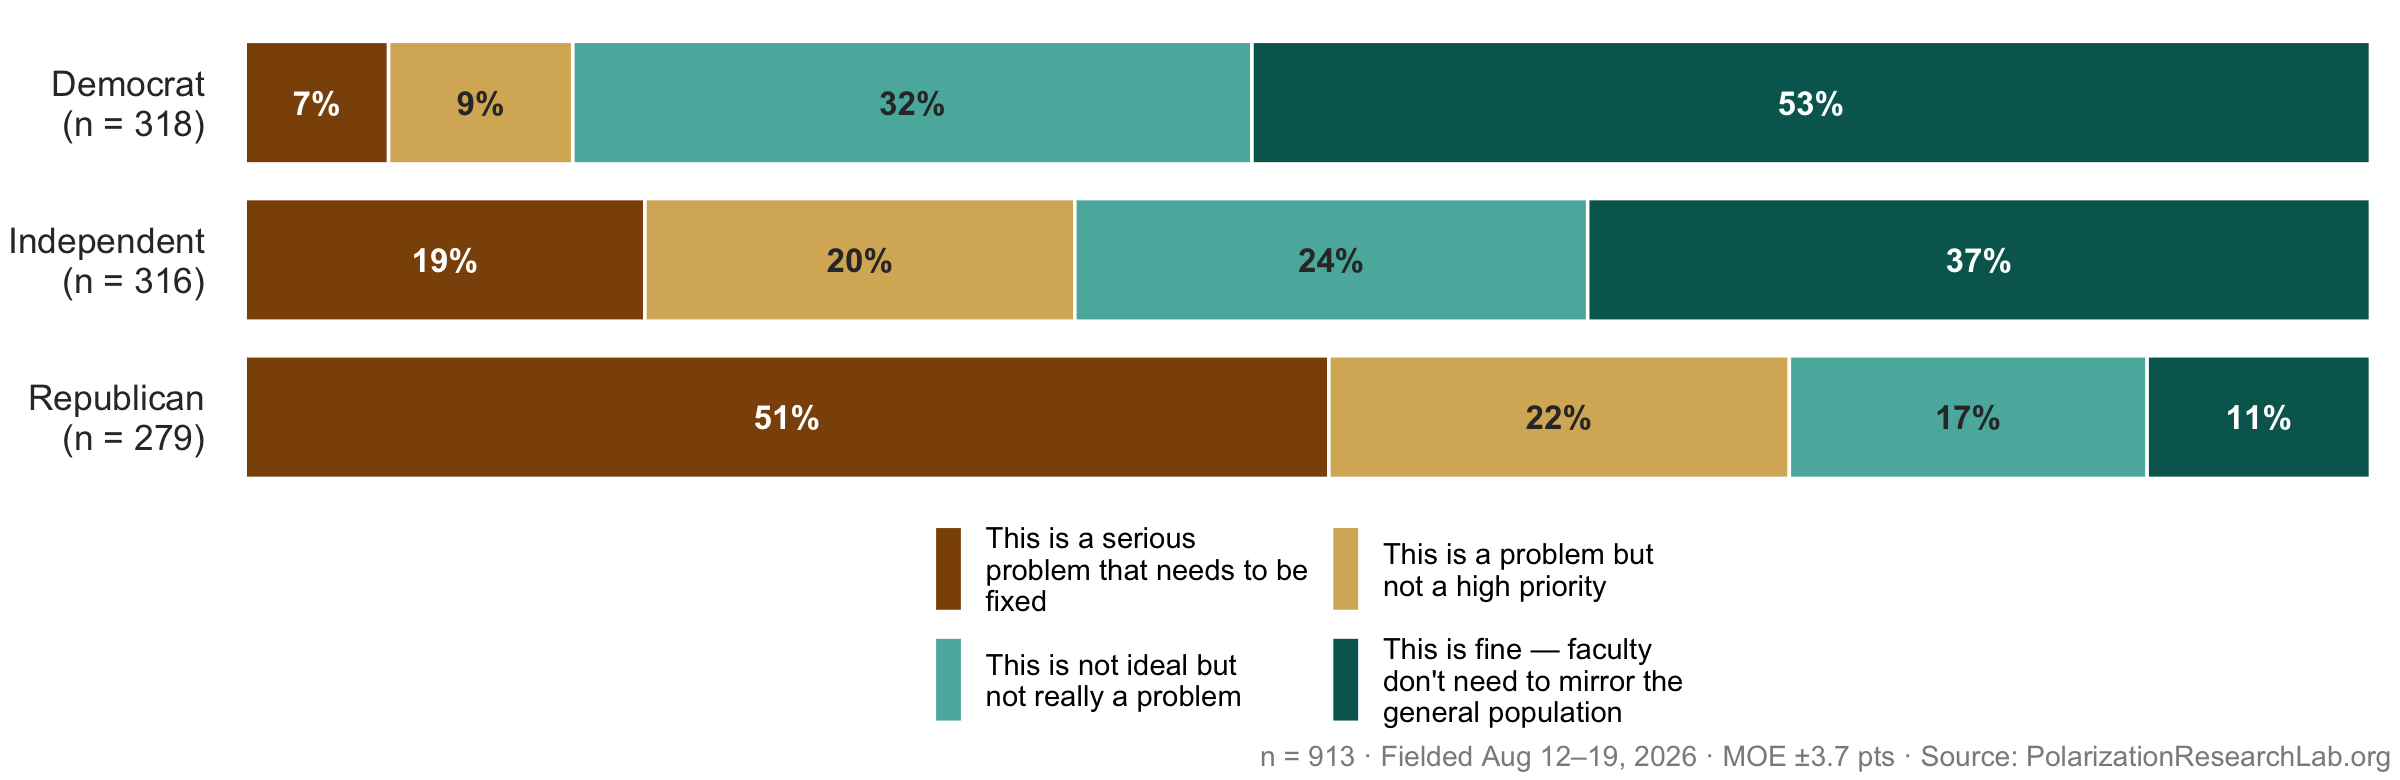
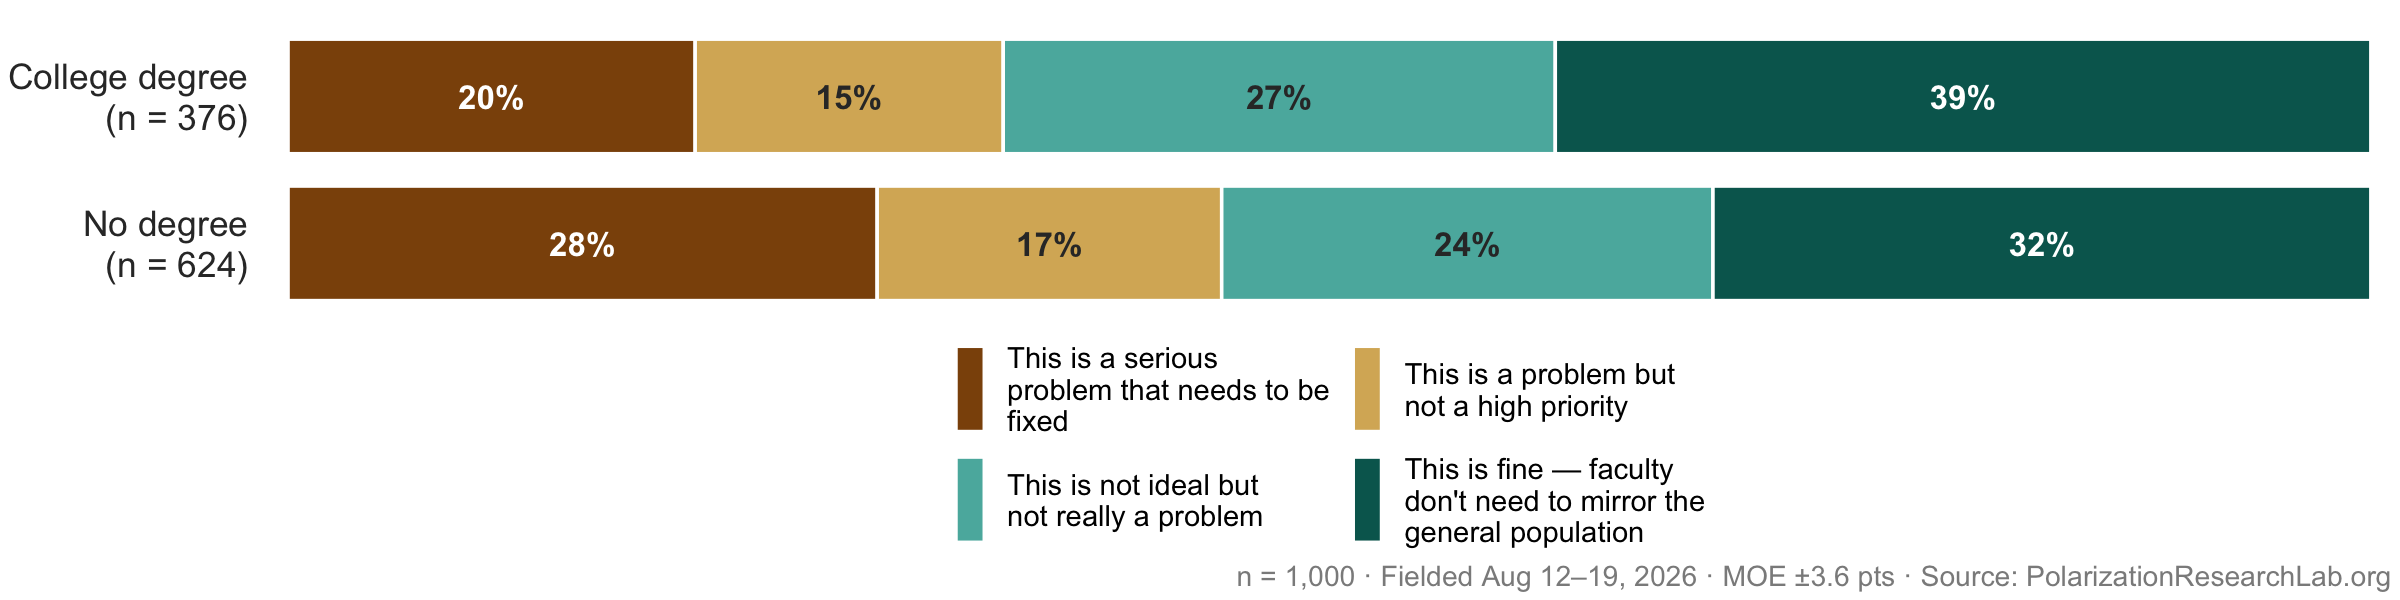
Told the actual partisan composition of the professoriate, 25% call it a serious problem that needs to be fixed — up 4 points since February and the clearest sign in the survey that the ideology critique is gaining ground. The largest single group (34%) still says faculty don’t need to mirror the population.
No single explanation for the imbalance dominates
“How much is each of the following a factor in the political imbalance of university faculty?” Asked in both waves; wording carried over from the February questionnaire.
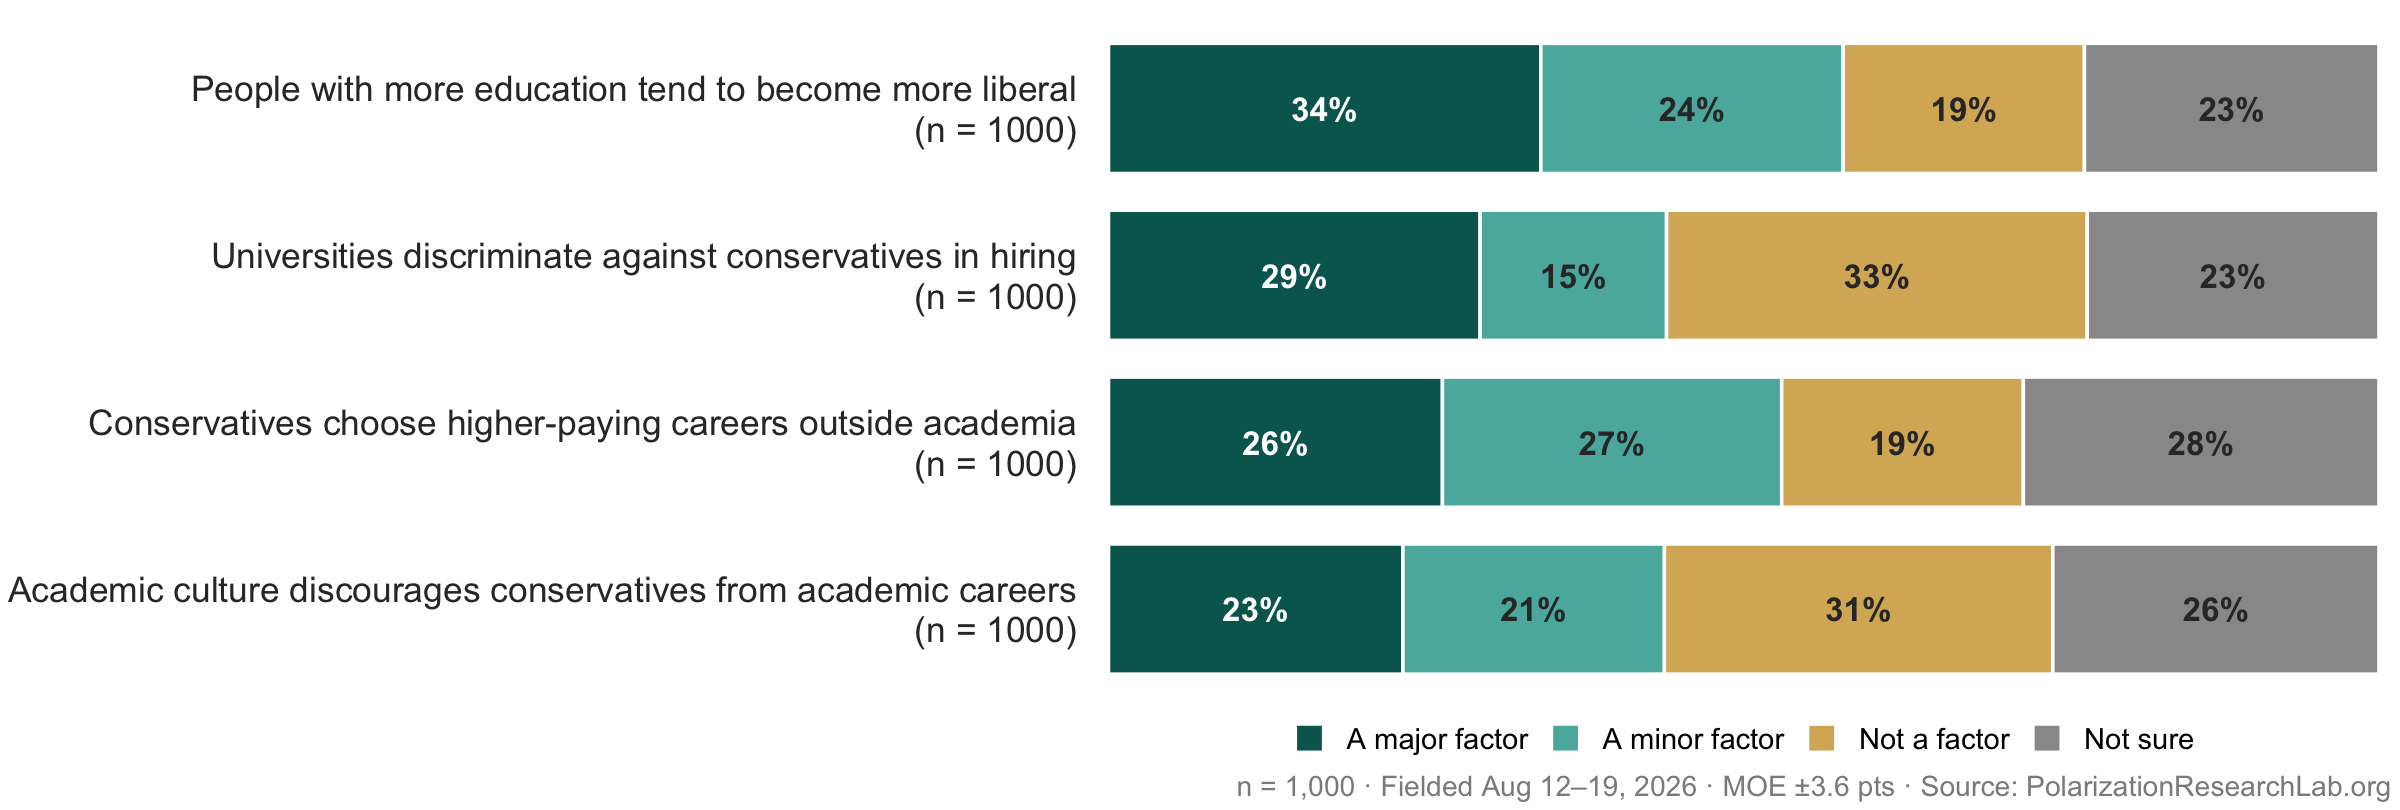
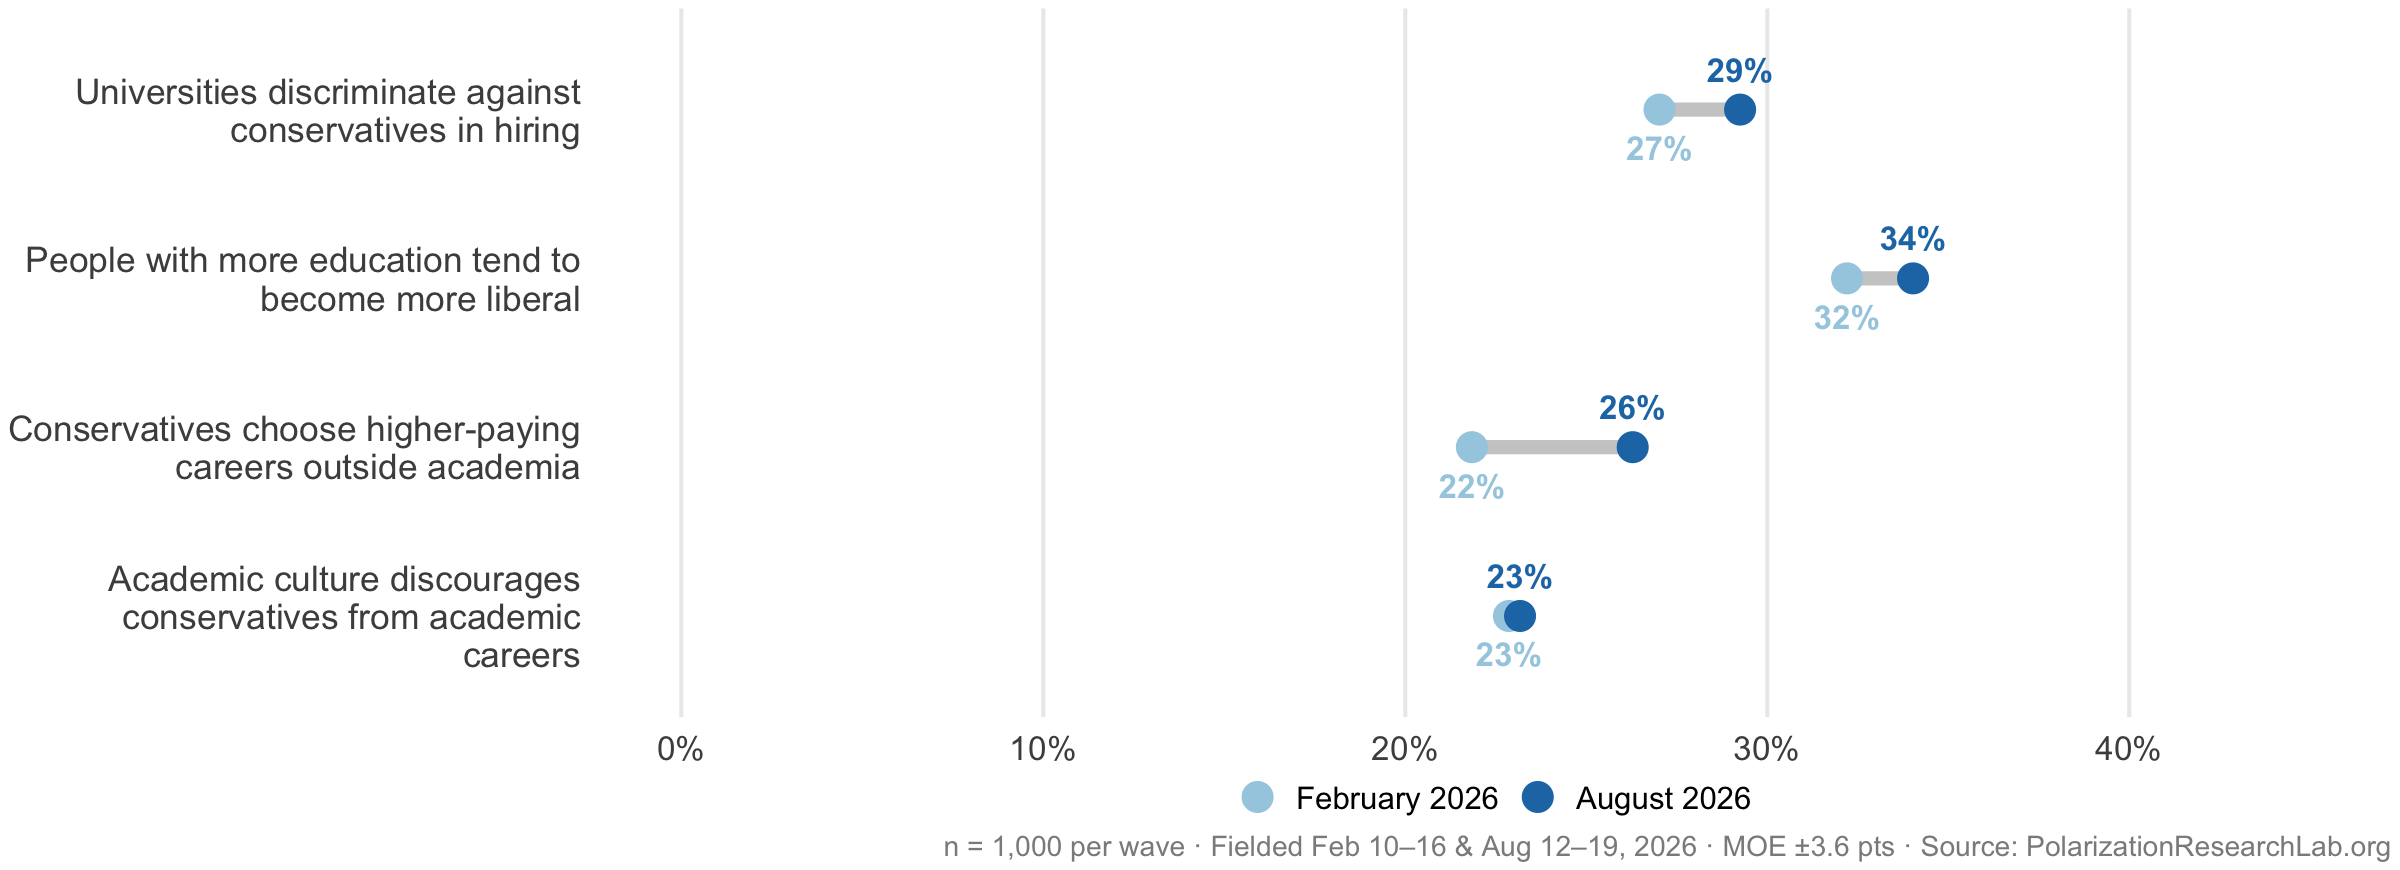
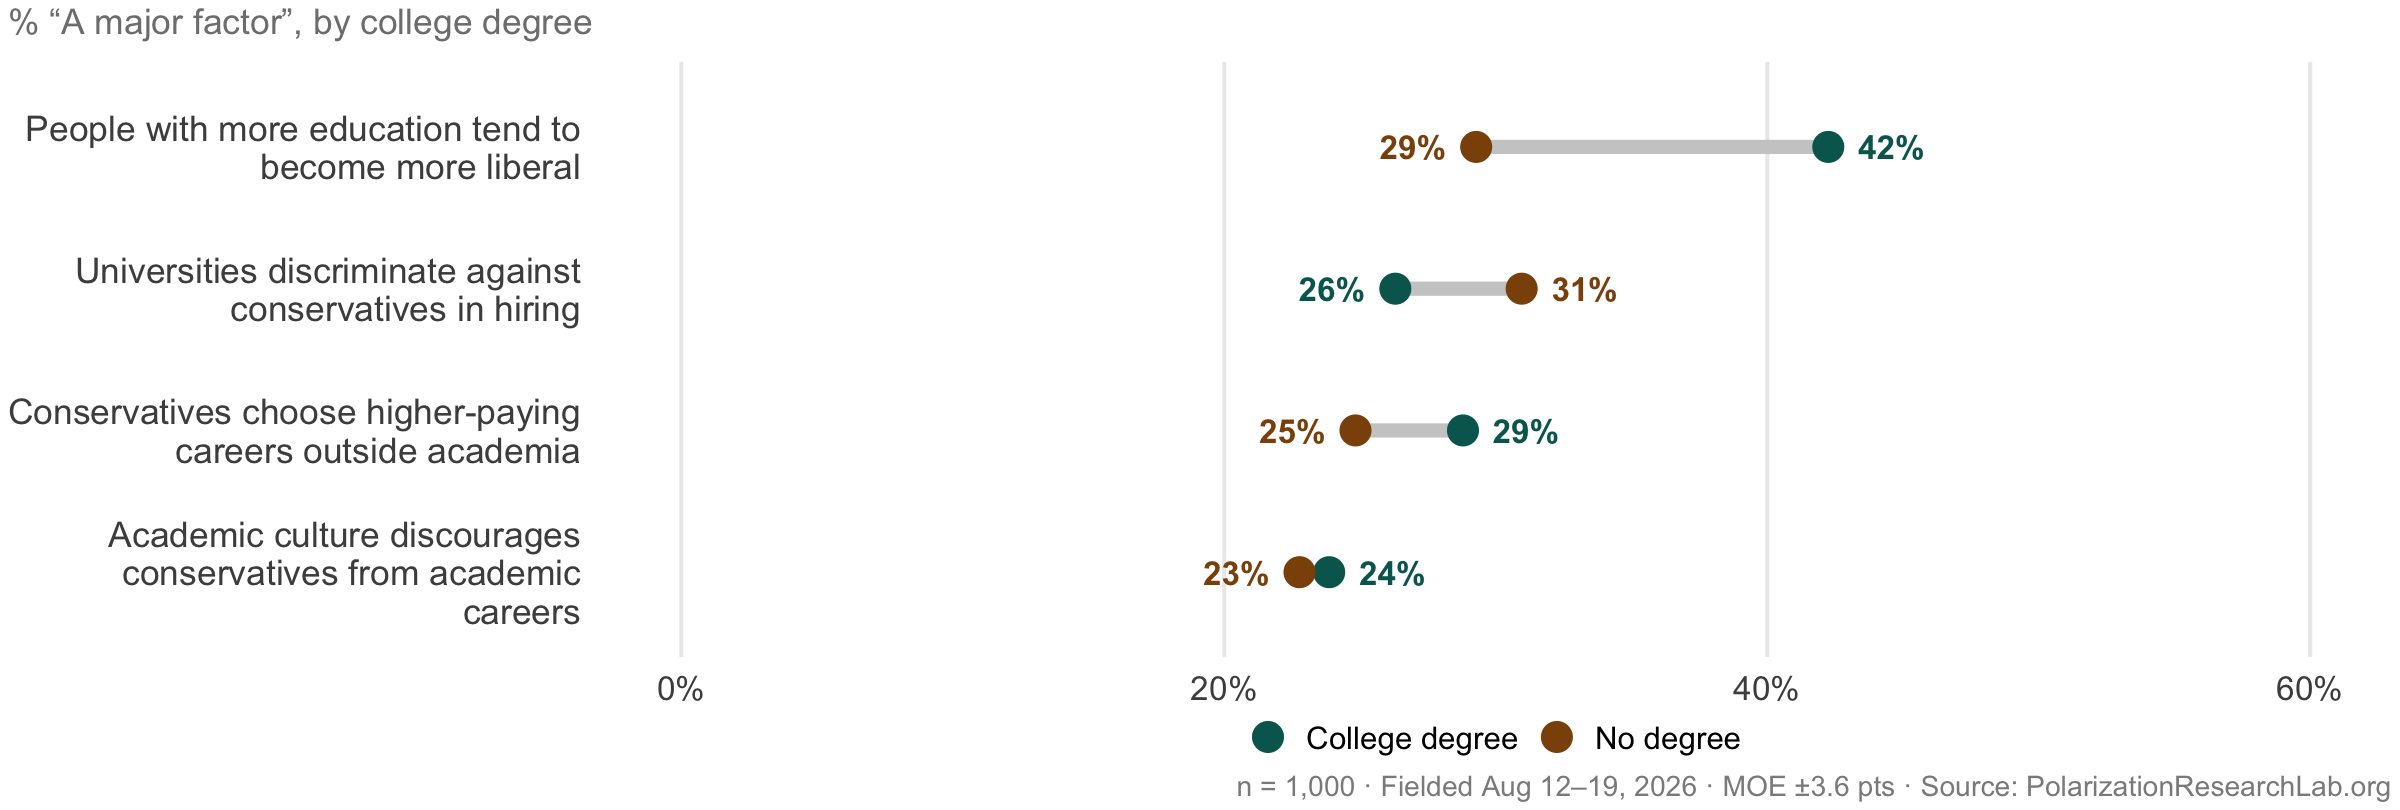
No single explanation dominates. The most-endorsed account is the benign one — that education itself makes people more liberal (34% major factor) — followed by hiring discrimination (29%), self-selection into better-paying careers (26%), and a discouraging academic culture (23%). None of the four moved significantly between February and August.
Fixing the imbalance is seen as the universities’ job, not government’s
“Whose responsibility is it to address political imbalance among faculty?” Asked in both waves; wording carried over from the February questionnaire.
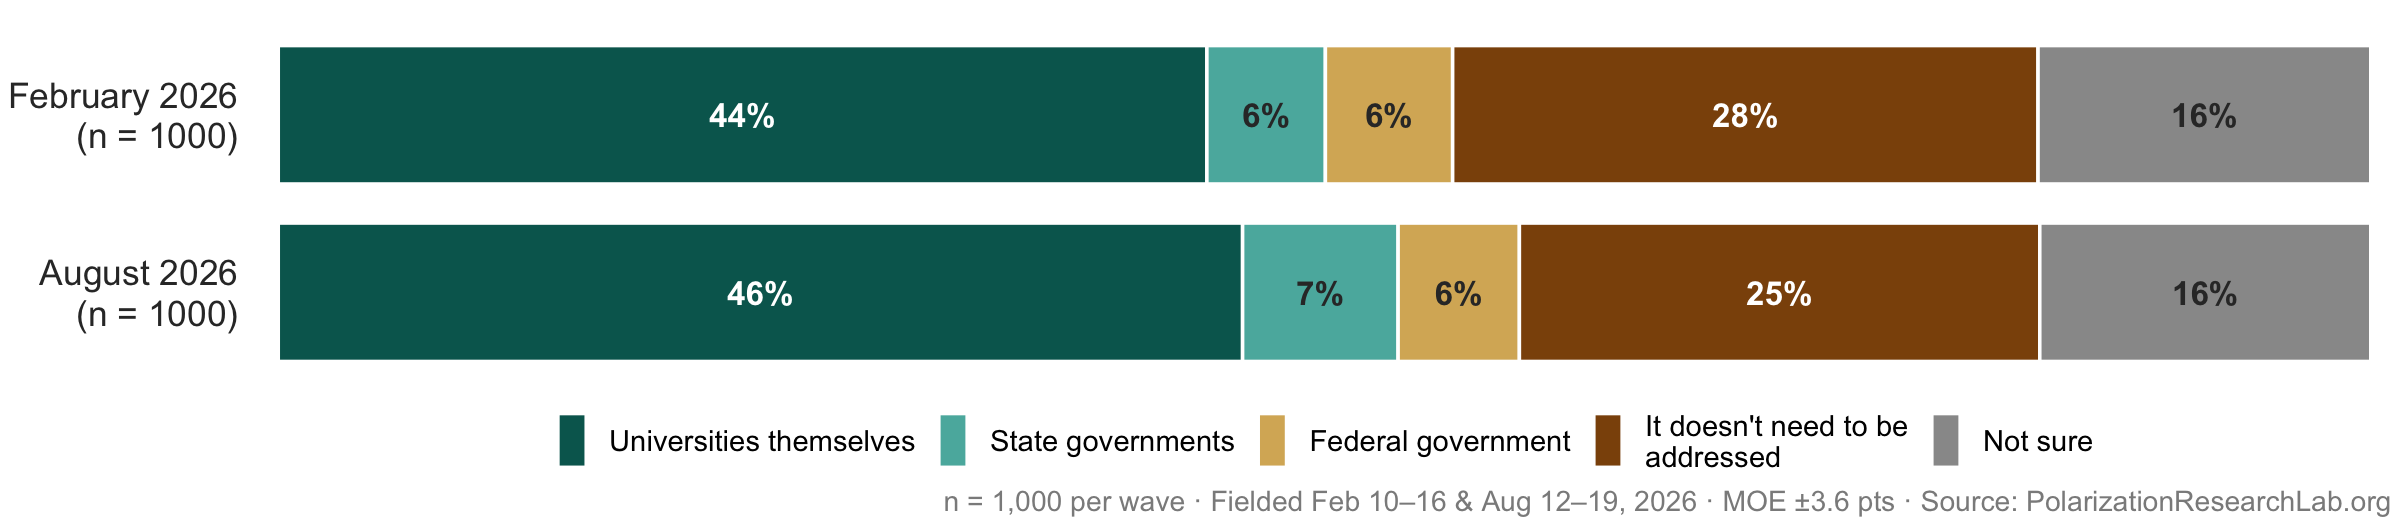
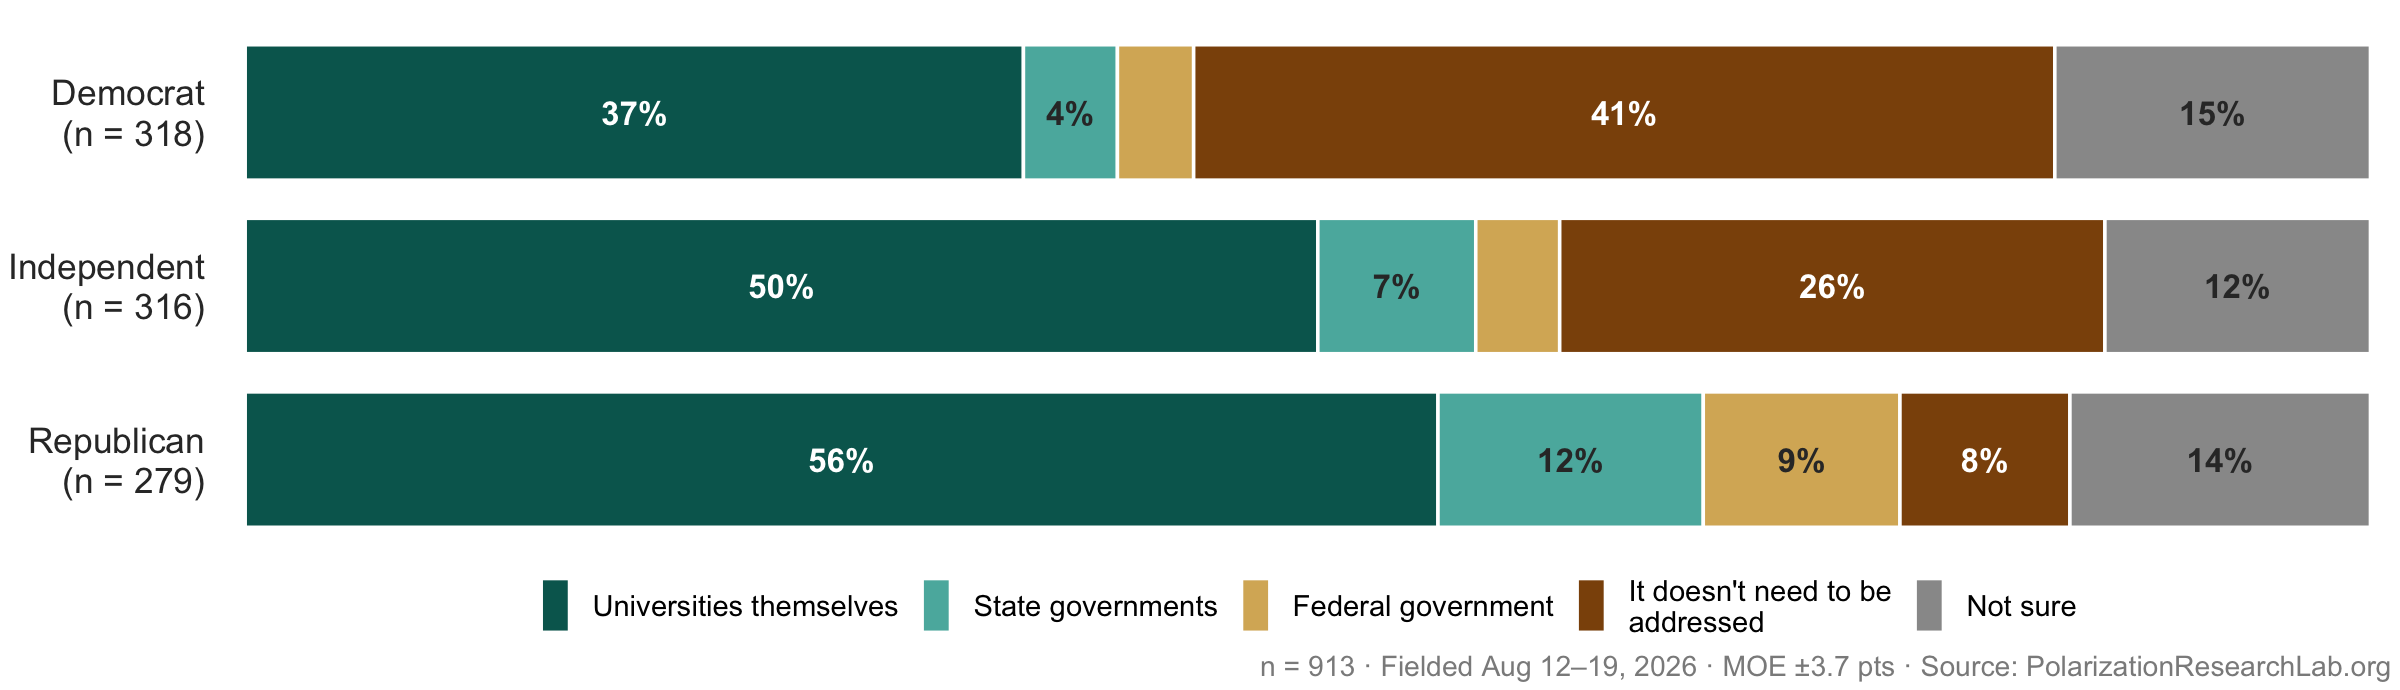
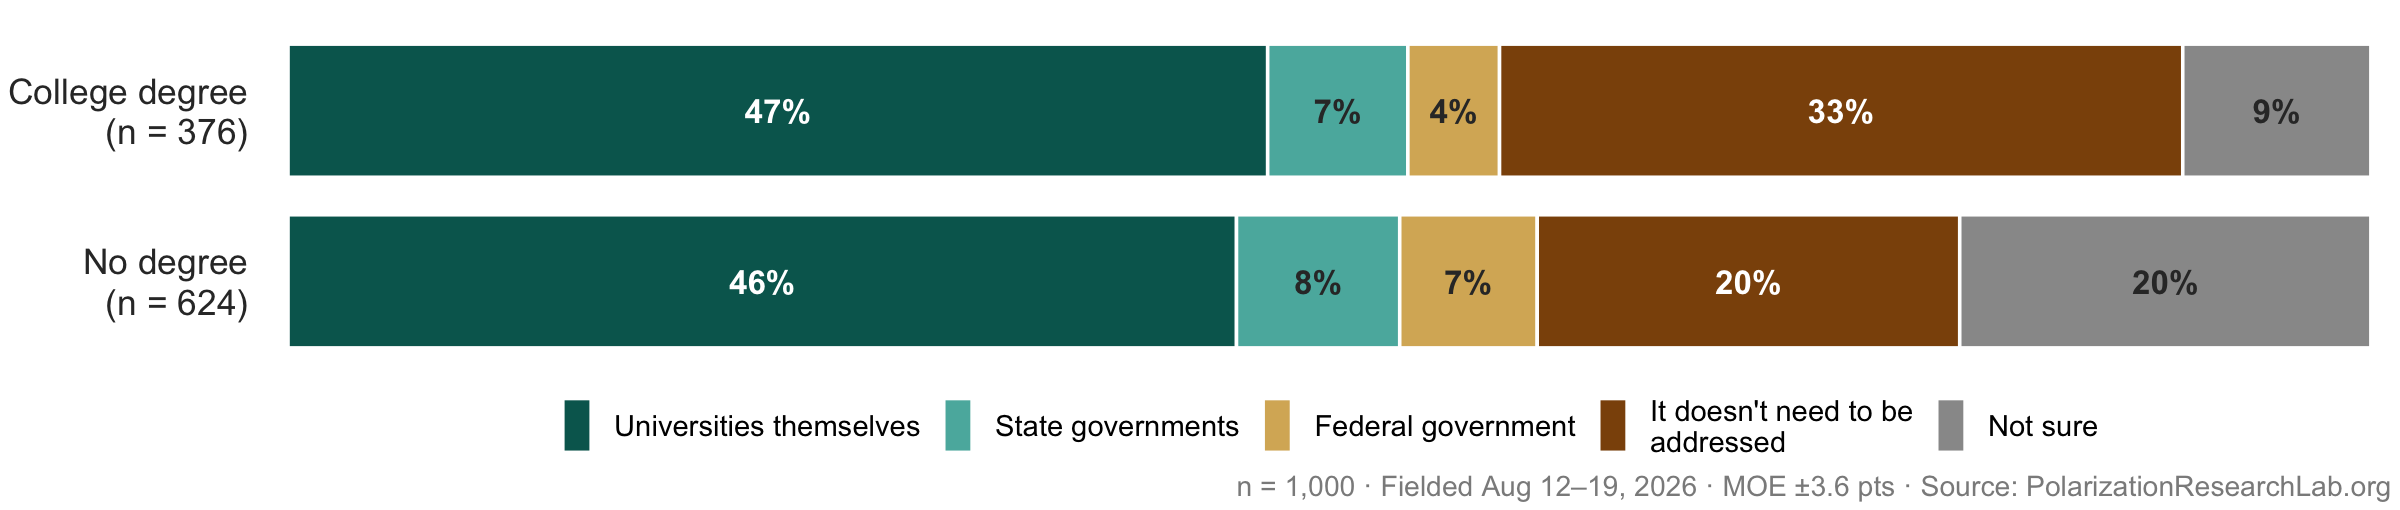
Whatever they think of the problem, respondents do not want government to solve it. A 46% plurality assigns responsibility to universities themselves and 25% say it doesn’t need to be addressed; the federal government (6%) and state governments (7%) barely register.
Viewpoint-conscious hiring is unpopular but gaining ground
“Should universities consider political viewpoints when hiring faculty, to ensure a range of perspectives are represented?”
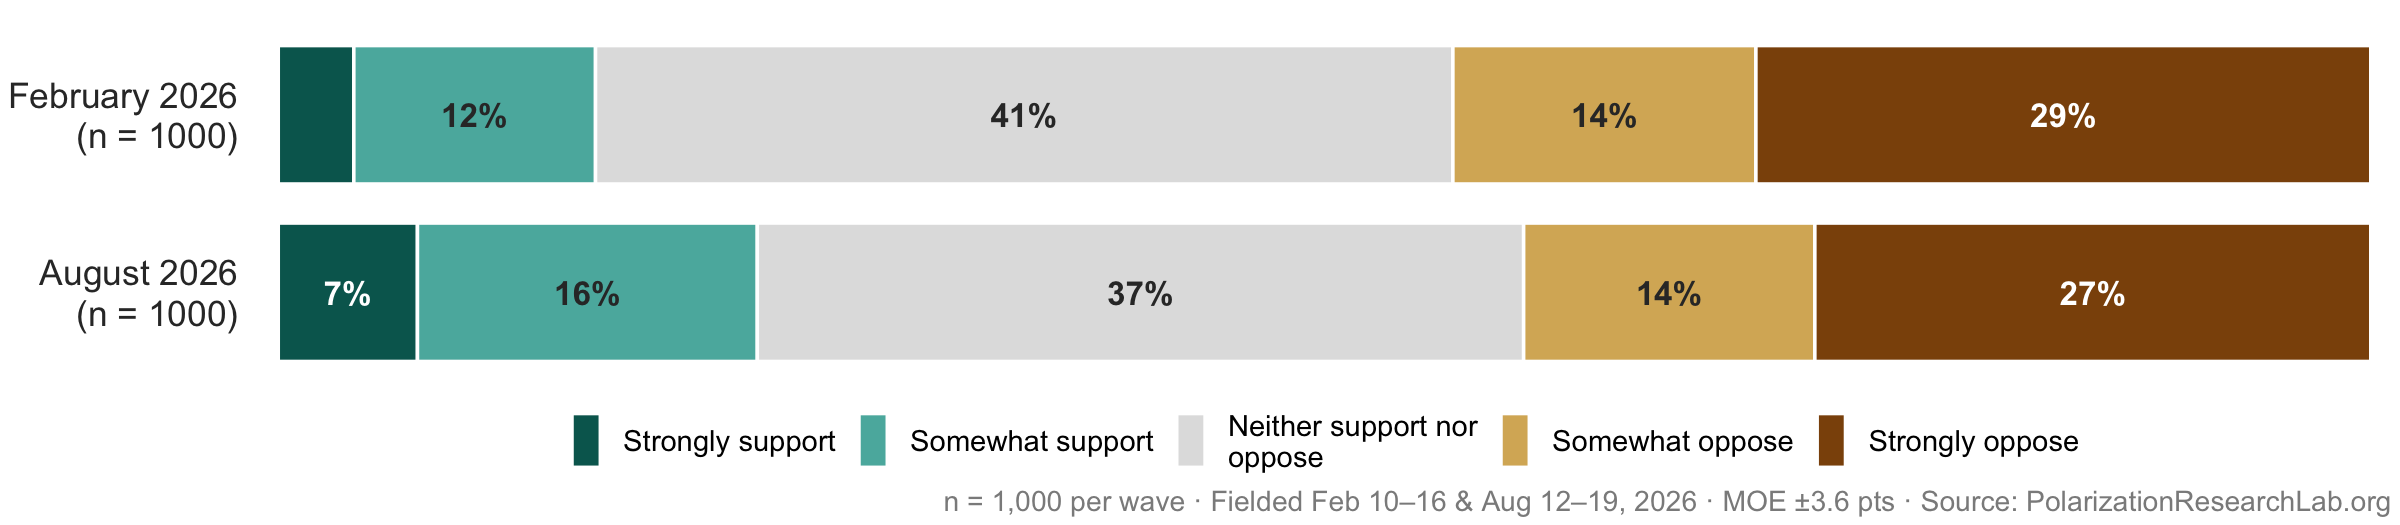
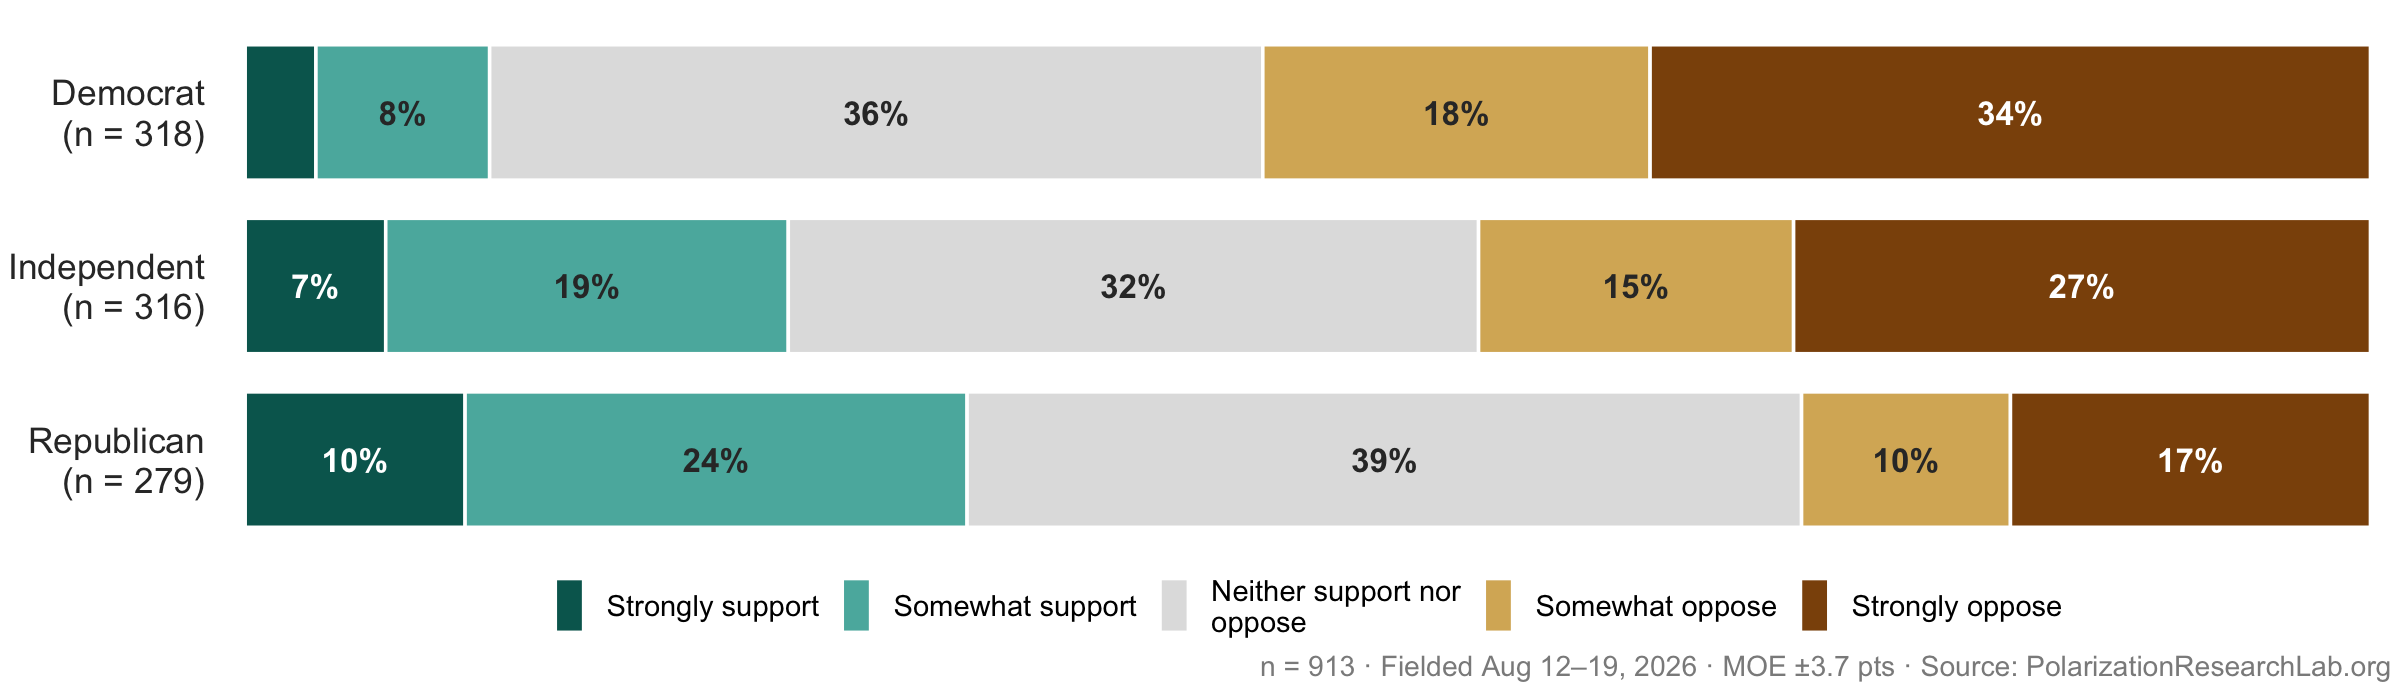
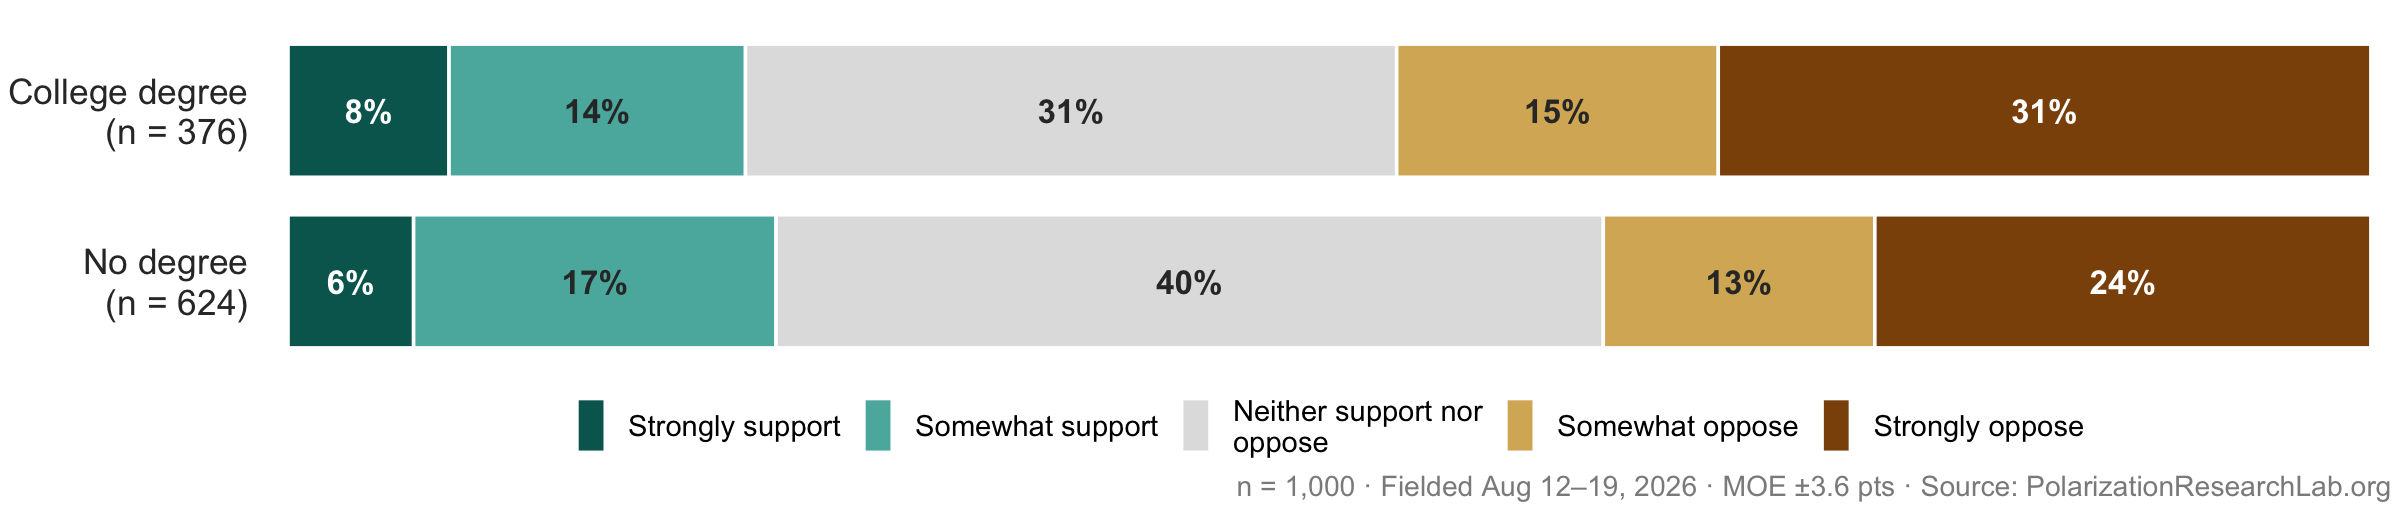
Viewpoint-conscious hiring remains unpopular — 41% oppose it against 23% in support — but support rose 8 points since February, the largest shift in the survey. The modal answer in both waves is “neither support nor oppose.”
Each party backs hiring preferences only for its own side
“Suppose two equally qualified candidates apply for a professor job in a department where almost no faculty are [conservative / people of color]. Would you support or oppose the university choosing the [conservative candidate specifically because of their political views / candidate of color specifically because of their race]?” Respondents were randomly assigned to see one version of the bracketed text.
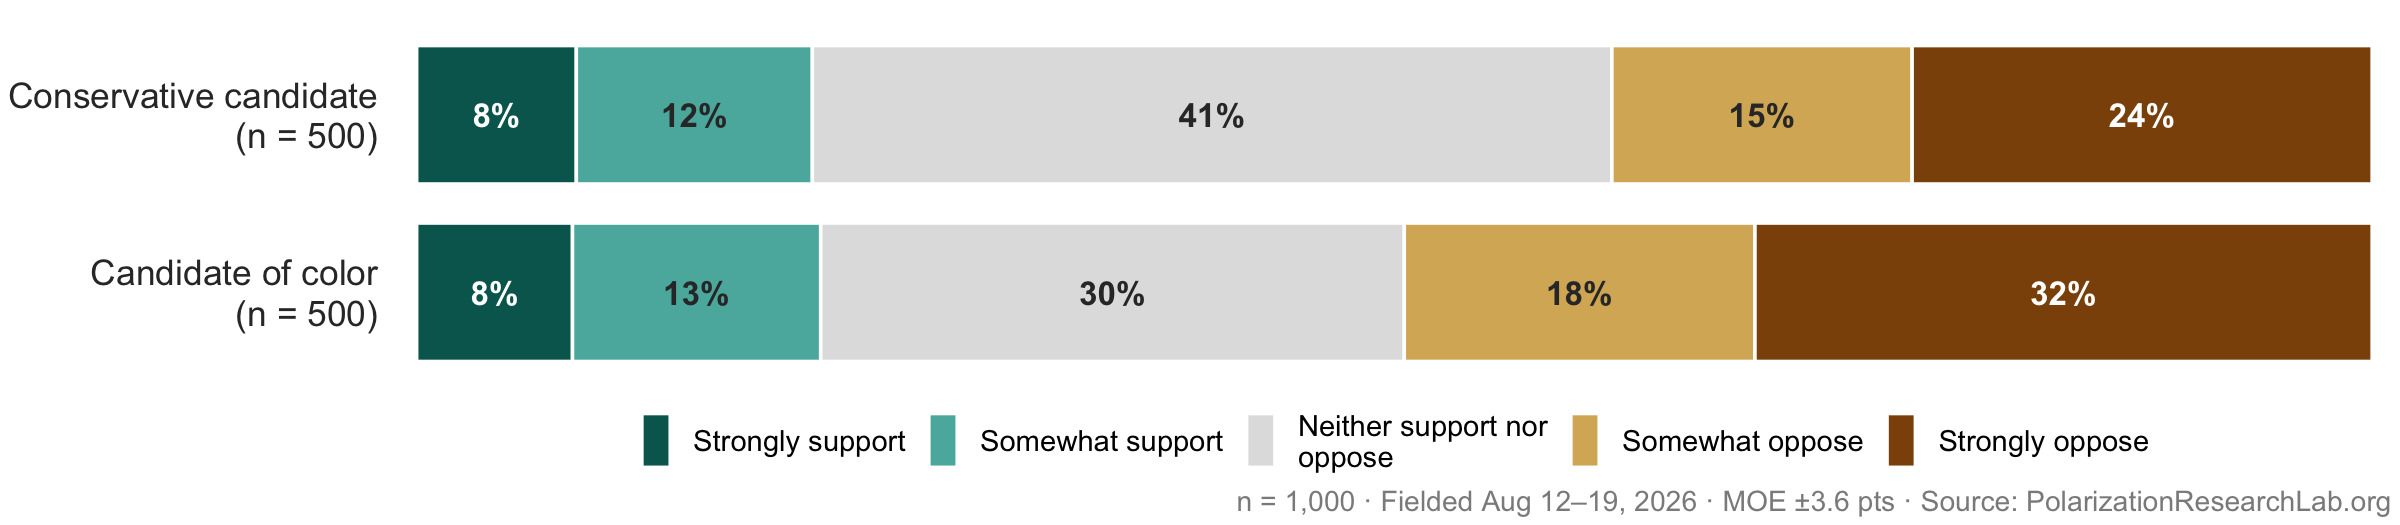
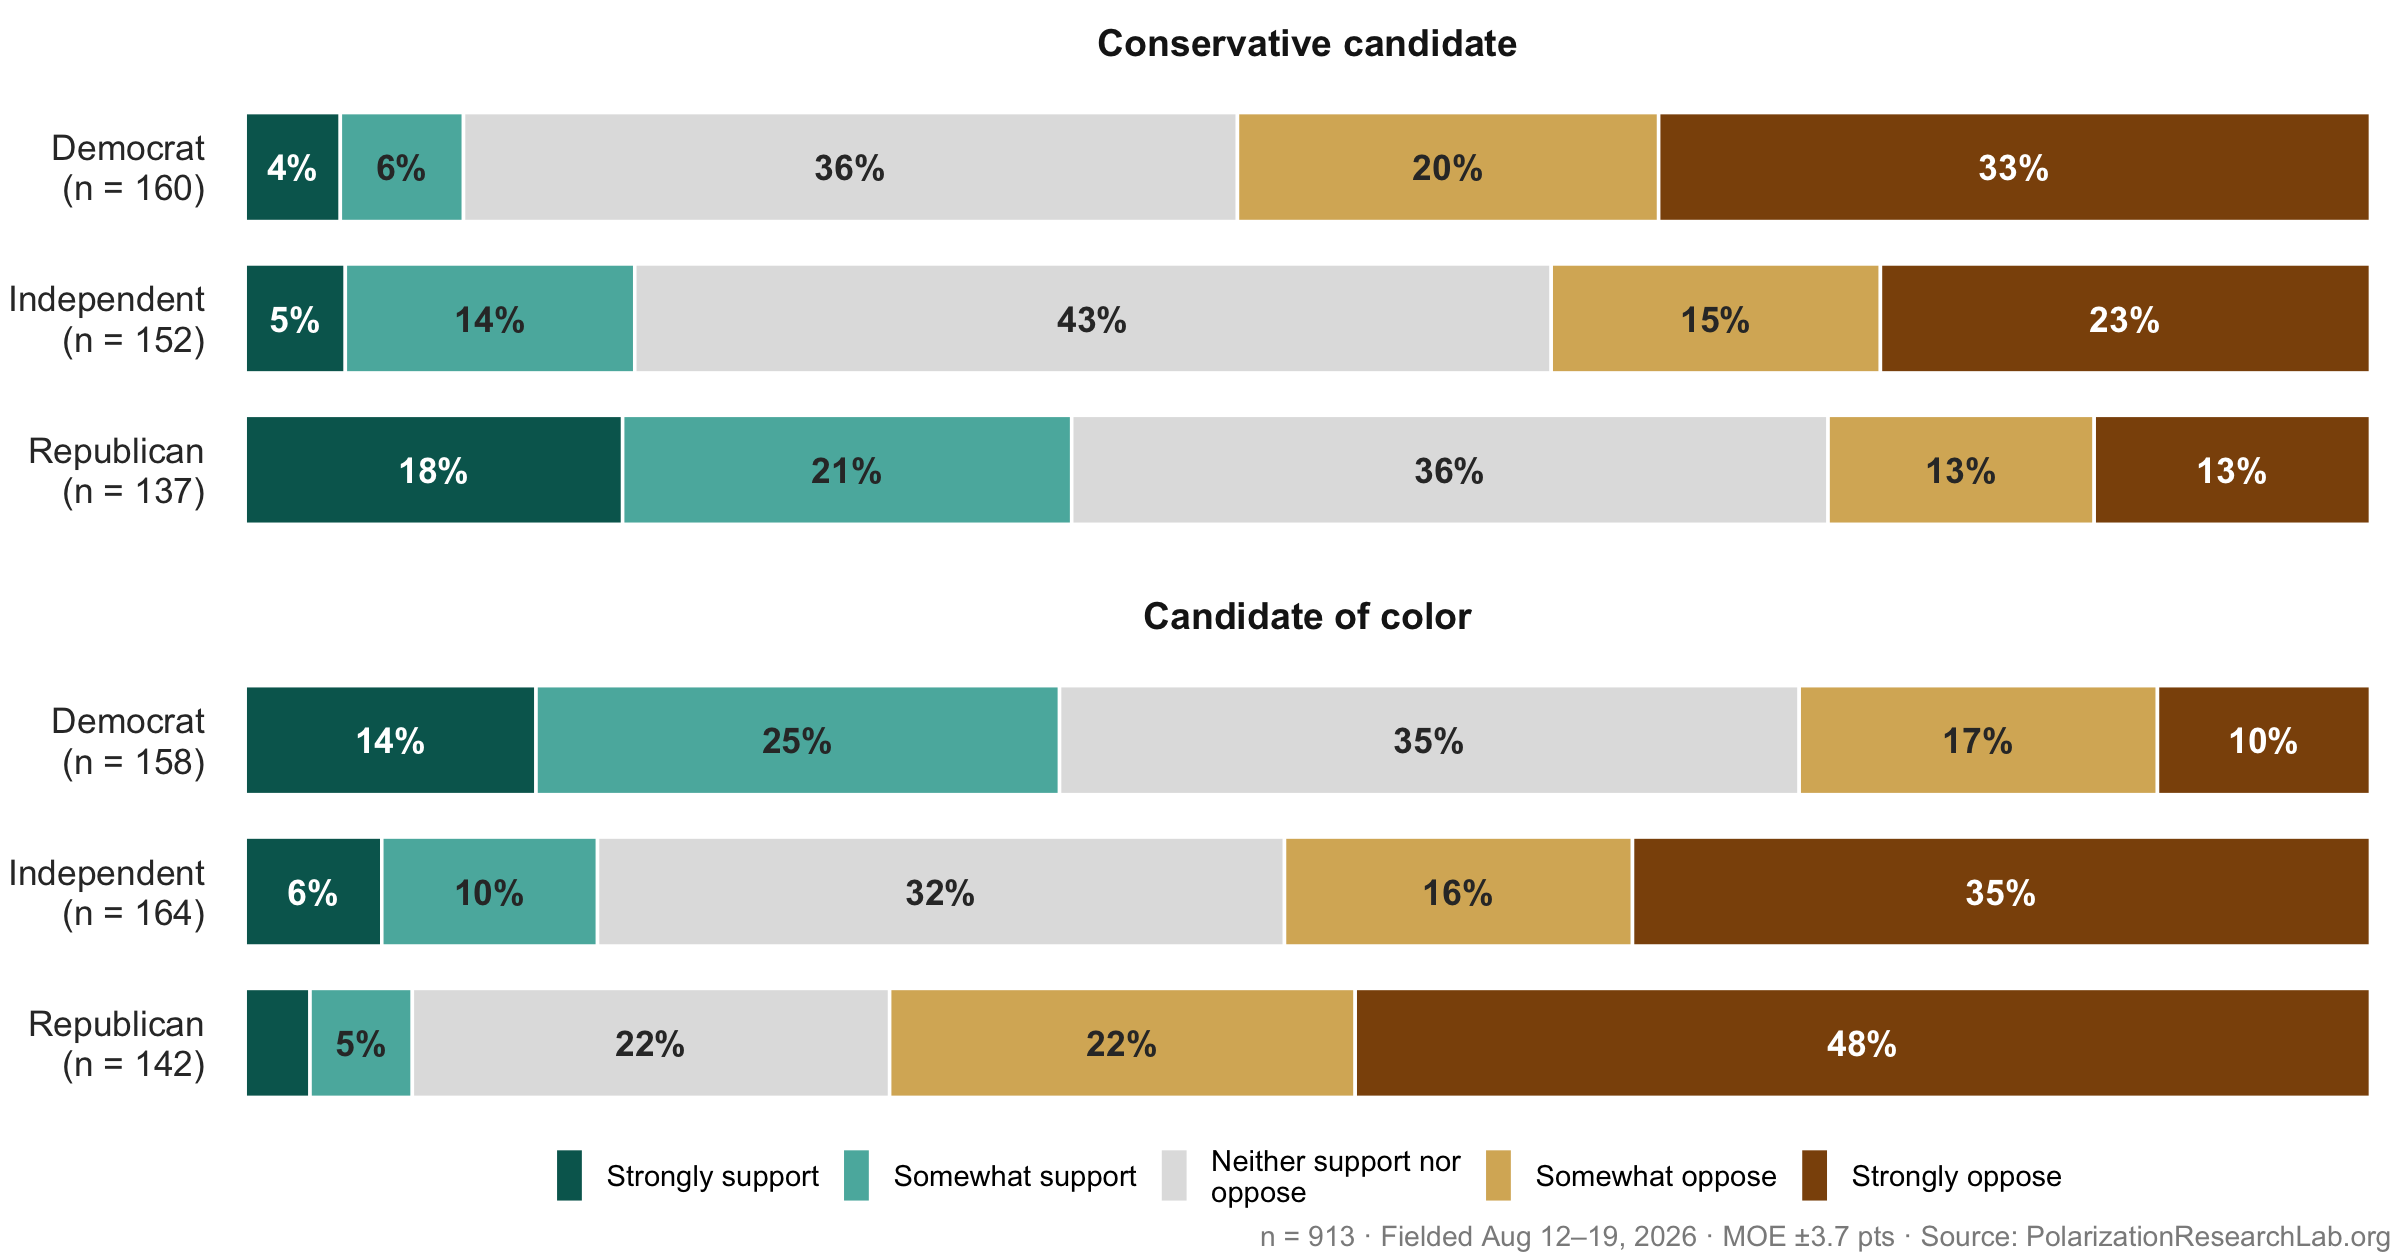
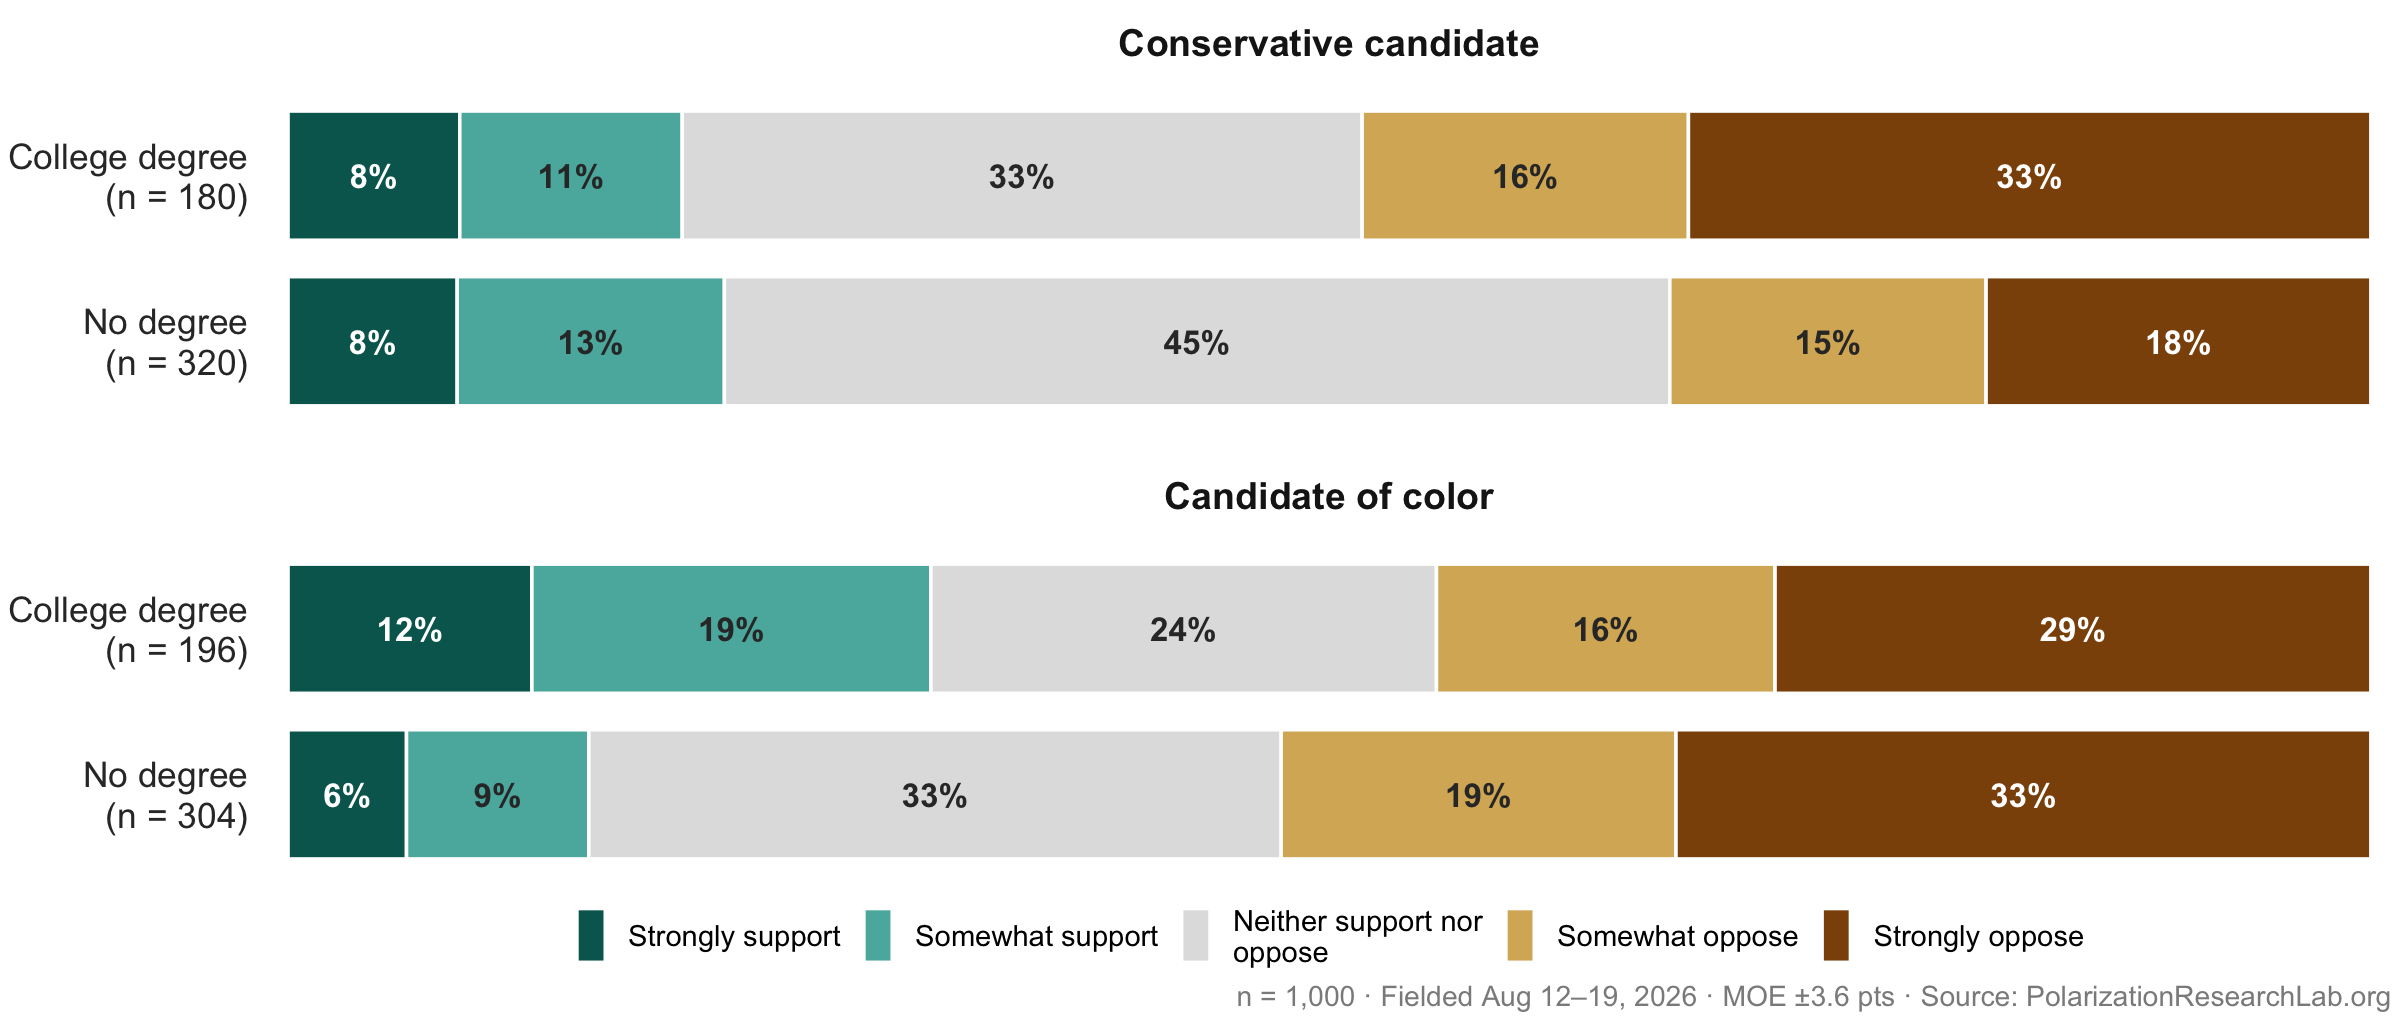
Overall support is identical across versions — about 20% back the preference whether the beneficiary is a conservative or a candidate of color — but that equality masks symmetric polarization. Republicans support the conservative preference 39% to 26% while opposing the racial preference 70% to 7%; Democrats support the racial preference 39% to 27% while opposing the conservative preference 53% to 10%. Each party endorses for its own side almost exactly what it rejects for the other. Opposition overall is stronger in the race version (50%) than the ideology version (39%), driven by Republicans’ near-unanimous rejection.
5 Institutional and Political Speech
Institutional neutrality is the public’s clear preference
“When a national or global controversy arises, do you think colleges and universities should issue official institutional statements taking a position, or should they generally remain neutral?”
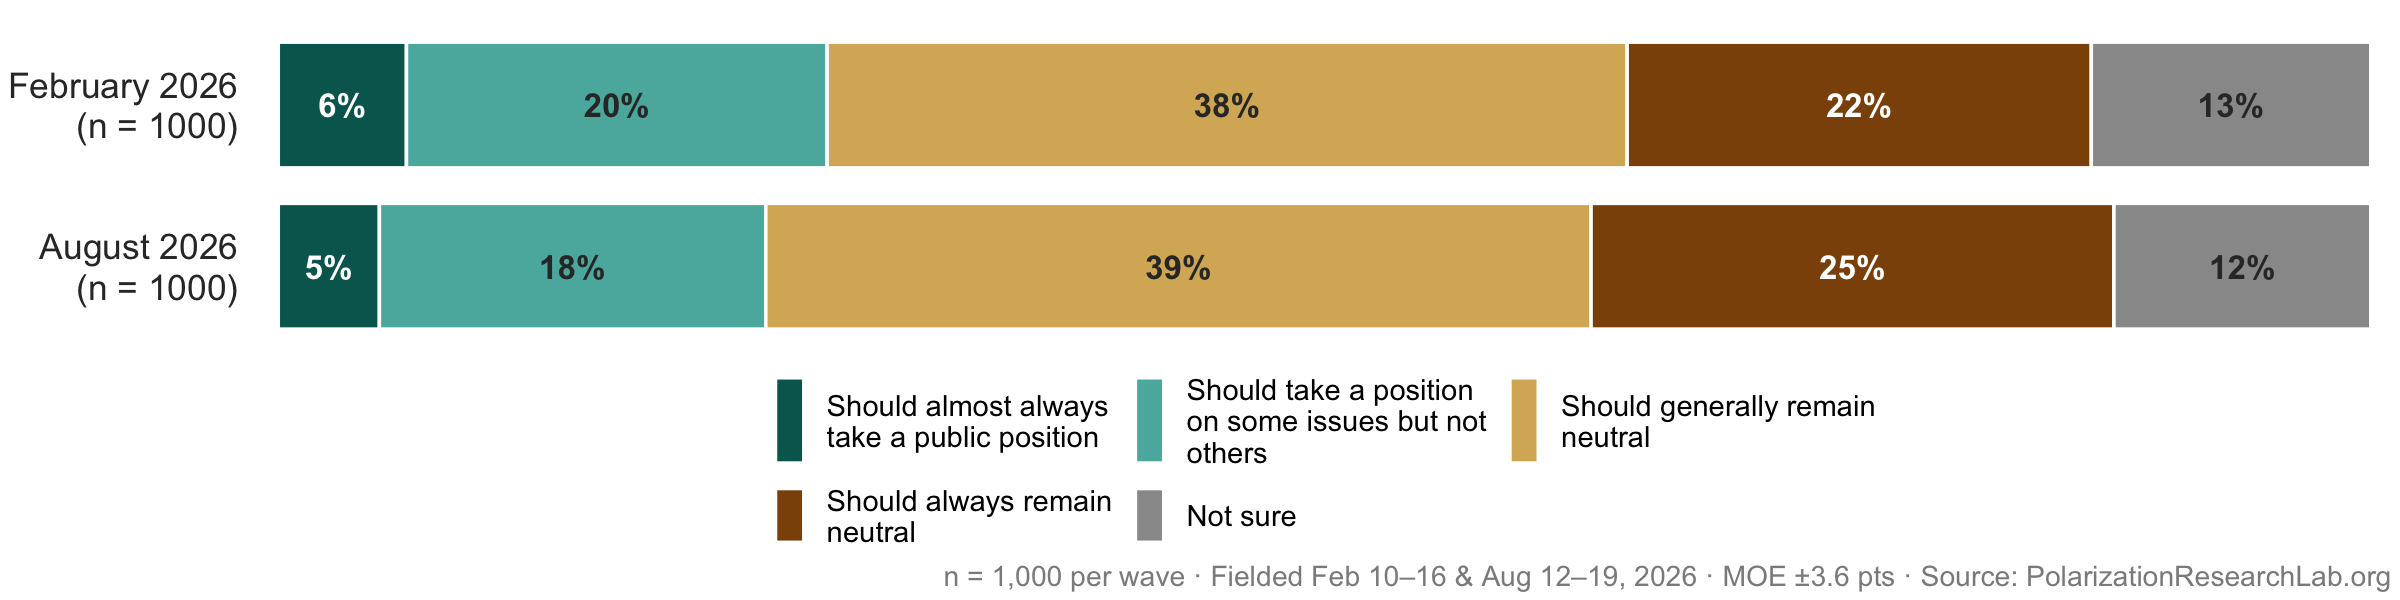
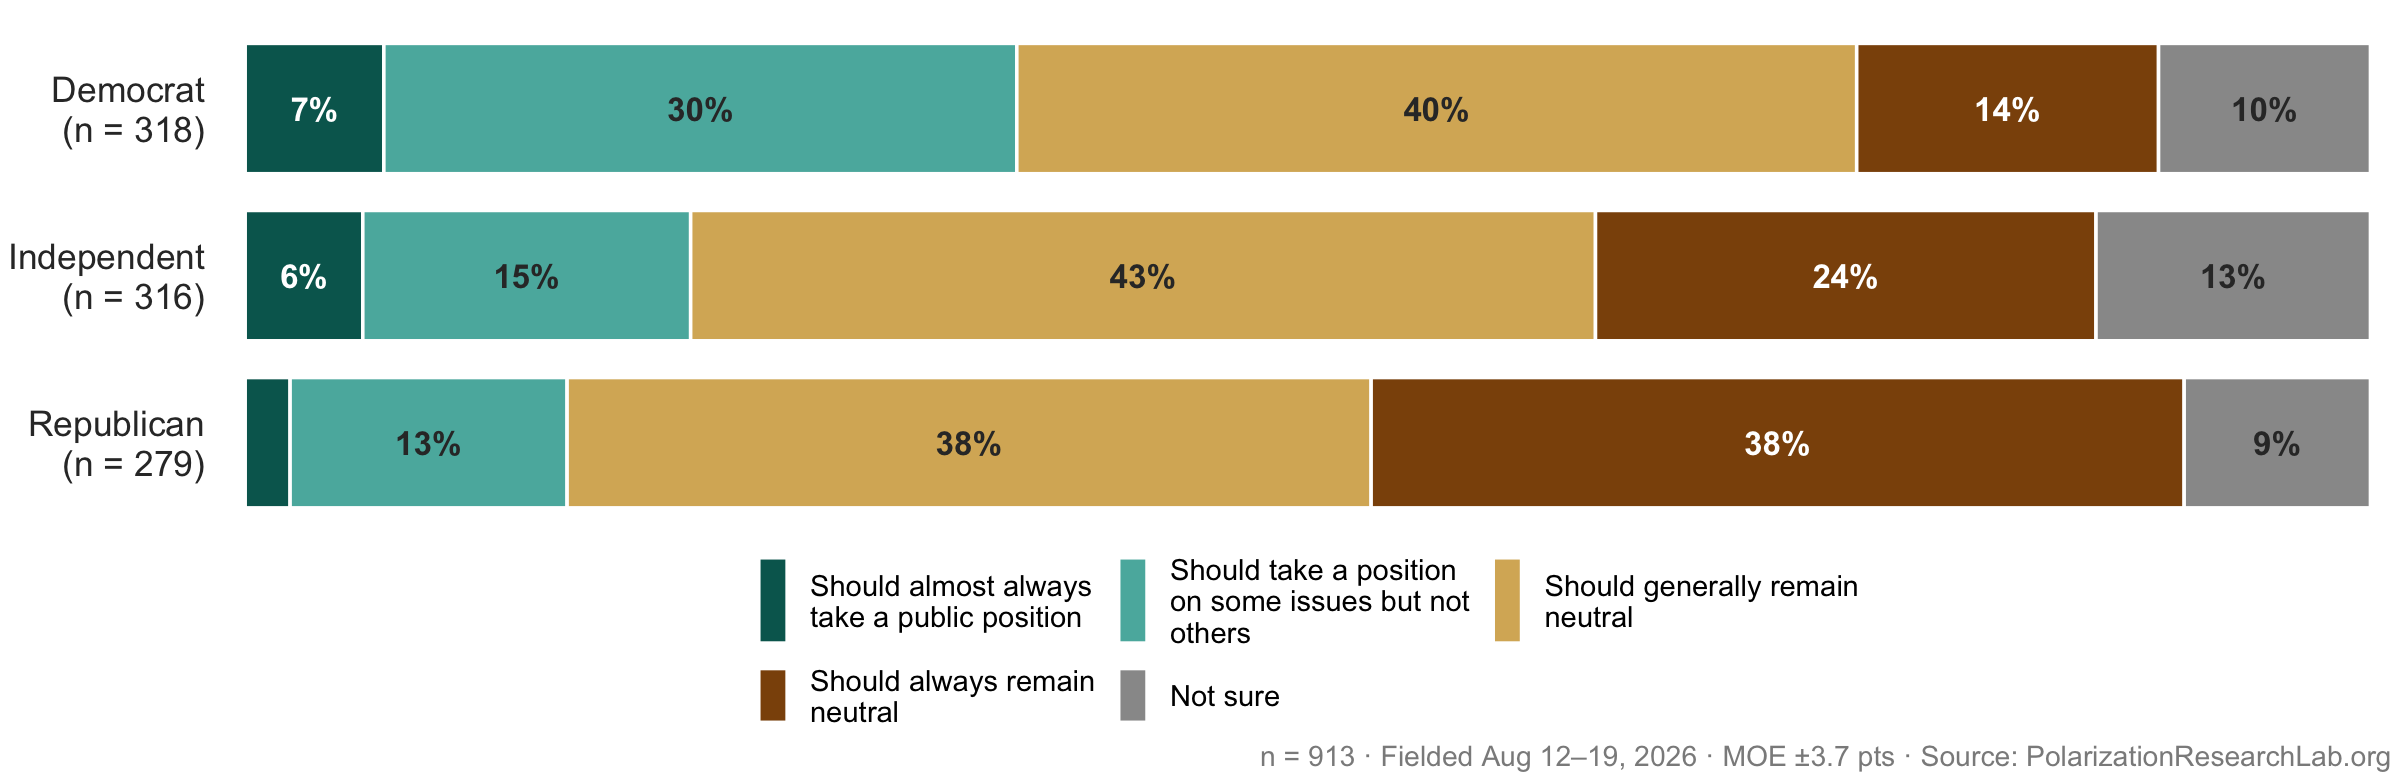
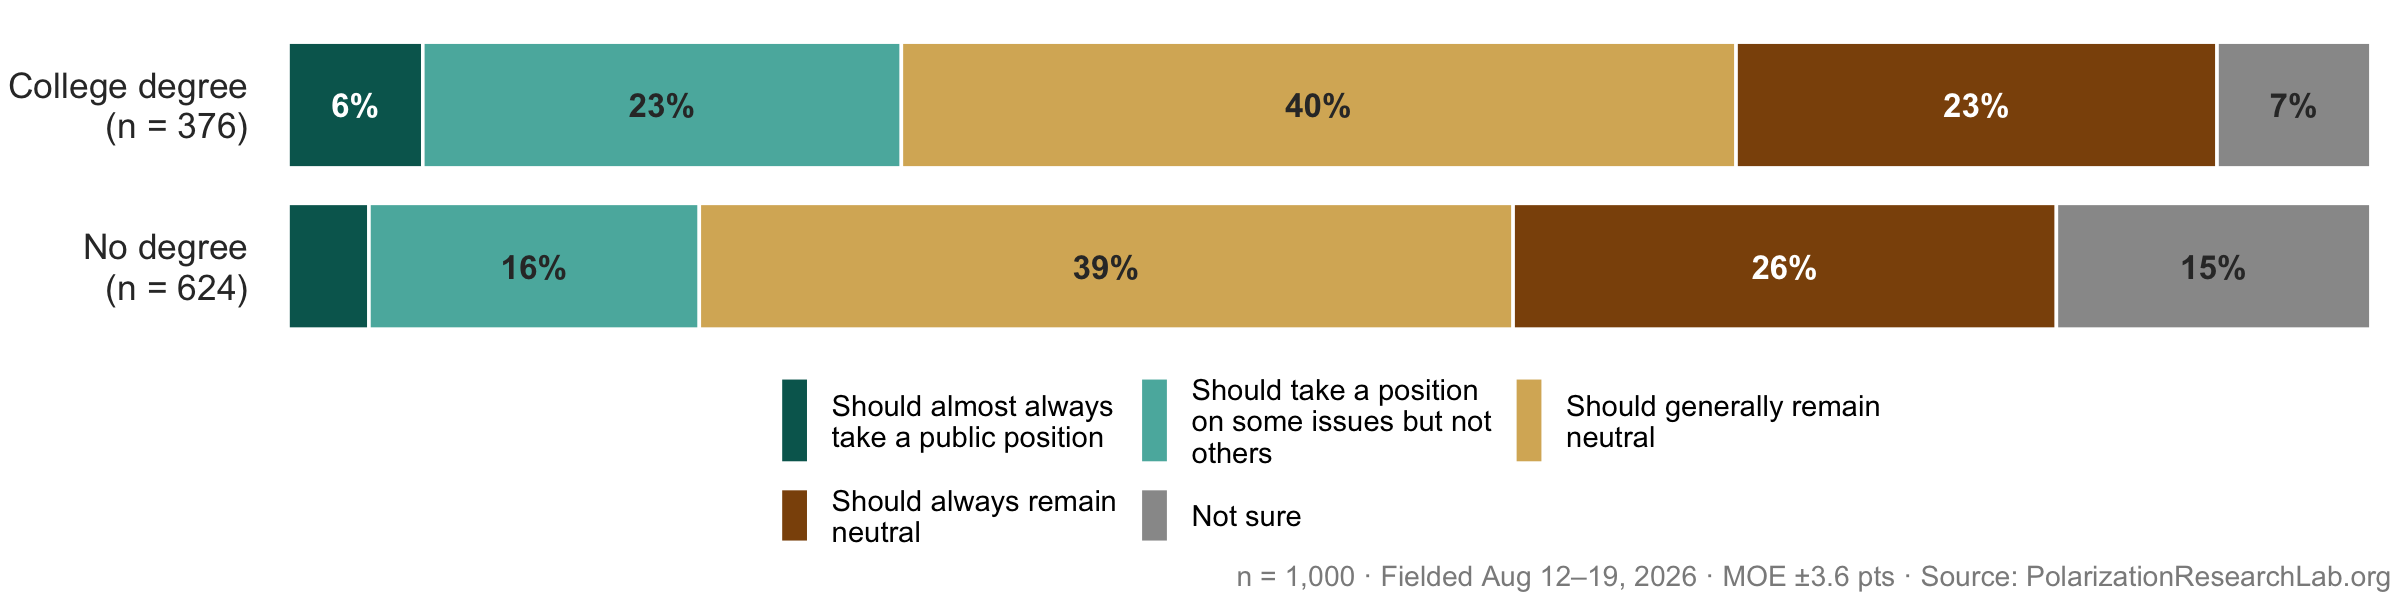
Institutional neutrality is the public’s clear preference: 64% say universities should generally or always remain neutral, while only 5% want them to almost always take a position. This is one of the few campus-politics questions where the parties lean the same direction.
The AAUP endorsement lands badly
“The American Association of University Professors, a national organization representing university professors recently endorsed a Democratic candidate for the U.S. Senate, the first political endorsement in the organization’s 111-year history. Do you approve or disapprove of the AAUP endorsing political candidates?”

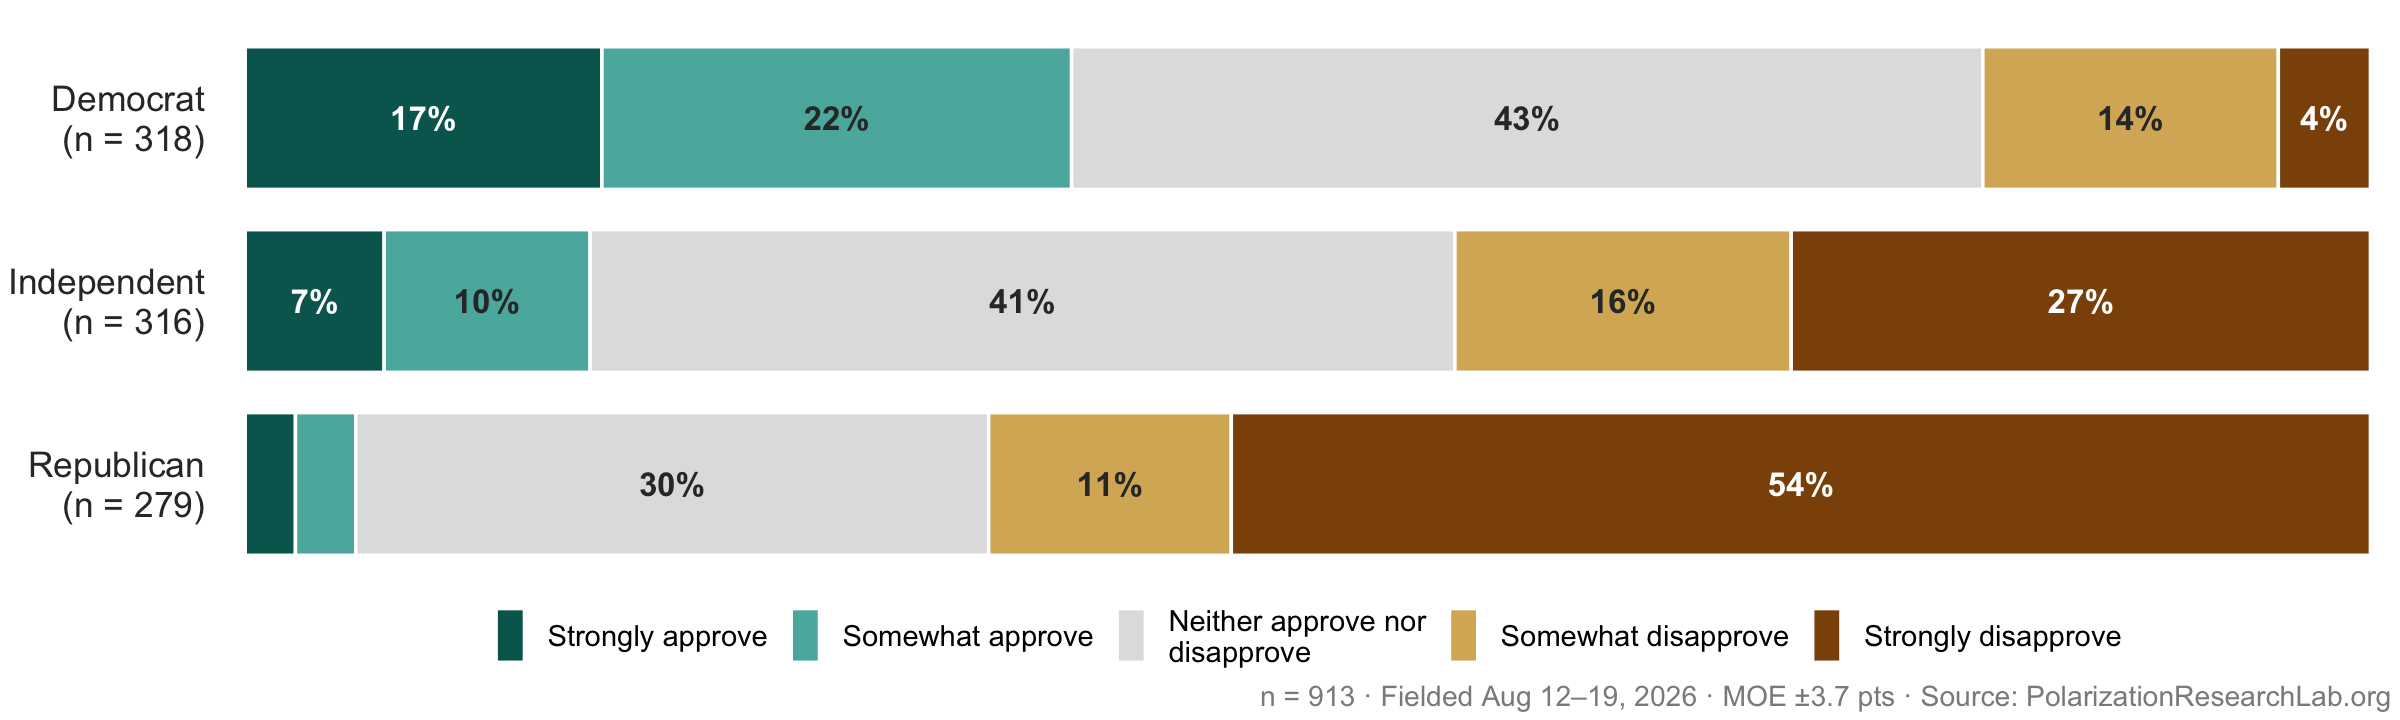
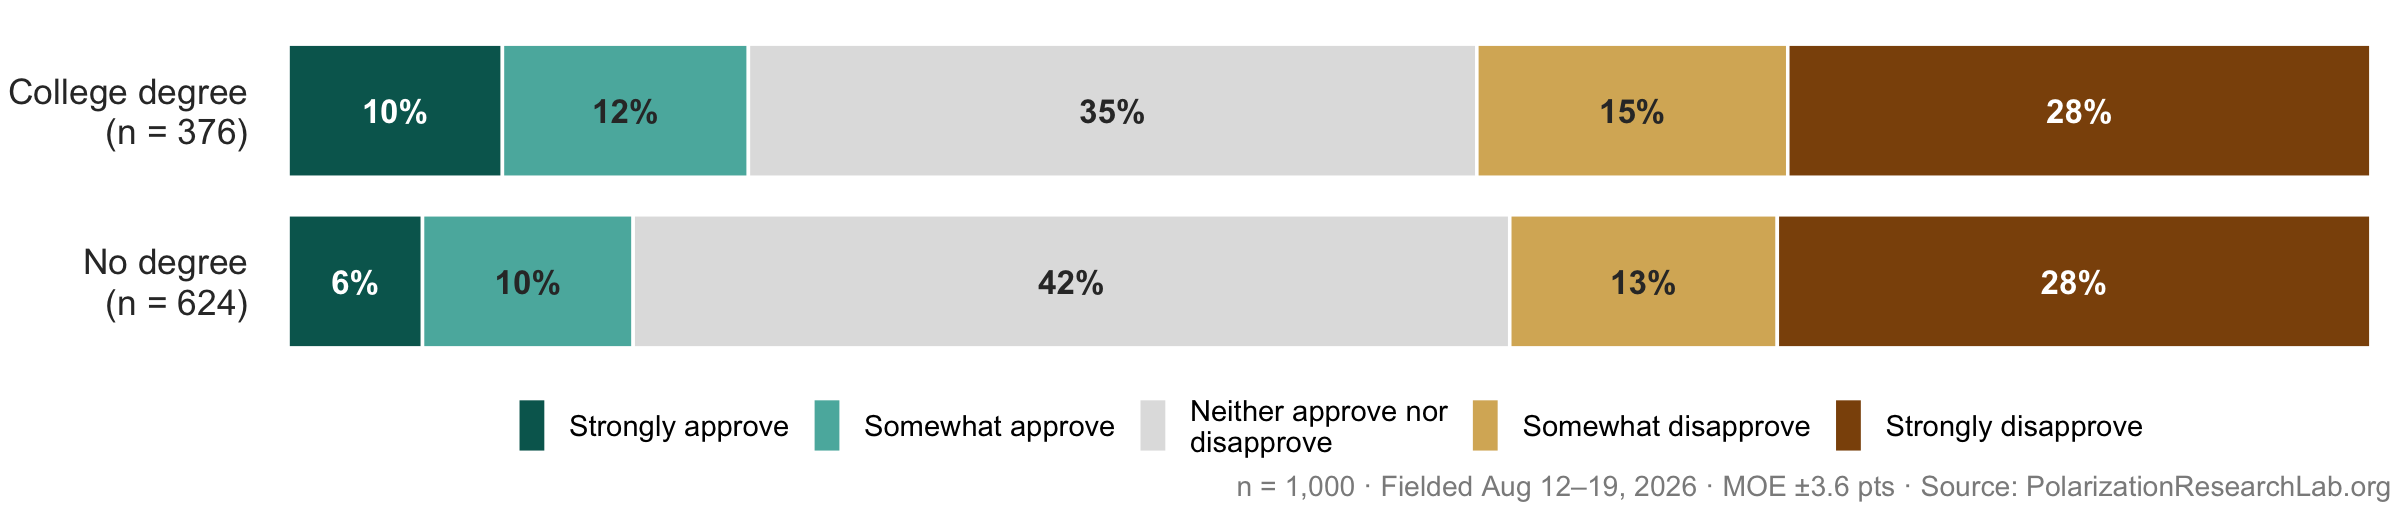
The endorsement lands badly: 42% disapprove against 19% who approve, with 40% neutral. Consistent with the neutrality result above, the public’s disapproval extends from universities as institutions to the professional organizations that represent their faculty.
6 Respondent Background
College graduation and major
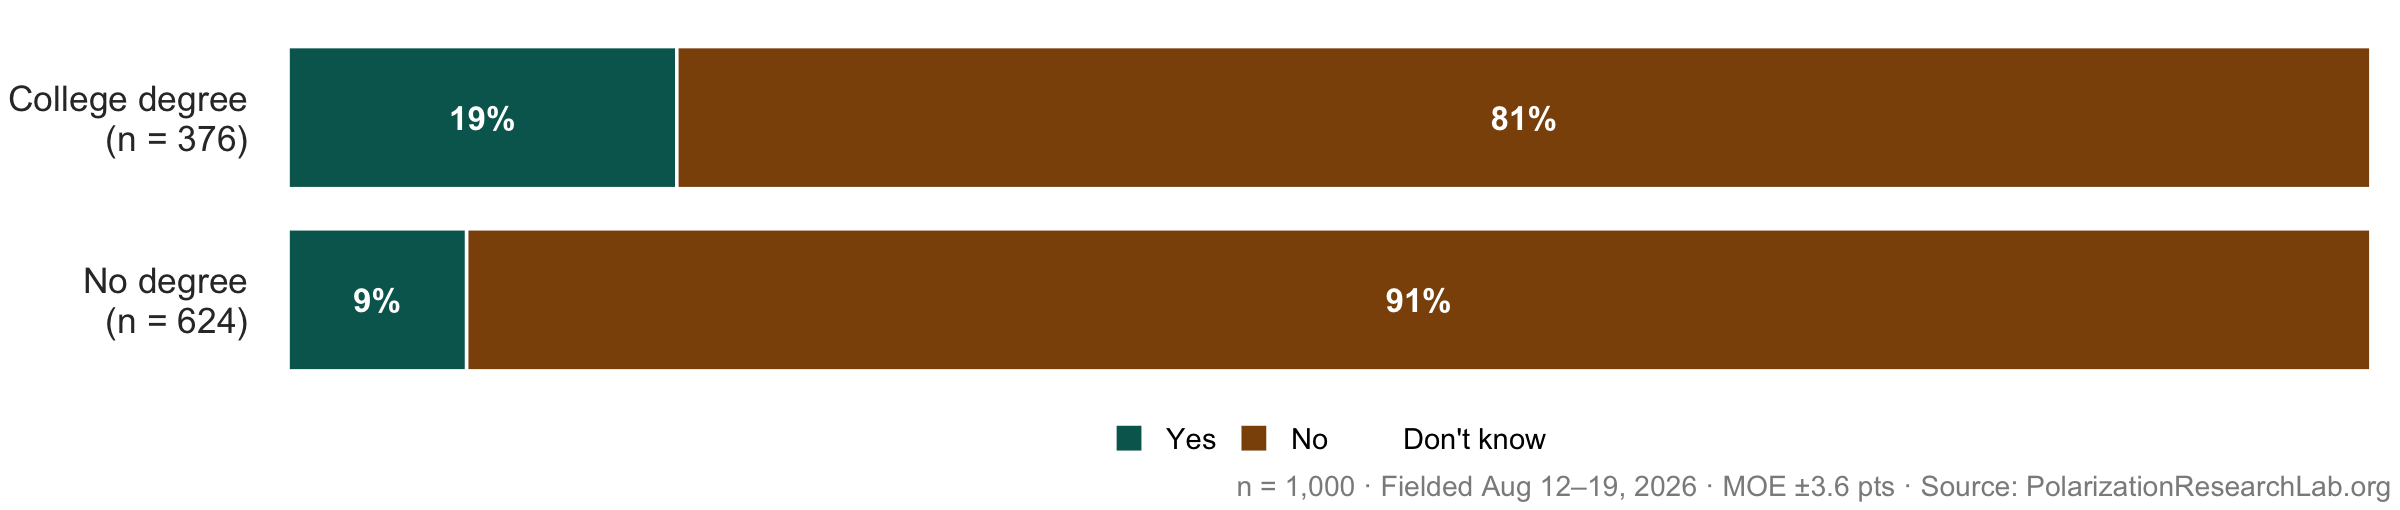
“Have you completed a four-year college degree?”
“What was your primary field of study (major)?” Asked if college_grad = Yes.

College regret
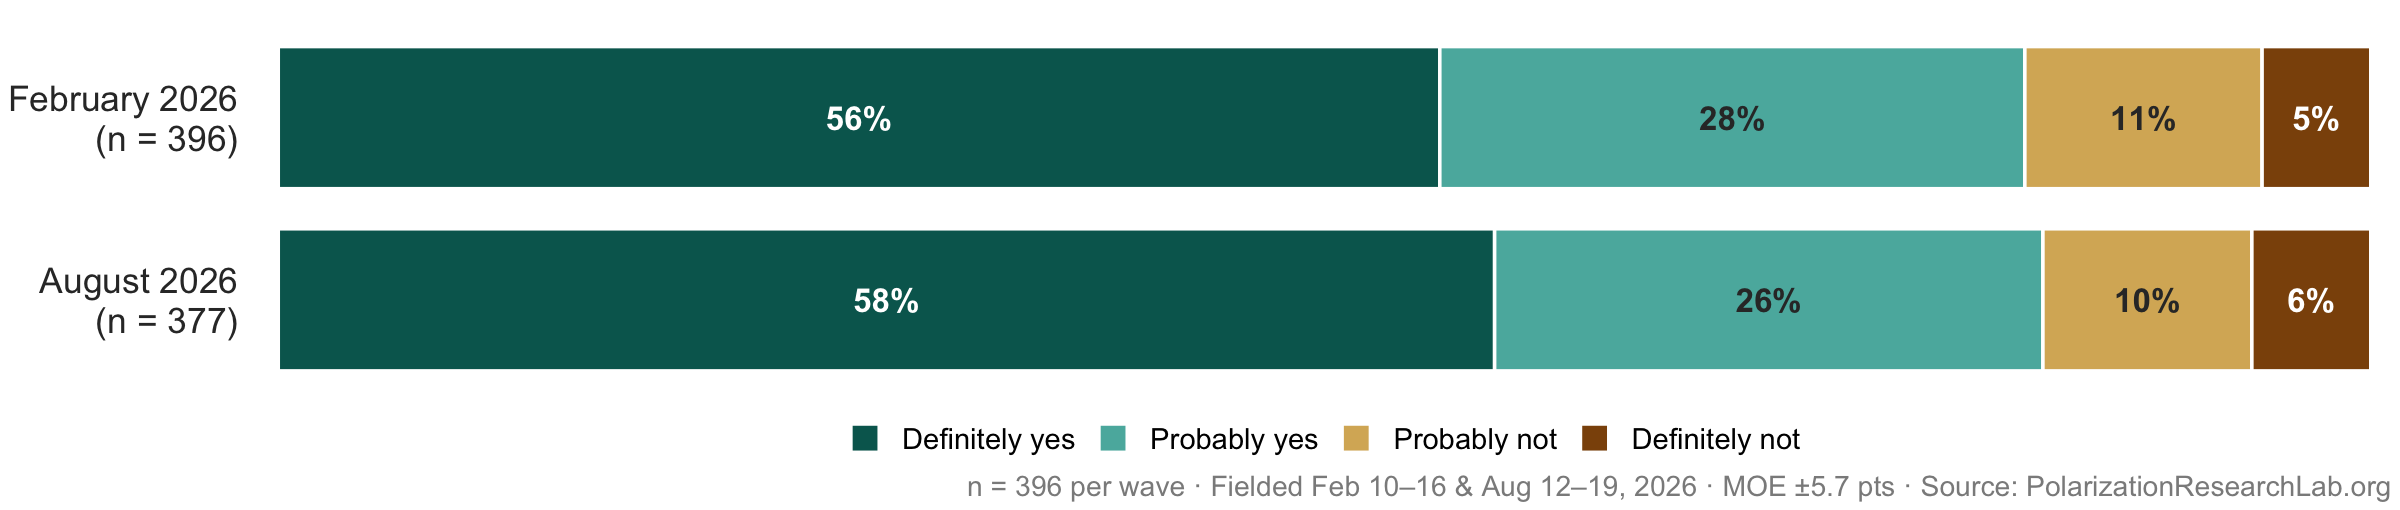
“If you could go back, would you still choose to get your college degree?” Asked if college_grad = Yes.
“Do you regret not getting a four-year college degree?” Asked if college_grad = No.
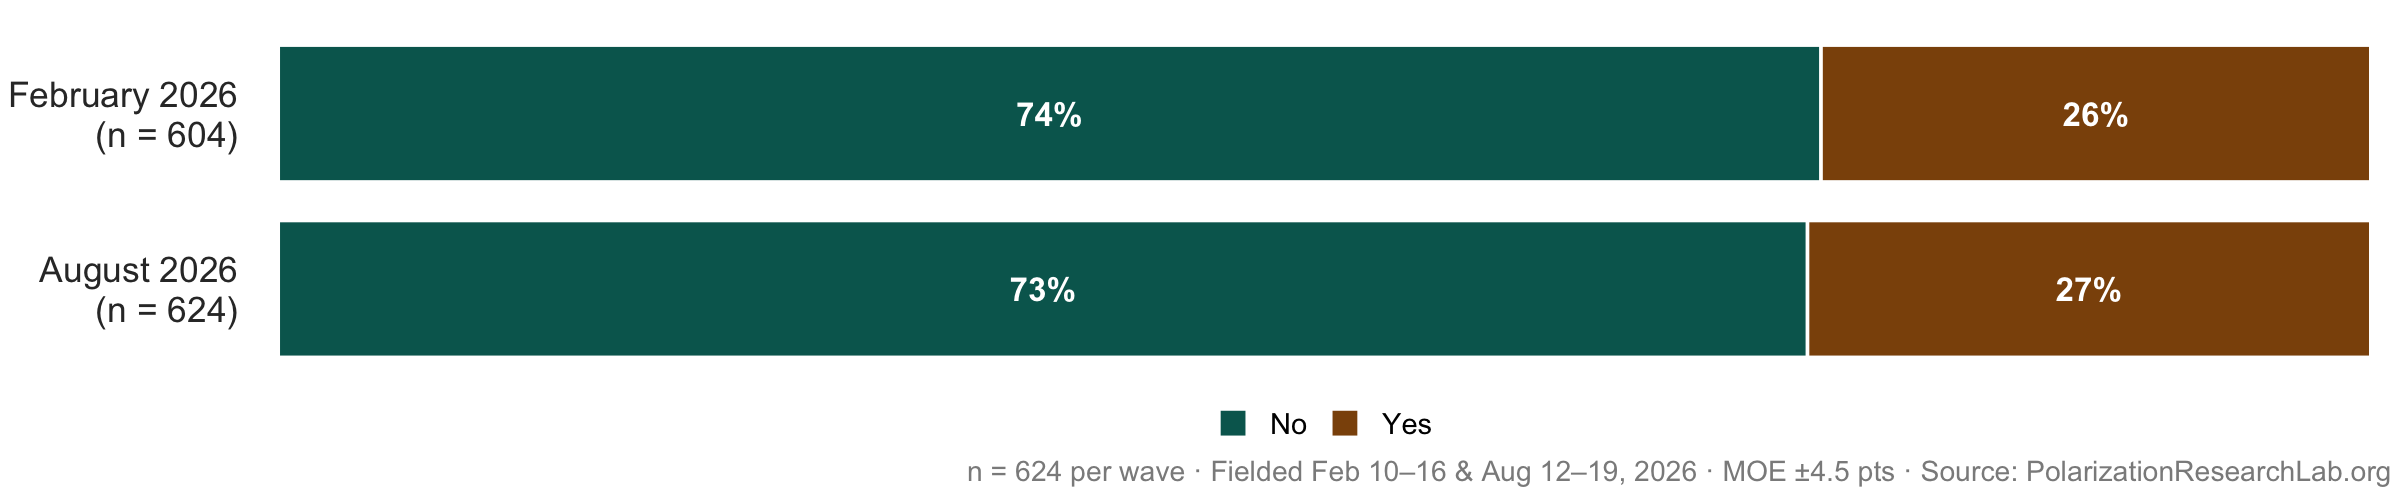
Personal experience is far warmer than the public verdict on the sector: 84% of graduates would get their degree again, and 73% of non-graduates don’t regret skipping it. Most people are content with their own path even while doubting the value of the degree “for most people.”
Student loans and children in college
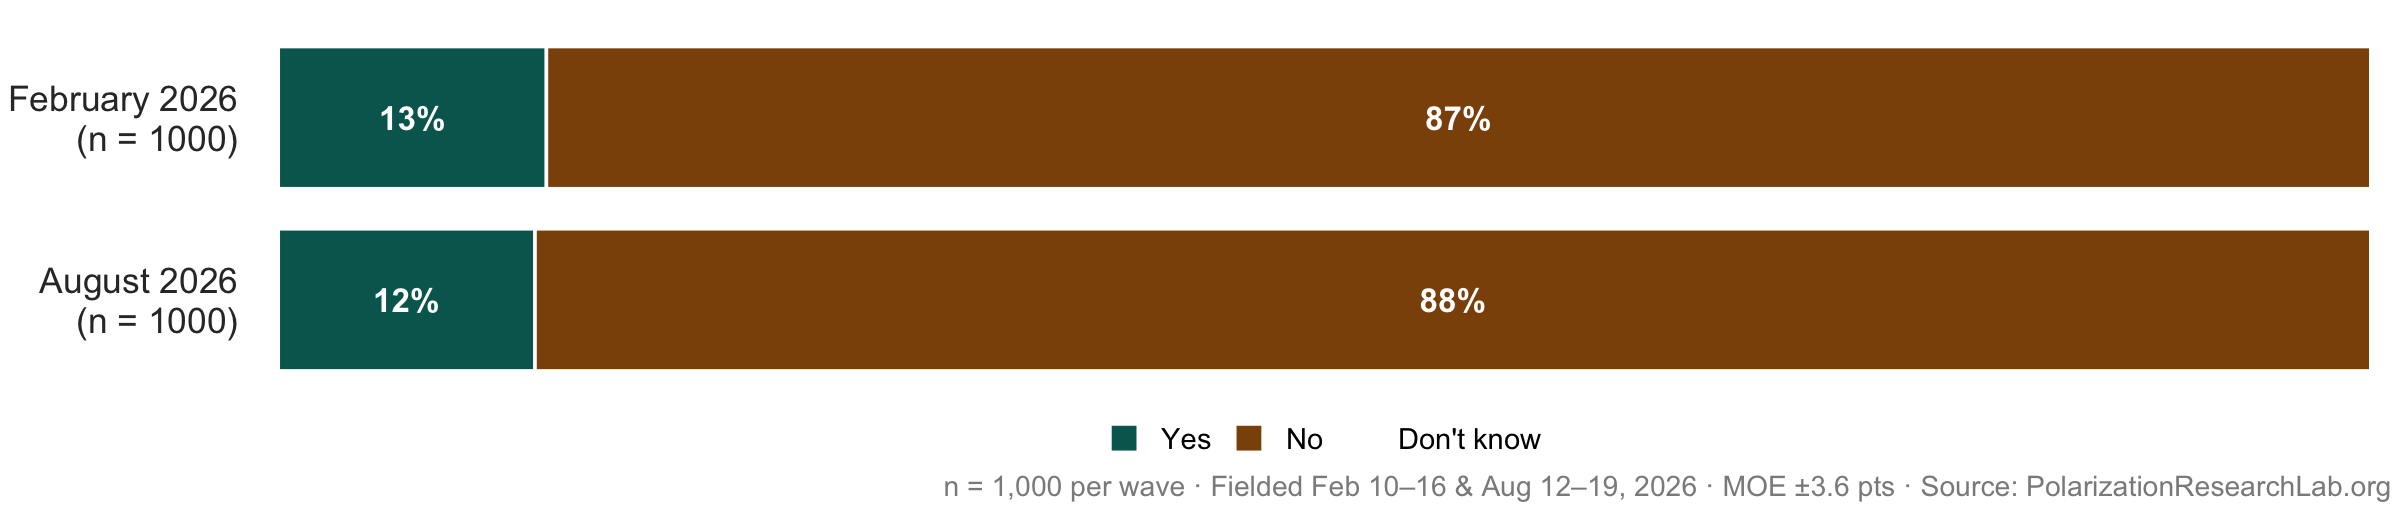
“Do you currently have outstanding student loan debt?”
“Do you have a child currently enrolled in or planning to attend college?”
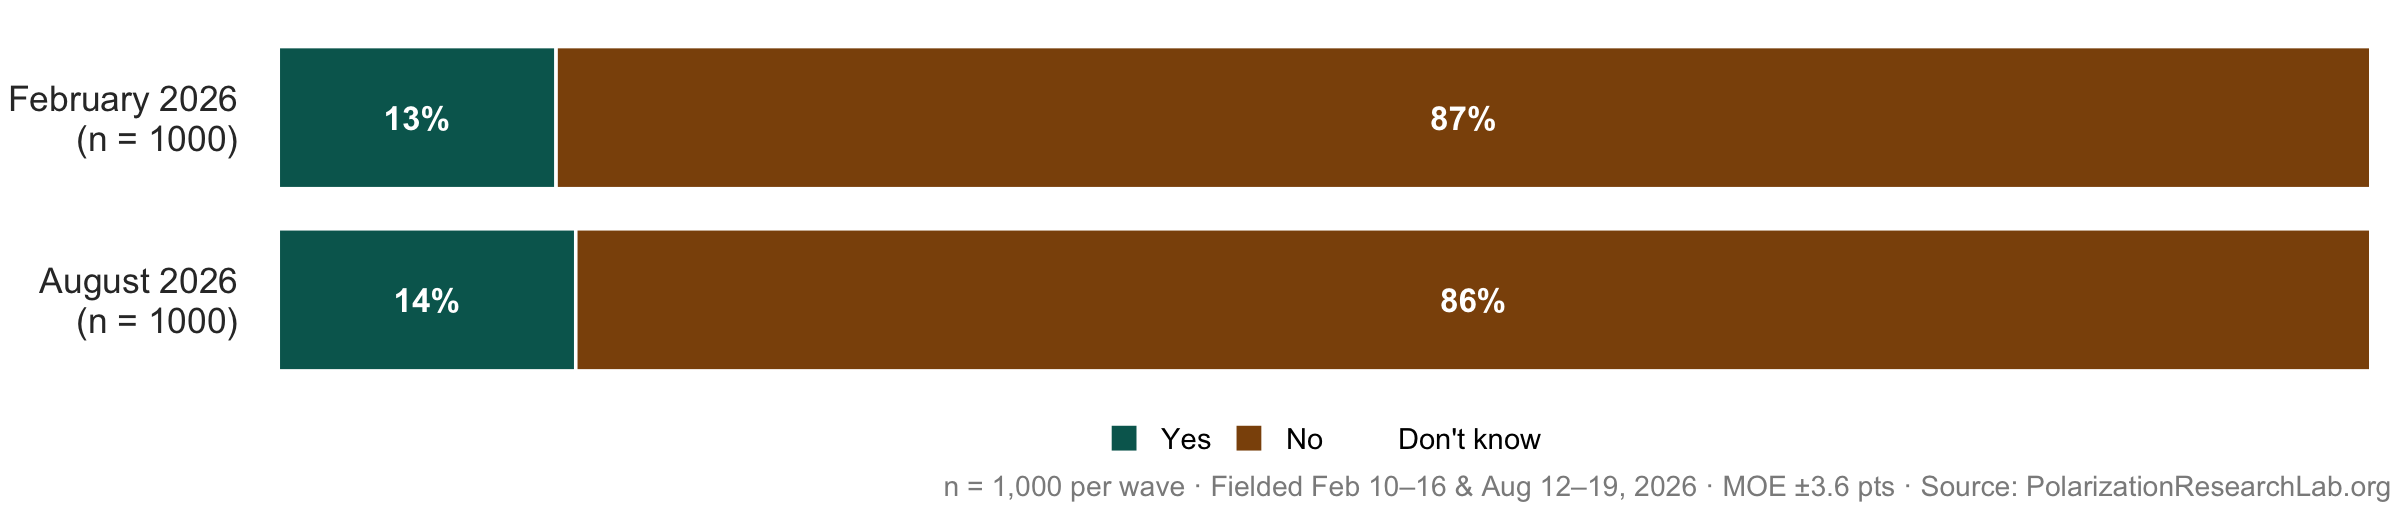
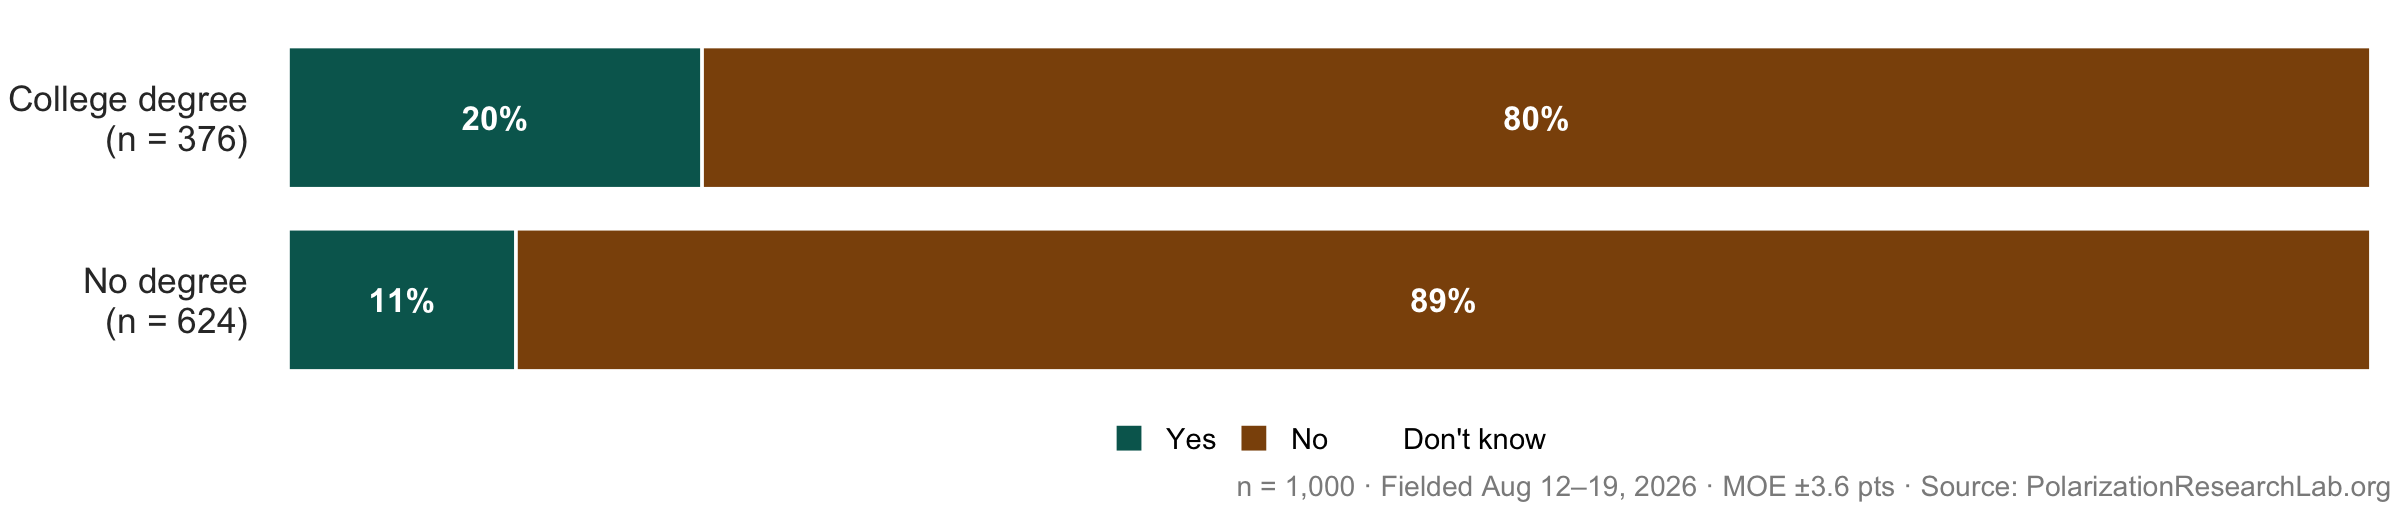
About one in eight respondents (12%) carries student loan debt and 14% have a child in or headed to college — the stakes in these debates are direct for a minority, while most respondents judge higher education from outside it.
Appendix: Detailed tables
Findings are based on two national surveys of U.S. adults: February 2026 (DART0059 Wave 8, fielded beginning February 10, 2026, n = 1,000) and August 2026 (DART0059 Wave 14, fielded beginning August 12, 2026, n = 1,000). All estimates are weighted; subgroup sample sizes are reported unweighted. Exhibits show the August 2026 wave unless labeled otherwise, and questions asked in both waves are shown as February–August trends. Question wording is reproduced verbatim from the questionnaire in the indented blocks. Chart labels under 4% are omitted. An asterisk (*) marks changes larger than the 95% margin of error, computed on effective sample sizes.
Each table reports weighted column percentages for the August 2026 wave with unweighted subgroup sizes. Percentages are computed among respondents who answered the question; rows may not sum to 100% due to rounding. Subgroups with no respondents are marked “—”; interpret small subgroups (e.g., Jewish respondents, Never Trumpers) with caution.
Table A1 | Effect of colleges on the country
“Overall, do you think colleges and universities have a positive or negative effect on the way things are going in this country?”
| Subgroup | N | Very positive | Somewhat positive | Neither positive nor negative | Somewhat negative | Very negative |
|---|---|---|---|---|---|---|
| Overall | 1,000 | 11% | 22% | 35% | 16% | 16% |
| Party | ||||||
| Democrat | 318 | 21% | 32% | 39% | 5% | 3% |
| Independent | 316 | 11% | 21% | 39% | 18% | 12% |
| Republican | 279 | 3% | 14% | 27% | 22% | 34% |
| Gender | ||||||
| Male | 464 | 12% | 23% | 29% | 17% | 19% |
| Female | 536 | 10% | 20% | 42% | 15% | 13% |
| Age | ||||||
| 18-29 | 162 | 16% | 25% | 40% | 9% | 9% |
| 30-44 | 287 | 12% | 26% | 37% | 12% | 13% |
| 45-64 | 300 | 11% | 17% | 34% | 19% | 19% |
| 65+ | 251 | 7% | 20% | 32% | 20% | 21% |
| Religion | ||||||
| Protestant | 364 | 6% | 20% | 33% | 18% | 23% |
| Catholic | 187 | 11% | 21% | 28% | 17% | 23% |
| Other Christian | 12 | 28% | 29% | 18% | 3% | 22% |
| Jewish | 21 | 14% | 33% | 31% | 13% | 9% |
| Other faith | 78 | 5% | 18% | 44% | 22% | 11% |
| Atheist/Agnostic | 140 | 28% | 30% | 29% | 10% | 2% |
| Nothing in particular | 198 | 10% | 19% | 49% | 13% | 9% |
| Income | ||||||
| <$50k | 363 | 7% | 21% | 45% | 16% | 12% |
| $50-100k | 312 | 13% | 20% | 33% | 16% | 17% |
| $100k+ | 243 | 15% | 27% | 24% | 14% | 19% |
| College degree | ||||||
| Yes | 376 | 18% | 29% | 26% | 15% | 13% |
| No | 624 | 7% | 18% | 41% | 16% | 18% |
| Child in college | ||||||
| Yes | 141 | 13% | 26% | 35% | 16% | 11% |
| No | 859 | 11% | 21% | 35% | 16% | 17% |
| Student loans | ||||||
| Yes | 123 | 12% | 22% | 44% | 15% | 7% |
| No | 877 | 11% | 22% | 34% | 16% | 17% |
| MAGA | ||||||
| MAGA Republican | 196 | 4% | 12% | 19% | 26% | 39% |
| Never Trumper | 12 | 7% | 63% | 10% | 7% | 13% |
| Neither | 162 | 1% | 12% | 35% | 24% | 29% |
| Regrets degree | ||||||
| Regrets | 58 | 11% | 11% | 33% | 17% | 29% |
| No regret | 318 | 20% | 32% | 24% | 14% | 10% |
| College major | ||||||
| Bus./Finance | 53 | 14% | 11% | 44% | 13% | 18% |
| Eng./CS | 53 | 17% | 41% | 18% | 13% | 11% |
| Natural Sci. | 31 | 26% | 34% | 23% | 4% | 12% |
| Math | 7 | 0% | 55% | 14% | 0% | 31% |
| Social Sci. | 67 | 17% | 34% | 31% | 11% | 7% |
| Humanities | 43 | 33% | 25% | 15% | 10% | 17% |
| Education | 39 | 12% | 29% | 33% | 17% | 9% |
| Health/Nursing | 20 | 13% | 37% | 11% | 31% | 8% |
| Arts/Comm. | 36 | 15% | 25% | 22% | 17% | 20% |
| Other | 27 | 28% | 20% | 18% | 25% | 9% |
Table A2 | Is a four-year degree worth the cost?
“Do you think a four-year college degree is worth the cost for most people?”
| Subgroup | N | Yes | No | Don’t know |
|---|---|---|---|---|
| Overall | 1,000 | 25% | 58% | 17% |
| Party | ||||
| Democrat | 318 | 37% | 45% | 18% |
| Independent | 316 | 20% | 64% | 16% |
| Republican | 279 | 23% | 64% | 13% |
| Gender | ||||
| Male | 464 | 24% | 60% | 16% |
| Female | 536 | 27% | 56% | 17% |
| Age | ||||
| 18-29 | 162 | 39% | 38% | 23% |
| 30-44 | 287 | 31% | 55% | 14% |
| 45-64 | 300 | 19% | 69% | 13% |
| 65+ | 251 | 15% | 65% | 20% |
| Religion | ||||
| Protestant | 364 | 24% | 63% | 14% |
| Catholic | 187 | 32% | 53% | 15% |
| Other Christian | 12 | 44% | 46% | 10% |
| Jewish | 21 | 22% | 33% | 46% |
| Other faith | 78 | 19% | 69% | 12% |
| Atheist/Agnostic | 140 | 32% | 49% | 19% |
| Nothing in particular | 198 | 18% | 60% | 21% |
| Income | ||||
| <$50k | 363 | 21% | 62% | 17% |
| $50-100k | 312 | 25% | 61% | 14% |
| $100k+ | 243 | 34% | 52% | 14% |
| College degree | ||||
| Yes | 376 | 40% | 46% | 14% |
| No | 624 | 17% | 65% | 18% |
| Child in college | ||||
| Yes | 141 | 34% | 52% | 14% |
| No | 859 | 24% | 59% | 17% |
| Student loans | ||||
| Yes | 123 | 25% | 56% | 19% |
| No | 877 | 25% | 58% | 16% |
| MAGA | ||||
| MAGA Republican | 196 | 22% | 70% | 9% |
| Never Trumper | 12 | 25% | 63% | 12% |
| Neither | 162 | 16% | 70% | 14% |
| Regrets degree | ||||
| Regrets | 58 | 10% | 79% | 11% |
| No regret | 318 | 46% | 39% | 15% |
| College major | ||||
| Bus./Finance | 53 | 27% | 55% | 18% |
| Eng./CS | 53 | 59% | 36% | 4% |
| Natural Sci. | 31 | 31% | 33% | 37% |
| Math | 7 | 43% | 57% | 0% |
| Social Sci. | 67 | 50% | 43% | 7% |
| Humanities | 43 | 34% | 48% | 19% |
| Education | 39 | 41% | 50% | 8% |
| Health/Nursing | 20 | 58% | 39% | 4% |
| Arts/Comm. | 36 | 25% | 52% | 23% |
| Other | 27 | 27% | 51% | 22% |
Table A3 | Does AI change the value of a degree?
“Does the rise of artificial intelligence make a four-year college degree more valuable, less valuable, or does it make no difference?”
| Subgroup | N | Much more valuable | Somewhat more valuable | No difference | Somewhat less valuable | Much less valuable | Not sure |
|---|---|---|---|---|---|---|---|
| Overall | 1,000 | 4% | 8% | 32% | 24% | 18% | 15% |
| Party | |||||||
| Democrat | 318 | 8% | 7% | 29% | 25% | 13% | 17% |
| Independent | 316 | 3% | 6% | 32% | 25% | 20% | 13% |
| Republican | 279 | 1% | 11% | 30% | 26% | 19% | 12% |
| Gender | |||||||
| Male | 464 | 4% | 9% | 35% | 21% | 19% | 13% |
| Female | 536 | 4% | 7% | 29% | 27% | 17% | 17% |
| Age | |||||||
| 18-29 | 162 | 7% | 12% | 26% | 22% | 18% | 15% |
| 30-44 | 287 | 5% | 10% | 30% | 20% | 20% | 16% |
| 45-64 | 300 | 3% | 7% | 33% | 27% | 18% | 12% |
| 65+ | 251 | 2% | 4% | 36% | 26% | 14% | 17% |
| Religion | |||||||
| Protestant | 364 | 3% | 6% | 33% | 28% | 19% | 12% |
| Catholic | 187 | 3% | 12% | 35% | 23% | 12% | 15% |
| Other Christian | 12 | 0% | 13% | 33% | 15% | 34% | 5% |
| Jewish | 21 | 0% | 0% | 19% | 23% | 12% | 45% |
| Other faith | 78 | 1% | 7% | 30% | 21% | 25% | 16% |
| Atheist/Agnostic | 140 | 11% | 7% | 29% | 22% | 18% | 12% |
| Nothing in particular | 198 | 4% | 9% | 31% | 21% | 18% | 18% |
| Income | |||||||
| <$50k | 363 | 3% | 8% | 31% | 21% | 21% | 17% |
| $50-100k | 312 | 3% | 9% | 32% | 24% | 19% | 13% |
| $100k+ | 243 | 7% | 7% | 33% | 27% | 14% | 10% |
| College degree | |||||||
| Yes | 376 | 7% | 9% | 30% | 27% | 13% | 13% |
| No | 624 | 2% | 7% | 33% | 22% | 20% | 15% |
| Child in college | |||||||
| Yes | 141 | 7% | 10% | 35% | 28% | 10% | 10% |
| No | 859 | 4% | 8% | 31% | 23% | 19% | 15% |
| Student loans | |||||||
| Yes | 123 | 10% | 6% | 25% | 35% | 12% | 12% |
| No | 877 | 3% | 8% | 33% | 22% | 19% | 15% |
| MAGA | |||||||
| MAGA Republican | 196 | 1% | 13% | 32% | 23% | 22% | 8% |
| Never Trumper | 12 | 0% | 0% | 51% | 19% | 10% | 19% |
| Neither | 162 | 1% | 7% | 29% | 35% | 17% | 13% |
| Regrets degree | |||||||
| Regrets | 58 | 0% | 2% | 32% | 29% | 32% | 6% |
| No regret | 318 | 8% | 11% | 30% | 27% | 10% | 14% |
| College major | |||||||
| Bus./Finance | 53 | 4% | 7% | 25% | 28% | 14% | 22% |
| Eng./CS | 53 | 10% | 19% | 31% | 20% | 10% | 9% |
| Natural Sci. | 31 | 10% | 4% | 27% | 32% | 10% | 17% |
| Math | 7 | 10% | 0% | 23% | 33% | 0% | 34% |
| Social Sci. | 67 | 9% | 7% | 33% | 30% | 11% | 10% |
| Humanities | 43 | 8% | 8% | 27% | 24% | 18% | 16% |
| Education | 39 | 4% | 7% | 36% | 24% | 20% | 9% |
| Health/Nursing | 20 | 15% | 13% | 28% | 19% | 18% | 7% |
| Arts/Comm. | 36 | 2% | 4% | 27% | 47% | 11% | 10% |
| Other | 27 | 0% | 16% | 39% | 18% | 13% | 13% |
Table A4 | Advice to a young person finishing high school
“If a young person you cared about finished high school today, what would you advise them to do?”
| Subgroup | N | Attend a four-year college | Attend community college | Learn a trade | Go straight to work | Join the military |
|---|---|---|---|---|---|---|
| Overall | 1,000 | 24% | 17% | 52% | 4% | 3% |
| Party | ||||||
| Democrat | 318 | 35% | 23% | 37% | 4% | 1% |
| Independent | 316 | 20% | 18% | 56% | 3% | 3% |
| Republican | 279 | 22% | 11% | 60% | 4% | 3% |
| Gender | ||||||
| Male | 464 | 26% | 15% | 52% | 3% | 4% |
| Female | 536 | 23% | 19% | 52% | 4% | 2% |
| Age | ||||||
| 18-29 | 162 | 33% | 27% | 34% | 5% | 1% |
| 30-44 | 287 | 28% | 17% | 51% | 4% | 1% |
| 45-64 | 300 | 21% | 13% | 58% | 4% | 4% |
| 65+ | 251 | 17% | 16% | 60% | 3% | 4% |
| Religion | ||||||
| Protestant | 364 | 21% | 16% | 56% | 3% | 3% |
| Catholic | 187 | 30% | 12% | 51% | 4% | 4% |
| Other Christian | 12 | 54% | 22% | 18% | 6% | 0% |
| Jewish | 21 | 42% | 22% | 36% | 0% | 0% |
| Other faith | 78 | 19% | 24% | 52% | 3% | 2% |
| Atheist/Agnostic | 140 | 32% | 20% | 43% | 3% | 2% |
| Nothing in particular | 198 | 18% | 21% | 56% | 5% | 1% |
| Income | ||||||
| <$50k | 363 | 21% | 16% | 55% | 6% | 2% |
| $50-100k | 312 | 23% | 19% | 52% | 3% | 3% |
| $100k+ | 243 | 33% | 17% | 46% | 2% | 3% |
| College degree | ||||||
| Yes | 376 | 37% | 22% | 37% | 2% | 2% |
| No | 624 | 17% | 15% | 61% | 5% | 3% |
| Child in college | ||||||
| Yes | 141 | 38% | 20% | 37% | 1% | 5% |
| No | 859 | 22% | 17% | 54% | 4% | 2% |
| Student loans | ||||||
| Yes | 123 | 28% | 25% | 43% | 2% | 2% |
| No | 877 | 24% | 16% | 53% | 4% | 3% |
| MAGA | ||||||
| MAGA Republican | 196 | 20% | 10% | 63% | 4% | 4% |
| Never Trumper | 12 | 38% | 17% | 29% | 0% | 16% |
| Neither | 162 | 18% | 15% | 60% | 2% | 4% |
| Regrets degree | ||||||
| Regrets | 58 | 16% | 15% | 68% | 1% | 0% |
| No regret | 318 | 41% | 23% | 31% | 2% | 3% |
| College major | ||||||
| Bus./Finance | 53 | 25% | 24% | 47% | 2% | 1% |
| Eng./CS | 53 | 57% | 14% | 27% | 2% | 0% |
| Natural Sci. | 31 | 34% | 35% | 26% | 2% | 3% |
| Math | 7 | 55% | 19% | 26% | 0% | 0% |
| Social Sci. | 67 | 45% | 17% | 29% | 4% | 5% |
| Humanities | 43 | 40% | 35% | 24% | 0% | 0% |
| Education | 39 | 29% | 17% | 55% | 0% | 0% |
| Health/Nursing | 20 | 38% | 35% | 20% | 0% | 8% |
| Arts/Comm. | 36 | 21% | 14% | 57% | 3% | 4% |
| Other | 27 | 28% | 13% | 55% | 0% | 4% |
Table A5 | Are student loans reasonable?
“For most students, it is reasonable to take out student loans to pay for a four-year college degree.”
| Subgroup | N | Strongly agree | Somewhat agree | Neither agree nor disagree | Somewhat disagree | Strongly disagree |
|---|---|---|---|---|---|---|
| Overall | 1,000 | 8% | 24% | 27% | 22% | 20% |
| Party | ||||||
| Democrat | 318 | 10% | 25% | 28% | 25% | 12% |
| Independent | 316 | 4% | 26% | 25% | 20% | 24% |
| Republican | 279 | 9% | 22% | 28% | 21% | 20% |
| Gender | ||||||
| Male | 464 | 9% | 22% | 26% | 19% | 24% |
| Female | 536 | 6% | 26% | 28% | 25% | 15% |
| Age | ||||||
| 18-29 | 162 | 8% | 31% | 29% | 20% | 13% |
| 30-44 | 287 | 7% | 22% | 29% | 18% | 24% |
| 45-64 | 300 | 8% | 21% | 23% | 24% | 24% |
| 65+ | 251 | 7% | 24% | 29% | 26% | 15% |
| Religion | ||||||
| Protestant | 364 | 9% | 20% | 29% | 24% | 18% |
| Catholic | 187 | 8% | 31% | 24% | 18% | 19% |
| Other Christian | 12 | 10% | 33% | 0% | 18% | 39% |
| Jewish | 21 | 11% | 28% | 45% | 11% | 5% |
| Other faith | 78 | 3% | 29% | 26% | 24% | 18% |
| Atheist/Agnostic | 140 | 7% | 20% | 18% | 27% | 27% |
| Nothing in particular | 198 | 7% | 23% | 31% | 20% | 18% |
| Income | ||||||
| <$50k | 363 | 8% | 25% | 28% | 21% | 19% |
| $50-100k | 312 | 6% | 26% | 22% | 25% | 21% |
| $100k+ | 243 | 11% | 21% | 26% | 22% | 20% |
| College degree | ||||||
| Yes | 376 | 9% | 25% | 23% | 22% | 21% |
| No | 624 | 7% | 23% | 29% | 22% | 19% |
| Child in college | ||||||
| Yes | 141 | 10% | 33% | 22% | 20% | 15% |
| No | 859 | 7% | 22% | 28% | 22% | 20% |
| Student loans | ||||||
| Yes | 123 | 10% | 25% | 16% | 30% | 19% |
| No | 877 | 7% | 23% | 29% | 21% | 20% |
| MAGA | ||||||
| MAGA Republican | 196 | 7% | 25% | 26% | 19% | 22% |
| Never Trumper | 12 | 12% | 51% | 6% | 16% | 16% |
| Neither | 162 | 8% | 18% | 24% | 29% | 22% |
| Regrets degree | ||||||
| Regrets | 58 | 7% | 14% | 10% | 26% | 43% |
| No regret | 318 | 10% | 27% | 26% | 21% | 16% |
| College major | ||||||
| Bus./Finance | 53 | 7% | 20% | 35% | 17% | 22% |
| Eng./CS | 53 | 17% | 38% | 19% | 11% | 15% |
| Natural Sci. | 31 | 8% | 19% | 30% | 18% | 25% |
| Math | 7 | 0% | 37% | 32% | 31% | 0% |
| Social Sci. | 67 | 9% | 19% | 20% | 26% | 26% |
| Humanities | 43 | 6% | 15% | 33% | 24% | 23% |
| Education | 39 | 8% | 28% | 14% | 33% | 18% |
| Health/Nursing | 20 | 13% | 51% | 22% | 8% | 6% |
| Arts/Comm. | 36 | 10% | 11% | 16% | 35% | 28% |
| Other | 27 | 3% | 32% | 19% | 21% | 25% |
Table A6 | Federal student loans
“Do you support or oppose the federal government providing student loans to help people pay for college?”
| Subgroup | N | Strongly support | Somewhat support | Neither support nor oppose | Somewhat oppose | Strongly oppose |
|---|---|---|---|---|---|---|
| Overall | 1,000 | 34% | 27% | 20% | 8% | 10% |
| Party | ||||||
| Democrat | 318 | 50% | 32% | 9% | 4% | 5% |
| Independent | 316 | 34% | 30% | 19% | 8% | 8% |
| Republican | 279 | 18% | 24% | 25% | 15% | 19% |
| Gender | ||||||
| Male | 464 | 31% | 26% | 20% | 9% | 13% |
| Female | 536 | 37% | 28% | 20% | 7% | 8% |
| Age | ||||||
| 18-29 | 162 | 42% | 23% | 23% | 4% | 8% |
| 30-44 | 287 | 37% | 27% | 20% | 6% | 10% |
| 45-64 | 300 | 32% | 24% | 19% | 13% | 12% |
| 65+ | 251 | 26% | 37% | 19% | 8% | 11% |
| Religion | ||||||
| Protestant | 364 | 27% | 29% | 20% | 11% | 14% |
| Catholic | 187 | 33% | 28% | 19% | 5% | 15% |
| Other Christian | 12 | 42% | 26% | 0% | 10% | 22% |
| Jewish | 21 | 41% | 27% | 21% | 10% | 0% |
| Other faith | 78 | 46% | 21% | 22% | 6% | 5% |
| Atheist/Agnostic | 140 | 49% | 27% | 14% | 3% | 8% |
| Nothing in particular | 198 | 32% | 28% | 26% | 10% | 5% |
| Income | ||||||
| <$50k | 363 | 37% | 26% | 24% | 7% | 7% |
| $50-100k | 312 | 37% | 27% | 16% | 8% | 12% |
| $100k+ | 243 | 30% | 30% | 17% | 10% | 13% |
| College degree | ||||||
| Yes | 376 | 38% | 31% | 15% | 7% | 9% |
| No | 624 | 32% | 25% | 23% | 9% | 11% |
| Child in college | ||||||
| Yes | 141 | 40% | 35% | 14% | 4% | 7% |
| No | 859 | 33% | 26% | 21% | 9% | 11% |
| Student loans | ||||||
| Yes | 123 | 41% | 27% | 15% | 6% | 11% |
| No | 877 | 33% | 27% | 21% | 8% | 10% |
| MAGA | ||||||
| MAGA Republican | 196 | 17% | 24% | 22% | 13% | 23% |
| Never Trumper | 12 | 36% | 22% | 10% | 26% | 7% |
| Neither | 162 | 18% | 29% | 25% | 13% | 15% |
| Regrets degree | ||||||
| Regrets | 58 | 30% | 17% | 24% | 15% | 12% |
| No regret | 318 | 40% | 33% | 14% | 5% | 8% |
| College major | ||||||
| Bus./Finance | 53 | 24% | 22% | 33% | 12% | 9% |
| Eng./CS | 53 | 31% | 44% | 9% | 5% | 11% |
| Natural Sci. | 31 | 39% | 41% | 10% | 10% | 0% |
| Math | 7 | 21% | 22% | 26% | 12% | 19% |
| Social Sci. | 67 | 45% | 25% | 13% | 3% | 14% |
| Humanities | 43 | 52% | 28% | 8% | 5% | 7% |
| Education | 39 | 36% | 35% | 18% | 5% | 7% |
| Health/Nursing | 20 | 61% | 28% | 8% | 3% | 0% |
| Arts/Comm. | 36 | 35% | 29% | 19% | 7% | 10% |
| Other | 27 | 41% | 26% | 10% | 15% | 8% |
Table A7 | Federal research funding
“Do you support or oppose the federal government funding scientific and medical research at colleges and universities?”
| Subgroup | N | Strongly support | Somewhat support | Neither support nor oppose | Somewhat oppose | Strongly oppose |
|---|---|---|---|---|---|---|
| Overall | 999 | 41% | 29% | 21% | 6% | 4% |
| Party | ||||||
| Democrat | 318 | 66% | 24% | 10% | 1% | 0% |
| Independent | 315 | 40% | 32% | 18% | 6% | 4% |
| Republican | 279 | 19% | 32% | 31% | 11% | 7% |
| Gender | ||||||
| Male | 464 | 43% | 25% | 21% | 5% | 5% |
| Female | 535 | 39% | 32% | 21% | 6% | 2% |
| Age | ||||||
| 18-29 | 162 | 46% | 26% | 20% | 5% | 3% |
| 30-44 | 286 | 45% | 28% | 20% | 6% | 2% |
| 45-64 | 300 | 35% | 32% | 20% | 7% | 6% |
| 65+ | 251 | 40% | 27% | 24% | 5% | 4% |
| Religion | ||||||
| Protestant | 363 | 32% | 34% | 24% | 6% | 4% |
| Catholic | 187 | 36% | 31% | 22% | 6% | 6% |
| Other Christian | 12 | 46% | 26% | 5% | 0% | 22% |
| Jewish | 21 | 75% | 12% | 9% | 0% | 4% |
| Other faith | 78 | 32% | 34% | 20% | 9% | 4% |
| Atheist/Agnostic | 140 | 73% | 14% | 9% | 1% | 2% |
| Nothing in particular | 198 | 40% | 27% | 24% | 8% | 1% |
| Income | ||||||
| <$50k | 363 | 38% | 30% | 25% | 5% | 3% |
| $50-100k | 311 | 44% | 28% | 16% | 7% | 5% |
| $100k+ | 243 | 46% | 28% | 17% | 5% | 4% |
| College degree | ||||||
| Yes | 375 | 51% | 26% | 13% | 5% | 5% |
| No | 624 | 35% | 30% | 25% | 6% | 3% |
| Child in college | ||||||
| Yes | 141 | 39% | 40% | 15% | 4% | 2% |
| No | 858 | 41% | 27% | 22% | 6% | 4% |
| Student loans | ||||||
| Yes | 123 | 61% | 17% | 15% | 5% | 2% |
| No | 876 | 38% | 30% | 22% | 6% | 4% |
| MAGA | ||||||
| MAGA Republican | 196 | 13% | 34% | 30% | 14% | 9% |
| Never Trumper | 12 | 61% | 25% | 7% | 0% | 7% |
| Neither | 162 | 26% | 34% | 27% | 9% | 4% |
| Regrets degree | ||||||
| Regrets | 58 | 43% | 17% | 15% | 8% | 17% |
| No regret | 317 | 53% | 28% | 13% | 5% | 2% |
| College major | ||||||
| Bus./Finance | 53 | 35% | 21% | 23% | 11% | 11% |
| Eng./CS | 52 | 45% | 32% | 18% | 4% | 0% |
| Natural Sci. | 31 | 71% | 17% | 3% | 10% | 0% |
| Math | 7 | 69% | 0% | 12% | 0% | 19% |
| Social Sci. | 67 | 63% | 27% | 5% | 2% | 3% |
| Humanities | 43 | 64% | 16% | 10% | 0% | 10% |
| Education | 39 | 42% | 41% | 10% | 5% | 2% |
| Health/Nursing | 20 | 59% | 22% | 6% | 12% | 0% |
| Arts/Comm. | 36 | 54% | 29% | 13% | 4% | 0% |
| Other | 27 | 31% | 29% | 30% | 0% | 11% |
Table A8 | Withhold funding: Combat antisemitism on campus
“Should the federal government be allowed to withhold research funding from universities in order to pressure them to …” Item: Combat antisemitism on campus
| Subgroup | N | Definitely should | Probably should | Probably should not | Definitely should not |
|---|---|---|---|---|---|
| Overall | 1,000 | 25% | 28% | 25% | 23% |
| Party | |||||
| Democrat | 318 | 15% | 28% | 27% | 30% |
| Independent | 316 | 18% | 30% | 24% | 27% |
| Republican | 279 | 45% | 23% | 23% | 9% |
| Gender | |||||
| Male | 464 | 26% | 27% | 21% | 25% |
| Female | 536 | 23% | 28% | 28% | 20% |
| Age | |||||
| 18-29 | 162 | 17% | 36% | 26% | 21% |
| 30-44 | 287 | 17% | 26% | 27% | 30% |
| 45-64 | 300 | 29% | 26% | 25% | 20% |
| 65+ | 251 | 35% | 25% | 22% | 18% |
| Religion | |||||
| Protestant | 364 | 30% | 29% | 25% | 15% |
| Catholic | 187 | 33% | 25% | 24% | 18% |
| Other Christian | 12 | 32% | 41% | 5% | 23% |
| Jewish | 21 | 29% | 20% | 18% | 33% |
| Other faith | 78 | 10% | 26% | 29% | 34% |
| Atheist/Agnostic | 140 | 16% | 26% | 23% | 35% |
| Nothing in particular | 198 | 18% | 30% | 27% | 26% |
| Income | |||||
| <$50k | 363 | 21% | 27% | 30% | 23% |
| $50-100k | 312 | 26% | 27% | 23% | 24% |
| $100k+ | 243 | 28% | 29% | 20% | 23% |
| College degree | |||||
| Yes | 376 | 25% | 29% | 21% | 25% |
| No | 624 | 25% | 27% | 27% | 21% |
| Child in college | |||||
| Yes | 141 | 20% | 31% | 22% | 27% |
| No | 859 | 26% | 27% | 25% | 22% |
| Student loans | |||||
| Yes | 123 | 13% | 37% | 17% | 34% |
| No | 877 | 26% | 27% | 26% | 21% |
| MAGA | |||||
| MAGA Republican | 196 | 54% | 23% | 19% | 4% |
| Never Trumper | 12 | 43% | 16% | 29% | 13% |
| Neither | 162 | 32% | 32% | 20% | 16% |
| Regrets degree | |||||
| Regrets | 58 | 29% | 34% | 11% | 26% |
| No regret | 318 | 24% | 28% | 23% | 25% |
| College major | |||||
| Bus./Finance | 53 | 33% | 26% | 20% | 21% |
| Eng./CS | 53 | 32% | 33% | 23% | 12% |
| Natural Sci. | 31 | 18% | 10% | 19% | 53% |
| Math | 7 | 31% | 23% | 36% | 10% |
| Social Sci. | 67 | 10% | 31% | 22% | 38% |
| Humanities | 43 | 14% | 24% | 18% | 43% |
| Education | 39 | 26% | 35% | 24% | 14% |
| Health/Nursing | 20 | 32% | 44% | 23% | 0% |
| Arts/Comm. | 36 | 41% | 24% | 14% | 21% |
| Other | 27 | 19% | 29% | 21% | 31% |
Table A9 | Withhold funding: Hire more conservative professors
“Should the federal government be allowed to withhold research funding from universities in order to pressure them to …” Item: Hire more conservative professors
| Subgroup | N | Definitely should | Probably should | Probably should not | Definitely should not |
|---|---|---|---|---|---|
| Overall | 1,000 | 14% | 22% | 26% | 38% |
| Party | |||||
| Democrat | 318 | 4% | 9% | 27% | 60% |
| Independent | 316 | 10% | 24% | 27% | 39% |
| Republican | 279 | 29% | 33% | 24% | 15% |
| Gender | |||||
| Male | 464 | 18% | 23% | 23% | 36% |
| Female | 536 | 10% | 21% | 29% | 40% |
| Age | |||||
| 18-29 | 162 | 11% | 19% | 27% | 44% |
| 30-44 | 287 | 8% | 25% | 24% | 43% |
| 45-64 | 300 | 16% | 24% | 27% | 34% |
| 65+ | 251 | 19% | 20% | 27% | 34% |
| Religion | |||||
| Protestant | 364 | 18% | 27% | 26% | 30% |
| Catholic | 187 | 21% | 26% | 28% | 25% |
| Other Christian | 12 | 32% | 10% | 14% | 44% |
| Jewish | 21 | 11% | 4% | 13% | 72% |
| Other faith | 78 | 7% | 19% | 27% | 47% |
| Atheist/Agnostic | 140 | 3% | 4% | 27% | 65% |
| Nothing in particular | 198 | 8% | 26% | 26% | 40% |
| Income | |||||
| <$50k | 363 | 11% | 23% | 28% | 38% |
| $50-100k | 312 | 17% | 21% | 24% | 39% |
| $100k+ | 243 | 15% | 21% | 23% | 41% |
| College degree | |||||
| Yes | 376 | 11% | 19% | 24% | 46% |
| No | 624 | 15% | 24% | 27% | 34% |
| Child in college | |||||
| Yes | 141 | 9% | 28% | 23% | 40% |
| No | 859 | 14% | 21% | 27% | 38% |
| Student loans | |||||
| Yes | 123 | 4% | 20% | 22% | 55% |
| No | 877 | 15% | 22% | 27% | 36% |
| MAGA | |||||
| MAGA Republican | 196 | 42% | 28% | 22% | 8% |
| Never Trumper | 12 | 10% | 32% | 21% | 37% |
| Neither | 162 | 13% | 38% | 29% | 21% |
| Regrets degree | |||||
| Regrets | 58 | 18% | 31% | 14% | 36% |
| No regret | 318 | 10% | 17% | 26% | 48% |
| College major | |||||
| Bus./Finance | 53 | 18% | 25% | 18% | 39% |
| Eng./CS | 53 | 16% | 25% | 28% | 31% |
| Natural Sci. | 31 | 10% | 2% | 18% | 70% |
| Math | 7 | 12% | 31% | 34% | 24% |
| Social Sci. | 67 | 3% | 9% | 29% | 59% |
| Humanities | 43 | 1% | 21% | 25% | 52% |
| Education | 39 | 6% | 23% | 26% | 45% |
| Health/Nursing | 20 | 21% | 21% | 20% | 37% |
| Arts/Comm. | 36 | 7% | 22% | 27% | 44% |
| Other | 27 | 19% | 24% | 13% | 44% |
Table A10 | Withhold funding: Eliminate diversity, equity, and inclusion programs
“Should the federal government be allowed to withhold research funding from universities in order to pressure them to …” Item: Eliminate diversity, equity, and inclusion programs
| Subgroup | N | Definitely should | Probably should | Probably should not | Definitely should not |
|---|---|---|---|---|---|
| Overall | 1,000 | 20% | 17% | 17% | 46% |
| Party | |||||
| Democrat | 318 | 3% | 10% | 11% | 75% |
| Independent | 316 | 17% | 18% | 17% | 49% |
| Republican | 279 | 38% | 24% | 23% | 16% |
| Gender | |||||
| Male | 464 | 24% | 16% | 15% | 45% |
| Female | 536 | 15% | 18% | 18% | 48% |
| Age | |||||
| 18-29 | 162 | 11% | 15% | 18% | 56% |
| 30-44 | 287 | 14% | 20% | 17% | 48% |
| 45-64 | 300 | 24% | 18% | 17% | 41% |
| 65+ | 251 | 26% | 15% | 15% | 45% |
| Religion | |||||
| Protestant | 364 | 25% | 19% | 19% | 37% |
| Catholic | 187 | 23% | 20% | 22% | 35% |
| Other Christian | 12 | 32% | 3% | 11% | 54% |
| Jewish | 21 | 14% | 0% | 9% | 77% |
| Other faith | 78 | 20% | 19% | 7% | 54% |
| Atheist/Agnostic | 140 | 9% | 5% | 9% | 78% |
| Nothing in particular | 198 | 13% | 22% | 20% | 46% |
| Income | |||||
| <$50k | 363 | 16% | 17% | 20% | 46% |
| $50-100k | 312 | 19% | 21% | 17% | 44% |
| $100k+ | 243 | 22% | 14% | 12% | 51% |
| College degree | |||||
| Yes | 376 | 17% | 16% | 14% | 53% |
| No | 624 | 21% | 18% | 19% | 43% |
| Child in college | |||||
| Yes | 141 | 18% | 17% | 18% | 46% |
| No | 859 | 20% | 17% | 17% | 46% |
| Student loans | |||||
| Yes | 123 | 5% | 13% | 14% | 68% |
| No | 877 | 22% | 18% | 17% | 43% |
| MAGA | |||||
| MAGA Republican | 196 | 49% | 25% | 17% | 8% |
| Never Trumper | 12 | 12% | 27% | 12% | 49% |
| Neither | 162 | 31% | 18% | 25% | 26% |
| Regrets degree | |||||
| Regrets | 58 | 35% | 12% | 4% | 48% |
| No regret | 318 | 14% | 17% | 15% | 54% |
| College major | |||||
| Bus./Finance | 53 | 32% | 20% | 17% | 32% |
| Eng./CS | 53 | 21% | 22% | 23% | 34% |
| Natural Sci. | 31 | 8% | 4% | 0% | 87% |
| Math | 7 | 54% | 12% | 14% | 21% |
| Social Sci. | 67 | 3% | 13% | 18% | 65% |
| Humanities | 43 | 8% | 8% | 12% | 71% |
| Education | 39 | 10% | 21% | 9% | 60% |
| Health/Nursing | 20 | 24% | 18% | 7% | 51% |
| Arts/Comm. | 36 | 19% | 10% | 8% | 64% |
| Other | 27 | 27% | 25% | 12% | 36% |
Table A11 | Withhold funding: Freeze tuition for five years
“Should the federal government be allowed to withhold research funding from universities in order to pressure them to …” Item: Freeze tuition for five years
| Subgroup | N | Definitely should | Probably should | Probably should not | Definitely should not |
|---|---|---|---|---|---|
| Overall | 1,000 | 16% | 26% | 30% | 29% |
| Party | |||||
| Democrat | 318 | 18% | 19% | 27% | 37% |
| Independent | 316 | 14% | 26% | 30% | 31% |
| Republican | 279 | 16% | 34% | 31% | 19% |
| Gender | |||||
| Male | 464 | 16% | 27% | 28% | 30% |
| Female | 536 | 16% | 25% | 31% | 28% |
| Age | |||||
| 18-29 | 162 | 11% | 28% | 34% | 27% |
| 30-44 | 287 | 15% | 25% | 28% | 32% |
| 45-64 | 300 | 20% | 26% | 29% | 25% |
| 65+ | 251 | 15% | 25% | 29% | 31% |
| Religion | |||||
| Protestant | 364 | 13% | 29% | 31% | 27% |
| Catholic | 187 | 22% | 28% | 25% | 25% |
| Other Christian | 12 | 10% | 12% | 25% | 53% |
| Jewish | 21 | 14% | 12% | 39% | 35% |
| Other faith | 78 | 12% | 22% | 30% | 37% |
| Atheist/Agnostic | 140 | 16% | 17% | 34% | 33% |
| Nothing in particular | 198 | 17% | 28% | 28% | 27% |
| Income | |||||
| <$50k | 363 | 16% | 24% | 31% | 29% |
| $50-100k | 312 | 16% | 26% | 28% | 31% |
| $100k+ | 243 | 18% | 23% | 28% | 30% |
| College degree | |||||
| Yes | 376 | 16% | 26% | 31% | 28% |
| No | 624 | 16% | 26% | 29% | 29% |
| Child in college | |||||
| Yes | 141 | 15% | 27% | 34% | 24% |
| No | 859 | 16% | 26% | 29% | 29% |
| Student loans | |||||
| Yes | 123 | 18% | 22% | 22% | 38% |
| No | 877 | 16% | 26% | 31% | 27% |
| MAGA | |||||
| MAGA Republican | 196 | 22% | 35% | 26% | 17% |
| Never Trumper | 12 | 12% | 29% | 31% | 28% |
| Neither | 162 | 13% | 29% | 35% | 23% |
| Regrets degree | |||||
| Regrets | 58 | 23% | 32% | 23% | 22% |
| No regret | 318 | 14% | 25% | 32% | 29% |
| College major | |||||
| Bus./Finance | 53 | 22% | 30% | 28% | 21% |
| Eng./CS | 53 | 14% | 29% | 37% | 20% |
| Natural Sci. | 31 | 12% | 10% | 37% | 41% |
| Math | 7 | 0% | 53% | 47% | 0% |
| Social Sci. | 67 | 12% | 26% | 26% | 36% |
| Humanities | 43 | 22% | 22% | 29% | 28% |
| Education | 39 | 21% | 24% | 29% | 27% |
| Health/Nursing | 20 | 19% | 20% | 26% | 35% |
| Arts/Comm. | 36 | 14% | 30% | 34% | 23% |
| Other | 27 | 6% | 30% | 30% | 34% |
Table A12 | Withhold funding: Limit enrollment of international students
“Should the federal government be allowed to withhold research funding from universities in order to pressure them to …” Item: Limit enrollment of international students
| Subgroup | N | Definitely should | Probably should | Probably should not | Definitely should not |
|---|---|---|---|---|---|
| Overall | 999 | 15% | 19% | 28% | 38% |
| Party | |||||
| Democrat | 318 | 2% | 10% | 25% | 63% |
| Independent | 315 | 13% | 18% | 32% | 37% |
| Republican | 279 | 31% | 28% | 27% | 14% |
| Gender | |||||
| Male | 464 | 16% | 20% | 27% | 36% |
| Female | 535 | 13% | 18% | 29% | 40% |
| Age | |||||
| 18-29 | 162 | 7% | 15% | 35% | 43% |
| 30-44 | 287 | 12% | 16% | 26% | 46% |
| 45-64 | 299 | 17% | 21% | 29% | 33% |
| 65+ | 251 | 21% | 23% | 25% | 32% |
| Religion | |||||
| Protestant | 364 | 18% | 21% | 32% | 29% |
| Catholic | 187 | 22% | 24% | 31% | 24% |
| Other Christian | 12 | 22% | 14% | 11% | 54% |
| Jewish | 21 | 7% | 9% | 6% | 78% |
| Other faith | 77 | 9% | 20% | 19% | 52% |
| Atheist/Agnostic | 140 | 3% | 10% | 23% | 64% |
| Nothing in particular | 198 | 12% | 17% | 29% | 41% |
| Income | |||||
| <$50k | 362 | 12% | 19% | 31% | 37% |
| $50-100k | 312 | 16% | 20% | 26% | 38% |
| $100k+ | 243 | 15% | 17% | 24% | 44% |
| College degree | |||||
| Yes | 376 | 13% | 16% | 25% | 46% |
| No | 623 | 15% | 21% | 30% | 34% |
| Child in college | |||||
| Yes | 141 | 13% | 16% | 28% | 43% |
| No | 858 | 15% | 20% | 28% | 37% |
| Student loans | |||||
| Yes | 123 | 5% | 14% | 27% | 55% |
| No | 876 | 16% | 20% | 28% | 36% |
| MAGA | |||||
| MAGA Republican | 196 | 42% | 27% | 22% | 8% |
| Never Trumper | 12 | 6% | 20% | 16% | 59% |
| Neither | 162 | 19% | 33% | 30% | 18% |
| Regrets degree | |||||
| Regrets | 58 | 31% | 18% | 18% | 33% |
| No regret | 318 | 10% | 15% | 27% | 48% |
| College major | |||||
| Bus./Finance | 53 | 29% | 11% | 28% | 32% |
| Eng./CS | 53 | 10% | 19% | 35% | 36% |
| Natural Sci. | 31 | 6% | 2% | 16% | 76% |
| Math | 7 | 12% | 31% | 25% | 32% |
| Social Sci. | 67 | 2% | 17% | 27% | 54% |
| Humanities | 43 | 18% | 0% | 23% | 59% |
| Education | 39 | 9% | 17% | 25% | 49% |
| Health/Nursing | 20 | 18% | 26% | 25% | 31% |
| Arts/Comm. | 36 | 7% | 26% | 22% | 45% |
| Other | 27 | 23% | 25% | 14% | 38% |
Table A13 | Should the SAT/ACT be required?
“Do you think colleges and universities should require applicants to submit SAT or ACT scores as part of the admissions process?”
| Subgroup | N | Yes, testing should be required | Testing should be optional but encouraged | Testing should be optional with no preference | No, test scores should not be considered at all | Not sure |
|---|---|---|---|---|---|---|
| Overall | 1,000 | 40% | 24% | 14% | 8% | 14% |
| Party | ||||||
| Democrat | 318 | 29% | 28% | 20% | 11% | 12% |
| Independent | 316 | 41% | 23% | 14% | 7% | 14% |
| Republican | 279 | 52% | 21% | 9% | 5% | 12% |
| Gender | ||||||
| Male | 464 | 44% | 22% | 11% | 7% | 15% |
| Female | 536 | 36% | 26% | 17% | 8% | 12% |
| Age | ||||||
| 18-29 | 162 | 23% | 31% | 20% | 6% | 20% |
| 30-44 | 287 | 29% | 28% | 15% | 11% | 16% |
| 45-64 | 300 | 47% | 21% | 12% | 10% | 10% |
| 65+ | 251 | 59% | 18% | 9% | 2% | 11% |
| Religion | ||||||
| Protestant | 364 | 45% | 24% | 9% | 8% | 14% |
| Catholic | 187 | 44% | 27% | 14% | 6% | 9% |
| Other Christian | 12 | 47% | 26% | 8% | 10% | 8% |
| Jewish | 21 | 47% | 23% | 19% | 0% | 11% |
| Other faith | 78 | 34% | 14% | 29% | 11% | 11% |
| Atheist/Agnostic | 140 | 32% | 30% | 14% | 8% | 16% |
| Nothing in particular | 198 | 35% | 21% | 17% | 8% | 19% |
| Income | ||||||
| <$50k | 363 | 37% | 21% | 14% | 11% | 17% |
| $50-100k | 312 | 38% | 29% | 17% | 6% | 10% |
| $100k+ | 243 | 48% | 25% | 12% | 6% | 10% |
| College degree | ||||||
| Yes | 376 | 45% | 27% | 14% | 4% | 10% |
| No | 624 | 37% | 23% | 14% | 10% | 16% |
| Child in college | ||||||
| Yes | 141 | 35% | 32% | 21% | 6% | 6% |
| No | 859 | 41% | 23% | 13% | 8% | 15% |
| Student loans | ||||||
| Yes | 123 | 29% | 32% | 20% | 10% | 9% |
| No | 877 | 42% | 23% | 13% | 7% | 14% |
| MAGA | ||||||
| MAGA Republican | 196 | 53% | 20% | 11% | 5% | 10% |
| Never Trumper | 12 | 71% | 29% | 0% | 0% | 0% |
| Neither | 162 | 54% | 20% | 7% | 6% | 12% |
| Regrets degree | ||||||
| Regrets | 58 | 44% | 16% | 15% | 9% | 16% |
| No regret | 318 | 46% | 29% | 14% | 3% | 9% |
| College major | ||||||
| Bus./Finance | 53 | 47% | 16% | 11% | 2% | 25% |
| Eng./CS | 53 | 49% | 29% | 14% | 3% | 4% |
| Natural Sci. | 31 | 59% | 23% | 16% | 0% | 2% |
| Math | 7 | 79% | 10% | 12% | 0% | 0% |
| Social Sci. | 67 | 40% | 31% | 18% | 7% | 4% |
| Humanities | 43 | 30% | 38% | 15% | 7% | 9% |
| Education | 39 | 49% | 35% | 11% | 6% | 0% |
| Health/Nursing | 20 | 32% | 29% | 25% | 0% | 13% |
| Arts/Comm. | 36 | 51% | 31% | 3% | 0% | 16% |
| Other | 27 | 49% | 7% | 11% | 12% | 21% |
Table A14 | Required course: Mathematics
“Should colleges require all students to complete at least one course in each of the following areas, regardless of their major?” Item: Mathematics
| Subgroup | N | Definitely should require | Probably should require | Probably should not require | Definitely should not require |
|---|---|---|---|---|---|
| Overall | 1,000 | 52% | 34% | 9% | 4% |
| Party | |||||
| Democrat | 318 | 50% | 34% | 9% | 7% |
| Independent | 316 | 52% | 36% | 10% | 2% |
| Republican | 279 | 54% | 34% | 8% | 4% |
| Gender | |||||
| Male | 464 | 57% | 30% | 9% | 4% |
| Female | 536 | 48% | 38% | 10% | 4% |
| Age | |||||
| 18-29 | 162 | 47% | 36% | 12% | 5% |
| 30-44 | 287 | 50% | 36% | 7% | 7% |
| 45-64 | 300 | 55% | 30% | 11% | 3% |
| 65+ | 251 | 55% | 35% | 7% | 2% |
| Religion | |||||
| Protestant | 364 | 49% | 38% | 9% | 4% |
| Catholic | 187 | 55% | 33% | 8% | 3% |
| Other Christian | 12 | 59% | 27% | 5% | 10% |
| Jewish | 21 | 55% | 29% | 16% | 0% |
| Other faith | 78 | 50% | 29% | 11% | 10% |
| Atheist/Agnostic | 140 | 58% | 29% | 7% | 5% |
| Nothing in particular | 198 | 52% | 33% | 10% | 5% |
| Income | |||||
| <$50k | 363 | 50% | 34% | 10% | 6% |
| $50-100k | 312 | 52% | 34% | 10% | 4% |
| $100k+ | 243 | 58% | 30% | 9% | 4% |
| College degree | |||||
| Yes | 376 | 57% | 33% | 7% | 3% |
| No | 624 | 49% | 35% | 11% | 5% |
| Child in college | |||||
| Yes | 141 | 59% | 31% | 6% | 4% |
| No | 859 | 51% | 35% | 10% | 5% |
| Student loans | |||||
| Yes | 123 | 57% | 33% | 8% | 2% |
| No | 877 | 51% | 34% | 10% | 5% |
| MAGA | |||||
| MAGA Republican | 196 | 58% | 32% | 8% | 3% |
| Never Trumper | 12 | 77% | 18% | 5% | 0% |
| Neither | 162 | 52% | 33% | 10% | 4% |
| Regrets degree | |||||
| Regrets | 58 | 49% | 34% | 13% | 4% |
| No regret | 318 | 59% | 33% | 6% | 2% |
| College major | |||||
| Bus./Finance | 53 | 65% | 32% | 3% | 0% |
| Eng./CS | 53 | 56% | 34% | 4% | 7% |
| Natural Sci. | 31 | 57% | 31% | 13% | 0% |
| Math | 7 | 100% | 0% | 0% | 0% |
| Social Sci. | 67 | 50% | 35% | 12% | 3% |
| Humanities | 43 | 53% | 35% | 13% | 0% |
| Education | 39 | 51% | 44% | 1% | 4% |
| Health/Nursing | 20 | 73% | 15% | 12% | 0% |
| Arts/Comm. | 36 | 42% | 46% | 8% | 4% |
| Other | 27 | 64% | 28% | 3% | 4% |
Table A15 | Required course: Natural sciences (biology, chemistry, physics)
“Should colleges require all students to complete at least one course in each of the following areas, regardless of their major?” Item: Natural sciences (biology, chemistry, physics)
| Subgroup | N | Definitely should require | Probably should require | Probably should not require | Definitely should not require |
|---|---|---|---|---|---|
| Overall | 1,000 | 40% | 38% | 16% | 6% |
| Party | |||||
| Democrat | 318 | 42% | 34% | 17% | 8% |
| Independent | 316 | 41% | 39% | 17% | 2% |
| Republican | 279 | 35% | 42% | 16% | 8% |
| Gender | |||||
| Male | 464 | 43% | 38% | 14% | 5% |
| Female | 536 | 37% | 38% | 18% | 7% |
| Age | |||||
| 18-29 | 162 | 37% | 42% | 15% | 6% |
| 30-44 | 287 | 41% | 38% | 13% | 8% |
| 45-64 | 300 | 39% | 37% | 18% | 6% |
| 65+ | 251 | 40% | 38% | 19% | 4% |
| Religion | |||||
| Protestant | 364 | 39% | 41% | 16% | 4% |
| Catholic | 187 | 38% | 37% | 17% | 8% |
| Other Christian | 12 | 59% | 27% | 5% | 10% |
| Jewish | 21 | 47% | 27% | 18% | 8% |
| Other faith | 78 | 26% | 44% | 18% | 12% |
| Atheist/Agnostic | 140 | 50% | 31% | 13% | 5% |
| Nothing in particular | 198 | 39% | 39% | 17% | 5% |
| Income | |||||
| <$50k | 363 | 37% | 37% | 18% | 8% |
| $50-100k | 312 | 38% | 39% | 17% | 6% |
| $100k+ | 243 | 46% | 35% | 14% | 5% |
| College degree | |||||
| Yes | 376 | 48% | 35% | 14% | 3% |
| No | 624 | 35% | 40% | 17% | 8% |
| Child in college | |||||
| Yes | 141 | 44% | 36% | 16% | 4% |
| No | 859 | 39% | 39% | 16% | 6% |
| Student loans | |||||
| Yes | 123 | 49% | 40% | 10% | 1% |
| No | 877 | 38% | 38% | 17% | 7% |
| MAGA | |||||
| MAGA Republican | 196 | 39% | 40% | 14% | 7% |
| Never Trumper | 12 | 77% | 18% | 5% | 0% |
| Neither | 162 | 35% | 42% | 17% | 7% |
| Regrets degree | |||||
| Regrets | 58 | 42% | 37% | 15% | 6% |
| No regret | 318 | 49% | 35% | 14% | 2% |
| College major | |||||
| Bus./Finance | 53 | 44% | 43% | 12% | 0% |
| Eng./CS | 53 | 46% | 32% | 21% | 2% |
| Natural Sci. | 31 | 59% | 28% | 13% | 0% |
| Math | 7 | 69% | 31% | 0% | 0% |
| Social Sci. | 67 | 49% | 32% | 15% | 3% |
| Humanities | 43 | 55% | 30% | 11% | 4% |
| Education | 39 | 50% | 34% | 8% | 8% |
| Health/Nursing | 20 | 67% | 17% | 16% | 0% |
| Arts/Comm. | 36 | 30% | 58% | 10% | 2% |
| Other | 27 | 28% | 38% | 29% | 4% |
Table A16 | Required course: English literature and writing
“Should colleges require all students to complete at least one course in each of the following areas, regardless of their major?” Item: English literature and writing
| Subgroup | N | Definitely should require | Probably should require | Probably should not require | Definitely should not require |
|---|---|---|---|---|---|
| Overall | 1,000 | 52% | 36% | 8% | 4% |
| Party | |||||
| Democrat | 318 | 52% | 36% | 7% | 5% |
| Independent | 316 | 53% | 36% | 10% | 2% |
| Republican | 279 | 49% | 39% | 8% | 4% |
| Gender | |||||
| Male | 464 | 50% | 35% | 9% | 5% |
| Female | 536 | 54% | 36% | 8% | 3% |
| Age | |||||
| 18-29 | 162 | 48% | 40% | 8% | 5% |
| 30-44 | 287 | 48% | 41% | 6% | 5% |
| 45-64 | 300 | 54% | 32% | 10% | 4% |
| 65+ | 251 | 56% | 32% | 9% | 3% |
| Religion | |||||
| Protestant | 364 | 50% | 39% | 8% | 4% |
| Catholic | 187 | 51% | 36% | 10% | 3% |
| Other Christian | 12 | 53% | 33% | 5% | 10% |
| Jewish | 21 | 59% | 25% | 16% | 0% |
| Other faith | 78 | 60% | 27% | 8% | 5% |
| Atheist/Agnostic | 140 | 61% | 28% | 3% | 7% |
| Nothing in particular | 198 | 46% | 40% | 11% | 2% |
| Income | |||||
| <$50k | 363 | 50% | 35% | 11% | 5% |
| $50-100k | 312 | 55% | 35% | 8% | 2% |
| $100k+ | 243 | 54% | 36% | 5% | 5% |
| College degree | |||||
| Yes | 376 | 63% | 32% | 3% | 2% |
| No | 624 | 46% | 38% | 11% | 5% |
| Child in college | |||||
| Yes | 141 | 57% | 33% | 8% | 2% |
| No | 859 | 51% | 36% | 8% | 4% |
| Student loans | |||||
| Yes | 123 | 64% | 29% | 5% | 2% |
| No | 877 | 50% | 37% | 9% | 4% |
| MAGA | |||||
| MAGA Republican | 196 | 53% | 39% | 5% | 3% |
| Never Trumper | 12 | 50% | 38% | 12% | 0% |
| Neither | 162 | 49% | 33% | 12% | 6% |
| Regrets degree | |||||
| Regrets | 58 | 55% | 35% | 6% | 4% |
| No regret | 318 | 64% | 32% | 2% | 1% |
| College major | |||||
| Bus./Finance | 53 | 62% | 36% | 2% | 0% |
| Eng./CS | 53 | 59% | 34% | 2% | 5% |
| Natural Sci. | 31 | 70% | 23% | 7% | 0% |
| Math | 7 | 71% | 29% | 0% | 0% |
| Social Sci. | 67 | 64% | 31% | 3% | 2% |
| Humanities | 43 | 57% | 39% | 4% | 0% |
| Education | 39 | 74% | 23% | 0% | 2% |
| Health/Nursing | 20 | 59% | 38% | 3% | 0% |
| Arts/Comm. | 36 | 63% | 35% | 0% | 2% |
| Other | 27 | 55% | 29% | 12% | 4% |
Table A17 | Required course: American history and government
“Should colleges require all students to complete at least one course in each of the following areas, regardless of their major?” Item: American history and government
| Subgroup | N | Definitely should require | Probably should require | Probably should not require | Definitely should not require |
|---|---|---|---|---|---|
| Overall | 1,000 | 51% | 33% | 11% | 5% |
| Party | |||||
| Democrat | 318 | 46% | 35% | 12% | 6% |
| Independent | 316 | 50% | 33% | 13% | 4% |
| Republican | 279 | 55% | 34% | 7% | 3% |
| Gender | |||||
| Male | 464 | 55% | 28% | 12% | 5% |
| Female | 536 | 47% | 38% | 11% | 5% |
| Age | |||||
| 18-29 | 162 | 37% | 43% | 14% | 6% |
| 30-44 | 287 | 45% | 38% | 11% | 6% |
| 45-64 | 300 | 55% | 29% | 12% | 5% |
| 65+ | 251 | 65% | 23% | 9% | 2% |
| Religion | |||||
| Protestant | 364 | 53% | 32% | 11% | 4% |
| Catholic | 187 | 54% | 31% | 12% | 4% |
| Other Christian | 12 | 59% | 14% | 18% | 10% |
| Jewish | 21 | 52% | 41% | 7% | 0% |
| Other faith | 78 | 38% | 41% | 13% | 8% |
| Atheist/Agnostic | 140 | 60% | 26% | 7% | 7% |
| Nothing in particular | 198 | 42% | 39% | 15% | 5% |
| Income | |||||
| <$50k | 363 | 45% | 32% | 17% | 6% |
| $50-100k | 312 | 53% | 37% | 8% | 2% |
| $100k+ | 243 | 59% | 26% | 9% | 6% |
| College degree | |||||
| Yes | 376 | 59% | 31% | 5% | 4% |
| No | 624 | 46% | 34% | 15% | 5% |
| Child in college | |||||
| Yes | 141 | 50% | 35% | 8% | 6% |
| No | 859 | 51% | 33% | 12% | 4% |
| Student loans | |||||
| Yes | 123 | 53% | 37% | 5% | 5% |
| No | 877 | 51% | 32% | 12% | 5% |
| MAGA | |||||
| MAGA Republican | 196 | 61% | 31% | 6% | 2% |
| Never Trumper | 12 | 72% | 23% | 5% | 0% |
| Neither | 162 | 53% | 32% | 8% | 7% |
| Regrets degree | |||||
| Regrets | 58 | 52% | 32% | 9% | 8% |
| No regret | 318 | 61% | 31% | 5% | 3% |
| College major | |||||
| Bus./Finance | 53 | 56% | 39% | 5% | 0% |
| Eng./CS | 53 | 51% | 37% | 5% | 7% |
| Natural Sci. | 31 | 56% | 36% | 8% | 0% |
| Math | 7 | 56% | 44% | 0% | 0% |
| Social Sci. | 67 | 63% | 24% | 7% | 6% |
| Humanities | 43 | 64% | 32% | 4% | 0% |
| Education | 39 | 67% | 25% | 2% | 6% |
| Health/Nursing | 20 | 61% | 33% | 0% | 6% |
| Arts/Comm. | 36 | 63% | 29% | 5% | 2% |
| Other | 27 | 57% | 24% | 13% | 6% |
Table A18 | Required course: A foreign language
“Should colleges require all students to complete at least one course in each of the following areas, regardless of their major?” Item: A foreign language
| Subgroup | N | Definitely should require | Probably should require | Probably should not require | Definitely should not require |
|---|---|---|---|---|---|
| Overall | 1,000 | 18% | 34% | 31% | 17% |
| Party | |||||
| Democrat | 318 | 26% | 34% | 28% | 13% |
| Independent | 316 | 16% | 35% | 32% | 18% |
| Republican | 279 | 10% | 33% | 36% | 21% |
| Gender | |||||
| Male | 464 | 19% | 34% | 30% | 17% |
| Female | 536 | 16% | 35% | 33% | 16% |
| Age | |||||
| 18-29 | 162 | 25% | 32% | 29% | 14% |
| 30-44 | 287 | 17% | 39% | 27% | 16% |
| 45-64 | 300 | 16% | 31% | 35% | 18% |
| 65+ | 251 | 14% | 34% | 33% | 19% |
| Religion | |||||
| Protestant | 364 | 15% | 32% | 37% | 16% |
| Catholic | 187 | 10% | 41% | 33% | 16% |
| Other Christian | 12 | 0% | 13% | 55% | 32% |
| Jewish | 21 | 54% | 24% | 22% | 0% |
| Other faith | 78 | 17% | 30% | 29% | 24% |
| Atheist/Agnostic | 140 | 36% | 28% | 21% | 15% |
| Nothing in particular | 198 | 15% | 39% | 28% | 18% |
| Income | |||||
| <$50k | 363 | 19% | 31% | 31% | 18% |
| $50-100k | 312 | 16% | 34% | 31% | 19% |
| $100k+ | 243 | 20% | 36% | 30% | 14% |
| College degree | |||||
| Yes | 376 | 23% | 37% | 26% | 13% |
| No | 624 | 14% | 33% | 34% | 19% |
| Child in college | |||||
| Yes | 141 | 15% | 41% | 28% | 15% |
| No | 859 | 18% | 33% | 32% | 17% |
| Student loans | |||||
| Yes | 123 | 29% | 42% | 23% | 5% |
| No | 877 | 16% | 33% | 32% | 18% |
| MAGA | |||||
| MAGA Republican | 196 | 9% | 36% | 34% | 21% |
| Never Trumper | 12 | 12% | 10% | 56% | 23% |
| Neither | 162 | 12% | 29% | 41% | 18% |
| Regrets degree | |||||
| Regrets | 58 | 14% | 45% | 18% | 23% |
| No regret | 318 | 25% | 36% | 28% | 11% |
| College major | |||||
| Bus./Finance | 53 | 17% | 36% | 25% | 22% |
| Eng./CS | 53 | 23% | 27% | 34% | 16% |
| Natural Sci. | 31 | 34% | 28% | 24% | 14% |
| Math | 7 | 0% | 55% | 31% | 14% |
| Social Sci. | 67 | 32% | 27% | 38% | 3% |
| Humanities | 43 | 21% | 51% | 22% | 6% |
| Education | 39 | 21% | 45% | 18% | 16% |
| Health/Nursing | 20 | 37% | 32% | 17% | 14% |
| Arts/Comm. | 36 | 20% | 56% | 18% | 7% |
| Other | 27 | 9% | 40% | 25% | 26% |
Table A19 | Required course: Philosophy, religion, or ethics
“Should colleges require all students to complete at least one course in each of the following areas, regardless of their major?” Item: Philosophy, religion, or ethics
| Subgroup | N | Definitely should require | Probably should require | Probably should not require | Definitely should not require |
|---|---|---|---|---|---|
| Overall | 1,000 | 22% | 40% | 23% | 15% |
| Party | |||||
| Democrat | 318 | 25% | 37% | 22% | 16% |
| Independent | 316 | 20% | 42% | 22% | 16% |
| Republican | 279 | 18% | 43% | 24% | 15% |
| Gender | |||||
| Male | 464 | 24% | 39% | 22% | 15% |
| Female | 536 | 20% | 41% | 24% | 15% |
| Age | |||||
| 18-29 | 162 | 25% | 45% | 19% | 10% |
| 30-44 | 287 | 25% | 35% | 23% | 17% |
| 45-64 | 300 | 20% | 37% | 25% | 19% |
| 65+ | 251 | 19% | 46% | 24% | 12% |
| Religion | |||||
| Protestant | 364 | 20% | 46% | 26% | 9% |
| Catholic | 187 | 19% | 41% | 21% | 18% |
| Other Christian | 12 | 11% | 37% | 34% | 19% |
| Jewish | 21 | 38% | 29% | 33% | 0% |
| Other faith | 78 | 21% | 33% | 20% | 26% |
| Atheist/Agnostic | 140 | 35% | 30% | 14% | 21% |
| Nothing in particular | 198 | 19% | 40% | 27% | 15% |
| Income | |||||
| <$50k | 363 | 19% | 34% | 28% | 18% |
| $50-100k | 312 | 20% | 42% | 23% | 15% |
| $100k+ | 243 | 28% | 43% | 15% | 14% |
| College degree | |||||
| Yes | 376 | 29% | 46% | 15% | 11% |
| No | 624 | 18% | 37% | 28% | 17% |
| Child in college | |||||
| Yes | 141 | 23% | 43% | 22% | 12% |
| No | 859 | 22% | 40% | 23% | 16% |
| Student loans | |||||
| Yes | 123 | 33% | 44% | 21% | 2% |
| No | 877 | 20% | 39% | 23% | 17% |
| MAGA | |||||
| MAGA Republican | 196 | 20% | 43% | 24% | 13% |
| Never Trumper | 12 | 37% | 34% | 19% | 10% |
| Neither | 162 | 18% | 40% | 27% | 15% |
| Regrets degree | |||||
| Regrets | 58 | 26% | 40% | 13% | 20% |
| No regret | 318 | 29% | 47% | 15% | 9% |
| College major | |||||
| Bus./Finance | 53 | 28% | 41% | 27% | 4% |
| Eng./CS | 53 | 16% | 62% | 11% | 11% |
| Natural Sci. | 31 | 35% | 34% | 25% | 6% |
| Math | 7 | 23% | 41% | 22% | 14% |
| Social Sci. | 67 | 37% | 39% | 13% | 11% |
| Humanities | 43 | 42% | 44% | 7% | 7% |
| Education | 39 | 29% | 40% | 8% | 22% |
| Health/Nursing | 20 | 36% | 56% | 8% | 0% |
| Arts/Comm. | 36 | 15% | 67% | 14% | 4% |
| Other | 27 | 23% | 22% | 19% | 37% |
Table A20 | Required course: Race, gender, or diversity studies
“Should colleges require all students to complete at least one course in each of the following areas, regardless of their major?” Item: Race, gender, or diversity studies
| Subgroup | N | Definitely should require | Probably should require | Probably should not require | Definitely should not require |
|---|---|---|---|---|---|
| Overall | 1,000 | 20% | 26% | 24% | 30% |
| Party | |||||
| Democrat | 318 | 36% | 34% | 21% | 9% |
| Independent | 316 | 17% | 27% | 26% | 30% |
| Republican | 279 | 6% | 18% | 22% | 54% |
| Gender | |||||
| Male | 464 | 17% | 24% | 25% | 34% |
| Female | 536 | 23% | 28% | 23% | 27% |
| Age | |||||
| 18-29 | 162 | 25% | 31% | 23% | 22% |
| 30-44 | 287 | 23% | 28% | 21% | 28% |
| 45-64 | 300 | 17% | 21% | 27% | 35% |
| 65+ | 251 | 16% | 27% | 23% | 34% |
| Religion | |||||
| Protestant | 364 | 15% | 26% | 25% | 35% |
| Catholic | 187 | 17% | 25% | 26% | 32% |
| Other Christian | 12 | 5% | 18% | 45% | 32% |
| Jewish | 21 | 44% | 21% | 14% | 20% |
| Other faith | 78 | 23% | 26% | 20% | 31% |
| Atheist/Agnostic | 140 | 38% | 26% | 20% | 17% |
| Nothing in particular | 198 | 18% | 29% | 24% | 30% |
| Income | |||||
| <$50k | 363 | 20% | 30% | 25% | 26% |
| $50-100k | 312 | 21% | 22% | 23% | 35% |
| $100k+ | 243 | 22% | 24% | 25% | 29% |
| College degree | |||||
| Yes | 376 | 27% | 24% | 24% | 25% |
| No | 624 | 16% | 27% | 24% | 33% |
| Child in college | |||||
| Yes | 141 | 22% | 24% | 28% | 26% |
| No | 859 | 20% | 26% | 23% | 31% |
| Student loans | |||||
| Yes | 123 | 34% | 28% | 23% | 14% |
| No | 877 | 18% | 26% | 24% | 32% |
| MAGA | |||||
| MAGA Republican | 196 | 8% | 16% | 19% | 57% |
| Never Trumper | 12 | 12% | 21% | 16% | 51% |
| Neither | 162 | 3% | 17% | 28% | 52% |
| Regrets degree | |||||
| Regrets | 58 | 19% | 17% | 25% | 39% |
| No regret | 318 | 29% | 25% | 24% | 22% |
| College major | |||||
| Bus./Finance | 53 | 14% | 24% | 19% | 43% |
| Eng./CS | 53 | 26% | 21% | 34% | 19% |
| Natural Sci. | 31 | 26% | 30% | 30% | 15% |
| Math | 7 | 0% | 11% | 44% | 45% |
| Social Sci. | 67 | 42% | 27% | 18% | 13% |
| Humanities | 43 | 12% | 35% | 27% | 26% |
| Education | 39 | 34% | 16% | 28% | 22% |
| Health/Nursing | 20 | 54% | 13% | 14% | 19% |
| Arts/Comm. | 36 | 22% | 26% | 21% | 31% |
| Other | 27 | 20% | 20% | 24% | 35% |
Table A21 | Department: Mathematics
“How important is it for a typical university to maintain a department in each of the following fields?” Item: Mathematics
| Subgroup | N | Essential — a university should always have this department | Important, but could be cut if necessary | Not very important | This department should be cut |
|---|---|---|---|---|---|
| Overall | 1,000 | 83% | 14% | 3% | 0% |
| Party | |||||
| Democrat | 318 | 82% | 15% | 3% | 1% |
| Independent | 316 | 85% | 12% | 3% | 0% |
| Republican | 279 | 82% | 16% | 2% | 0% |
| Gender | |||||
| Male | 464 | 83% | 15% | 2% | 0% |
| Female | 536 | 82% | 14% | 3% | 1% |
| Age | |||||
| 18-29 | 162 | 82% | 14% | 3% | 1% |
| 30-44 | 287 | 80% | 17% | 3% | 0% |
| 45-64 | 300 | 83% | 15% | 2% | 1% |
| 65+ | 251 | 87% | 12% | 1% | 0% |
| Religion | |||||
| Protestant | 364 | 81% | 16% | 3% | 0% |
| Catholic | 187 | 83% | 16% | 1% | 0% |
| Other Christian | 12 | 92% | 3% | 5% | 0% |
| Jewish | 21 | 92% | 8% | 0% | 0% |
| Other faith | 78 | 75% | 19% | 5% | 0% |
| Atheist/Agnostic | 140 | 92% | 8% | 0% | 0% |
| Nothing in particular | 198 | 81% | 14% | 4% | 1% |
| Income | |||||
| <$50k | 363 | 79% | 16% | 4% | 1% |
| $50-100k | 312 | 83% | 15% | 2% | 0% |
| $100k+ | 243 | 85% | 13% | 1% | 0% |
| College degree | |||||
| Yes | 376 | 88% | 11% | 1% | 0% |
| No | 624 | 79% | 17% | 3% | 1% |
| Child in college | |||||
| Yes | 141 | 84% | 14% | 2% | 0% |
| No | 859 | 82% | 14% | 3% | 0% |
| Student loans | |||||
| Yes | 123 | 89% | 10% | 1% | 1% |
| No | 877 | 82% | 15% | 3% | 0% |
| MAGA | |||||
| MAGA Republican | 196 | 85% | 13% | 2% | 0% |
| Never Trumper | 12 | 80% | 15% | 5% | 0% |
| Neither | 162 | 81% | 16% | 3% | 0% |
| Regrets degree | |||||
| Regrets | 58 | 83% | 17% | 0% | 0% |
| No regret | 318 | 89% | 9% | 1% | 0% |
| College major | |||||
| Bus./Finance | 53 | 82% | 16% | 2% | 0% |
| Eng./CS | 53 | 89% | 11% | 0% | 0% |
| Natural Sci. | 31 | 100% | 0% | 0% | 0% |
| Math | 7 | 100% | 0% | 0% | 0% |
| Social Sci. | 67 | 85% | 14% | 0% | 1% |
| Humanities | 43 | 87% | 11% | 2% | 0% |
| Education | 39 | 85% | 13% | 2% | 0% |
| Health/Nursing | 20 | 94% | 6% | 0% | 0% |
| Arts/Comm. | 36 | 91% | 8% | 1% | 0% |
| Other | 27 | 88% | 7% | 5% | 0% |
Table A22 | Department: Biology
“How important is it for a typical university to maintain a department in each of the following fields?” Item: Biology
| Subgroup | N | Essential — a university should always have this department | Important, but could be cut if necessary | Not very important | This department should be cut |
|---|---|---|---|---|---|
| Overall | 1,000 | 71% | 24% | 4% | 1% |
| Party | |||||
| Democrat | 318 | 72% | 22% | 5% | 0% |
| Independent | 316 | 72% | 22% | 5% | 1% |
| Republican | 279 | 68% | 27% | 3% | 1% |
| Gender | |||||
| Male | 464 | 72% | 24% | 3% | 1% |
| Female | 536 | 70% | 24% | 5% | 1% |
| Age | |||||
| 18-29 | 162 | 75% | 18% | 5% | 1% |
| 30-44 | 287 | 73% | 22% | 4% | 1% |
| 45-64 | 300 | 70% | 25% | 4% | 1% |
| 65+ | 251 | 67% | 28% | 5% | 0% |
| Religion | |||||
| Protestant | 364 | 71% | 25% | 4% | 0% |
| Catholic | 187 | 67% | 24% | 8% | 2% |
| Other Christian | 12 | 84% | 11% | 5% | 0% |
| Jewish | 21 | 80% | 20% | 0% | 0% |
| Other faith | 78 | 56% | 37% | 4% | 2% |
| Atheist/Agnostic | 140 | 80% | 19% | 1% | 0% |
| Nothing in particular | 198 | 74% | 21% | 4% | 0% |
| Income | |||||
| <$50k | 363 | 67% | 27% | 5% | 1% |
| $50-100k | 312 | 69% | 26% | 4% | 1% |
| $100k+ | 243 | 75% | 20% | 4% | 1% |
| College degree | |||||
| Yes | 376 | 80% | 17% | 2% | 0% |
| No | 624 | 66% | 27% | 6% | 1% |
| Child in college | |||||
| Yes | 141 | 75% | 23% | 1% | 1% |
| No | 859 | 71% | 24% | 5% | 1% |
| Student loans | |||||
| Yes | 123 | 80% | 18% | 2% | 0% |
| No | 877 | 70% | 24% | 5% | 1% |
| MAGA | |||||
| MAGA Republican | 196 | 71% | 25% | 3% | 1% |
| Never Trumper | 12 | 64% | 31% | 5% | 0% |
| Neither | 162 | 68% | 28% | 4% | 0% |
| Regrets degree | |||||
| Regrets | 58 | 75% | 25% | 0% | 0% |
| No regret | 318 | 81% | 16% | 2% | 0% |
| College major | |||||
| Bus./Finance | 53 | 72% | 26% | 2% | 0% |
| Eng./CS | 53 | 82% | 14% | 4% | 0% |
| Natural Sci. | 31 | 97% | 3% | 0% | 0% |
| Math | 7 | 100% | 0% | 0% | 0% |
| Social Sci. | 67 | 80% | 17% | 2% | 1% |
| Humanities | 43 | 85% | 15% | 0% | 0% |
| Education | 39 | 69% | 31% | 0% | 0% |
| Health/Nursing | 20 | 83% | 5% | 12% | 0% |
| Arts/Comm. | 36 | 84% | 16% | 0% | 0% |
| Other | 27 | 75% | 25% | 0% | 0% |
Table A23 | Department: English
“How important is it for a typical university to maintain a department in each of the following fields?” Item: English
| Subgroup | N | Essential — a university should always have this department | Important, but could be cut if necessary | Not very important | This department should be cut |
|---|---|---|---|---|---|
| Overall | 1,000 | 86% | 11% | 3% | 1% |
| Party | |||||
| Democrat | 318 | 86% | 12% | 2% | 1% |
| Independent | 316 | 85% | 12% | 4% | 0% |
| Republican | 279 | 88% | 9% | 2% | 1% |
| Gender | |||||
| Male | 464 | 83% | 12% | 4% | 1% |
| Female | 536 | 88% | 10% | 1% | 0% |
| Age | |||||
| 18-29 | 162 | 86% | 11% | 2% | 0% |
| 30-44 | 287 | 80% | 16% | 3% | 1% |
| 45-64 | 300 | 86% | 10% | 3% | 0% |
| 65+ | 251 | 91% | 8% | 1% | 1% |
| Religion | |||||
| Protestant | 364 | 86% | 10% | 3% | 0% |
| Catholic | 187 | 84% | 12% | 3% | 2% |
| Other Christian | 12 | 84% | 11% | 5% | 0% |
| Jewish | 21 | 83% | 11% | 5% | 0% |
| Other faith | 78 | 89% | 11% | 0% | 0% |
| Atheist/Agnostic | 140 | 86% | 11% | 2% | 1% |
| Nothing in particular | 198 | 85% | 13% | 2% | 0% |
| Income | |||||
| <$50k | 363 | 86% | 10% | 3% | 1% |
| $50-100k | 312 | 84% | 13% | 3% | 0% |
| $100k+ | 243 | 85% | 11% | 3% | 1% |
| College degree | |||||
| Yes | 376 | 87% | 11% | 1% | 0% |
| No | 624 | 85% | 11% | 3% | 1% |
| Child in college | |||||
| Yes | 141 | 87% | 13% | 1% | 0% |
| No | 859 | 85% | 11% | 3% | 1% |
| Student loans | |||||
| Yes | 123 | 94% | 5% | 1% | 1% |
| No | 877 | 84% | 12% | 3% | 1% |
| MAGA | |||||
| MAGA Republican | 196 | 88% | 9% | 1% | 1% |
| Never Trumper | 12 | 66% | 15% | 20% | 0% |
| Neither | 162 | 88% | 9% | 3% | 0% |
| Regrets degree | |||||
| Regrets | 58 | 74% | 21% | 5% | 0% |
| No regret | 318 | 90% | 9% | 1% | 0% |
| College major | |||||
| Bus./Finance | 53 | 79% | 21% | 0% | 0% |
| Eng./CS | 53 | 86% | 9% | 5% | 0% |
| Natural Sci. | 31 | 95% | 5% | 0% | 0% |
| Math | 7 | 100% | 0% | 0% | 0% |
| Social Sci. | 67 | 89% | 8% | 2% | 1% |
| Humanities | 43 | 81% | 17% | 3% | 0% |
| Education | 39 | 94% | 6% | 0% | 0% |
| Health/Nursing | 20 | 85% | 15% | 0% | 0% |
| Arts/Comm. | 36 | 91% | 9% | 0% | 0% |
| Other | 27 | 93% | 5% | 2% | 0% |
Table A24 | Department: History
“How important is it for a typical university to maintain a department in each of the following fields?” Item: History (rotating item, asked of a random subset)
| Subgroup | N | Essential — a university should always have this department | Important, but could be cut if necessary | Not very important | This department should be cut |
|---|---|---|---|---|---|
| Overall | 420 | 73% | 23% | 4% | 0% |
| Party | |||||
| Democrat | 146 | 68% | 24% | 8% | 1% |
| Independent | 112 | 75% | 22% | 4% | 0% |
| Republican | 122 | 78% | 22% | 1% | 0% |
| Gender | |||||
| Male | 188 | 73% | 24% | 3% | 0% |
| Female | 232 | 73% | 23% | 4% | 0% |
| Age | |||||
| 18-29 | 64 | 65% | 25% | 9% | 1% |
| 30-44 | 108 | 71% | 26% | 3% | 0% |
| 45-64 | 129 | 80% | 18% | 2% | 1% |
| 65+ | 119 | 73% | 25% | 2% | 0% |
| Religion | |||||
| Protestant | 148 | 74% | 25% | 1% | 0% |
| Catholic | 80 | 86% | 11% | 3% | 1% |
| Other Christian | 4 | 100% | 0% | 0% | 0% |
| Jewish | 10 | 67% | 22% | 11% | 0% |
| Other faith | 36 | 35% | 55% | 9% | 2% |
| Atheist/Agnostic | 60 | 77% | 16% | 7% | 0% |
| Nothing in particular | 82 | 72% | 24% | 4% | 0% |
| Income | |||||
| <$50k | 154 | 68% | 25% | 6% | 0% |
| $50-100k | 138 | 79% | 19% | 2% | 0% |
| $100k+ | 95 | 74% | 23% | 3% | 1% |
| College degree | |||||
| Yes | 161 | 73% | 22% | 5% | 0% |
| No | 259 | 73% | 24% | 3% | 0% |
| Child in college | |||||
| Yes | 55 | 68% | 28% | 4% | 0% |
| No | 365 | 74% | 22% | 4% | 0% |
| Student loans | |||||
| Yes | 50 | 84% | 14% | 2% | 0% |
| No | 370 | 71% | 24% | 4% | 0% |
| MAGA | |||||
| MAGA Republican | 75 | 86% | 14% | 0% | 0% |
| Never Trumper | 5 | 49% | 51% | 0% | 0% |
| Neither | 76 | 75% | 24% | 1% | 0% |
| Regrets degree | |||||
| Regrets | 25 | 66% | 30% | 3% | 0% |
| No regret | 136 | 75% | 20% | 5% | 1% |
| College major | |||||
| Bus./Finance | 27 | 61% | 37% | 3% | 0% |
| Eng./CS | 18 | 48% | 47% | 5% | 0% |
| Natural Sci. | 15 | 84% | 16% | 0% | 0% |
| Math | 2 | 50% | 50% | 0% | 0% |
| Social Sci. | 31 | 87% | 7% | 3% | 2% |
| Humanities | 15 | 85% | 15% | 0% | 0% |
| Education | 16 | 80% | 9% | 10% | 0% |
| Health/Nursing | 8 | 54% | 23% | 23% | 0% |
| Arts/Comm. | 19 | 100% | 0% | 0% | 0% |
| Other | 10 | 62% | 38% | 0% | 0% |
Table A25 | Department: Chemistry
“How important is it for a typical university to maintain a department in each of the following fields?” Item: Chemistry (rotating item, asked of a random subset)
| Subgroup | N | Essential — a university should always have this department | Important, but could be cut if necessary | Not very important | This department should be cut |
|---|---|---|---|---|---|
| Overall | 407 | 69% | 24% | 6% | 1% |
| Party | |||||
| Democrat | 126 | 72% | 22% | 6% | 0% |
| Independent | 119 | 70% | 24% | 6% | 1% |
| Republican | 125 | 66% | 28% | 6% | 1% |
| Gender | |||||
| Male | 200 | 76% | 20% | 3% | 0% |
| Female | 207 | 62% | 29% | 8% | 1% |
| Age | |||||
| 18-29 | 62 | 67% | 24% | 9% | 0% |
| 30-44 | 113 | 72% | 24% | 3% | 1% |
| 45-64 | 125 | 70% | 21% | 7% | 1% |
| 65+ | 107 | 68% | 29% | 3% | 0% |
| Religion | |||||
| Protestant | 152 | 66% | 28% | 6% | 1% |
| Catholic | 78 | 78% | 18% | 4% | 0% |
| Other Christian | 7 | 82% | 18% | 0% | 0% |
| Jewish | 11 | 87% | 6% | 7% | 0% |
| Other faith | 28 | 50% | 28% | 22% | 0% |
| Atheist/Agnostic | 49 | 75% | 21% | 4% | 0% |
| Nothing in particular | 82 | 67% | 28% | 3% | 2% |
| Income | |||||
| <$50k | 162 | 63% | 29% | 7% | 1% |
| $50-100k | 124 | 73% | 18% | 8% | 0% |
| $100k+ | 93 | 74% | 25% | 1% | 0% |
| College degree | |||||
| Yes | 144 | 75% | 21% | 4% | 0% |
| No | 263 | 67% | 26% | 6% | 1% |
| Child in college | |||||
| Yes | 56 | 70% | 24% | 4% | 2% |
| No | 351 | 69% | 24% | 6% | 0% |
| Student loans | |||||
| Yes | 47 | 78% | 15% | 7% | 0% |
| No | 360 | 68% | 26% | 6% | 1% |
| MAGA | |||||
| MAGA Republican | 88 | 74% | 22% | 4% | 1% |
| Never Trumper | 6 | 60% | 40% | 0% | 0% |
| Neither | 63 | 55% | 36% | 9% | 0% |
| Regrets degree | |||||
| Regrets | 24 | 71% | 26% | 2% | 0% |
| No regret | 120 | 75% | 20% | 5% | 0% |
| College major | |||||
| Bus./Finance | 24 | 79% | 18% | 3% | 0% |
| Eng./CS | 18 | 78% | 22% | 0% | 0% |
| Natural Sci. | 11 | 100% | 0% | 0% | 0% |
| Math | 3 | 100% | 0% | 0% | 0% |
| Social Sci. | 26 | 75% | 25% | 0% | 0% |
| Humanities | 16 | 81% | 19% | 0% | 0% |
| Education | 18 | 57% | 34% | 9% | 0% |
| Health/Nursing | 6 | 43% | 17% | 40% | 0% |
| Arts/Comm. | 12 | 77% | 18% | 5% | 0% |
| Other | 10 | 64% | 36% | 0% | 0% |
Table A26 | Department: Physics
“How important is it for a typical university to maintain a department in each of the following fields?” Item: Physics (rotating item, asked of a random subset)
| Subgroup | N | Essential — a university should always have this department | Important, but could be cut if necessary | Not very important | This department should be cut |
|---|---|---|---|---|---|
| Overall | 420 | 66% | 29% | 5% | 1% |
| Party | |||||
| Democrat | 136 | 64% | 29% | 6% | 1% |
| Independent | 146 | 74% | 22% | 4% | 0% |
| Republican | 105 | 51% | 43% | 6% | 1% |
| Gender | |||||
| Male | 195 | 70% | 28% | 1% | 0% |
| Female | 225 | 62% | 30% | 8% | 1% |
| Age | |||||
| 18-29 | 64 | 66% | 26% | 8% | 1% |
| 30-44 | 131 | 69% | 27% | 3% | 1% |
| 45-64 | 117 | 66% | 30% | 4% | 0% |
| 65+ | 108 | 61% | 33% | 6% | 0% |
| Religion | |||||
| Protestant | 146 | 66% | 28% | 5% | 1% |
| Catholic | 78 | 56% | 37% | 7% | 1% |
| Other Christian | 3 | 100% | 0% | 0% | 0% |
| Jewish | 11 | 63% | 37% | 0% | 0% |
| Other faith | 25 | 82% | 16% | 2% | 0% |
| Atheist/Agnostic | 63 | 73% | 25% | 2% | 0% |
| Nothing in particular | 94 | 64% | 30% | 5% | 1% |
| Income | |||||
| <$50k | 148 | 67% | 25% | 7% | 0% |
| $50-100k | 126 | 66% | 28% | 4% | 1% |
| $100k+ | 107 | 63% | 35% | 2% | 0% |
| College degree | |||||
| Yes | 171 | 70% | 27% | 2% | 1% |
| No | 249 | 63% | 30% | 6% | 0% |
| Child in college | |||||
| Yes | 75 | 67% | 31% | 2% | 0% |
| No | 345 | 66% | 28% | 5% | 1% |
| Student loans | |||||
| Yes | 51 | 70% | 27% | 3% | 0% |
| No | 369 | 65% | 29% | 5% | 1% |
| MAGA | |||||
| MAGA Republican | 72 | 56% | 40% | 3% | 1% |
| Never Trumper | 3 | 53% | 47% | 0% | 0% |
| Neither | 67 | 56% | 37% | 6% | 0% |
| Regrets degree | |||||
| Regrets | 31 | 67% | 30% | 3% | 0% |
| No regret | 140 | 70% | 26% | 2% | 1% |
| College major | |||||
| Bus./Finance | 26 | 59% | 37% | 0% | 3% |
| Eng./CS | 26 | 78% | 19% | 3% | 0% |
| Natural Sci. | 13 | 89% | 11% | 0% | 0% |
| Math | 4 | 100% | 0% | 0% | 0% |
| Social Sci. | 31 | 69% | 25% | 3% | 3% |
| Humanities | 18 | 90% | 10% | 0% | 0% |
| Education | 16 | 70% | 30% | 0% | 0% |
| Health/Nursing | 8 | 53% | 25% | 22% | 0% |
| Arts/Comm. | 18 | 72% | 28% | 0% | 0% |
| Other | 11 | 33% | 67% | 0% | 0% |
Table A27 | Department: Foreign languages
“How important is it for a typical university to maintain a department in each of the following fields?” Item: Foreign languages (rotating item, asked of a random subset)
| Subgroup | N | Essential — a university should always have this department | Important, but could be cut if necessary | Not very important | This department should be cut |
|---|---|---|---|---|---|
| Overall | 439 | 42% | 37% | 16% | 5% |
| Party | |||||
| Democrat | 136 | 51% | 34% | 12% | 4% |
| Independent | 146 | 35% | 44% | 19% | 2% |
| Republican | 120 | 39% | 37% | 17% | 7% |
| Gender | |||||
| Male | 208 | 48% | 34% | 15% | 3% |
| Female | 231 | 37% | 40% | 17% | 6% |
| Age | |||||
| 18-29 | 74 | 51% | 37% | 12% | 0% |
| 30-44 | 125 | 47% | 33% | 16% | 4% |
| 45-64 | 139 | 43% | 36% | 14% | 7% |
| 65+ | 101 | 28% | 44% | 23% | 5% |
| Religion | |||||
| Protestant | 158 | 44% | 34% | 20% | 3% |
| Catholic | 81 | 38% | 35% | 15% | 12% |
| Other Christian | 2 | 0% | 0% | 100% | 0% |
| Jewish | 7 | 39% | 44% | 16% | 0% |
| Other faith | 35 | 30% | 53% | 13% | 4% |
| Atheist/Agnostic | 65 | 54% | 38% | 3% | 5% |
| Nothing in particular | 91 | 43% | 39% | 16% | 2% |
| Income | |||||
| <$50k | 142 | 43% | 36% | 15% | 6% |
| $50-100k | 152 | 37% | 42% | 18% | 2% |
| $100k+ | 109 | 48% | 31% | 15% | 7% |
| College degree | |||||
| Yes | 161 | 48% | 40% | 11% | 1% |
| No | 278 | 39% | 35% | 18% | 7% |
| Child in college | |||||
| Yes | 62 | 46% | 41% | 10% | 2% |
| No | 377 | 42% | 36% | 17% | 5% |
| Student loans | |||||
| Yes | 51 | 47% | 40% | 10% | 2% |
| No | 388 | 42% | 36% | 17% | 5% |
| MAGA | |||||
| MAGA Republican | 92 | 32% | 41% | 20% | 7% |
| Never Trumper | 4 | 16% | 21% | 62% | 0% |
| Neither | 68 | 45% | 34% | 16% | 5% |
| Regrets degree | |||||
| Regrets | 25 | 56% | 27% | 14% | 3% |
| No regret | 136 | 47% | 42% | 11% | 0% |
| College major | |||||
| Bus./Finance | 25 | 45% | 23% | 30% | 2% |
| Eng./CS | 25 | 41% | 47% | 12% | 0% |
| Natural Sci. | 15 | 66% | 28% | 5% | 0% |
| Math | 3 | 100% | 0% | 0% | 0% |
| Social Sci. | 29 | 49% | 48% | 3% | 0% |
| Humanities | 10 | 74% | 26% | 0% | 0% |
| Education | 19 | 35% | 46% | 14% | 5% |
| Health/Nursing | 8 | 18% | 68% | 14% | 0% |
| Arts/Comm. | 16 | 59% | 41% | 0% | 0% |
| Other | 11 | 51% | 38% | 11% | 0% |
Table A28 | Department: Philosophy
“How important is it for a typical university to maintain a department in each of the following fields?” Item: Philosophy (rotating item, asked of a random subset)
| Subgroup | N | Essential — a university should always have this department | Important, but could be cut if necessary | Not very important | This department should be cut |
|---|---|---|---|---|---|
| Overall | 425 | 34% | 45% | 17% | 4% |
| Party | |||||
| Democrat | 121 | 49% | 42% | 7% | 1% |
| Independent | 142 | 30% | 44% | 21% | 5% |
| Republican | 120 | 22% | 50% | 22% | 6% |
| Gender | |||||
| Male | 199 | 35% | 43% | 17% | 5% |
| Female | 226 | 33% | 46% | 17% | 4% |
| Age | |||||
| 18-29 | 67 | 39% | 46% | 12% | 3% |
| 30-44 | 119 | 39% | 42% | 17% | 3% |
| 45-64 | 129 | 32% | 41% | 21% | 7% |
| 65+ | 110 | 28% | 52% | 16% | 4% |
| Religion | |||||
| Protestant | 158 | 34% | 40% | 20% | 6% |
| Catholic | 81 | 27% | 57% | 12% | 4% |
| Other Christian | 6 | 26% | 38% | 36% | 0% |
| Jewish | 13 | 62% | 33% | 5% | 0% |
| Other faith | 33 | 38% | 40% | 22% | 0% |
| Atheist/Agnostic | 59 | 47% | 41% | 6% | 6% |
| Nothing in particular | 75 | 26% | 48% | 23% | 3% |
| Income | |||||
| <$50k | 137 | 37% | 39% | 18% | 6% |
| $50-100k | 127 | 31% | 43% | 21% | 5% |
| $100k+ | 113 | 35% | 51% | 13% | 2% |
| College degree | |||||
| Yes | 152 | 41% | 44% | 14% | 2% |
| No | 273 | 30% | 45% | 19% | 6% |
| Child in college | |||||
| Yes | 60 | 33% | 49% | 15% | 4% |
| No | 365 | 34% | 44% | 17% | 4% |
| Student loans | |||||
| Yes | 43 | 67% | 20% | 13% | 0% |
| No | 382 | 30% | 48% | 18% | 5% |
| MAGA | |||||
| MAGA Republican | 88 | 20% | 51% | 26% | 3% |
| Never Trumper | 6 | 0% | 75% | 11% | 14% |
| Neither | 73 | 25% | 43% | 23% | 10% |
| Regrets degree | |||||
| Regrets | 20 | 23% | 40% | 33% | 4% |
| No regret | 132 | 44% | 44% | 11% | 1% |
| College major | |||||
| Bus./Finance | 23 | 29% | 45% | 26% | 0% |
| Eng./CS | 20 | 32% | 61% | 8% | 0% |
| Natural Sci. | 15 | 33% | 62% | 5% | 0% |
| Math | 2 | 0% | 100% | 0% | 0% |
| Social Sci. | 22 | 48% | 30% | 22% | 0% |
| Humanities | 17 | 78% | 22% | 0% | 0% |
| Education | 15 | 33% | 40% | 21% | 6% |
| Health/Nursing | 10 | 47% | 49% | 5% | 0% |
| Arts/Comm. | 16 | 59% | 33% | 8% | 0% |
| Other | 12 | 16% | 45% | 25% | 14% |
Table A29 | Department: Economics
“How important is it for a typical university to maintain a department in each of the following fields?” Item: Economics (rotating item, asked of a random subset)
| Subgroup | N | Essential — a university should always have this department | Important, but could be cut if necessary | Not very important | This department should be cut |
|---|---|---|---|---|---|
| Overall | 429 | 72% | 25% | 3% | 0% |
| Party | |||||
| Democrat | 143 | 75% | 24% | 1% | 0% |
| Independent | 134 | 70% | 27% | 3% | 0% |
| Republican | 109 | 73% | 24% | 3% | 0% |
| Gender | |||||
| Male | 194 | 69% | 27% | 4% | 0% |
| Female | 235 | 74% | 24% | 2% | 0% |
| Age | |||||
| 18-29 | 65 | 69% | 27% | 4% | 0% |
| 30-44 | 130 | 73% | 25% | 2% | 0% |
| 45-64 | 126 | 76% | 21% | 3% | 0% |
| 65+ | 108 | 68% | 30% | 2% | 0% |
| Religion | |||||
| Protestant | 152 | 68% | 28% | 4% | 0% |
| Catholic | 76 | 74% | 21% | 5% | 0% |
| Other Christian | 4 | 81% | 0% | 19% | 0% |
| Jewish | 10 | 100% | 0% | 0% | 0% |
| Other faith | 41 | 68% | 30% | 3% | 0% |
| Atheist/Agnostic | 59 | 77% | 23% | 0% | 0% |
| Nothing in particular | 87 | 72% | 27% | 1% | 0% |
| Income | |||||
| <$50k | 163 | 66% | 29% | 5% | 0% |
| $50-100k | 129 | 77% | 21% | 2% | 0% |
| $100k+ | 98 | 75% | 25% | 0% | 0% |
| College degree | |||||
| Yes | 161 | 75% | 24% | 0% | 0% |
| No | 268 | 70% | 26% | 4% | 0% |
| Child in college | |||||
| Yes | 64 | 67% | 31% | 2% | 0% |
| No | 365 | 73% | 24% | 3% | 0% |
| Student loans | |||||
| Yes | 47 | 78% | 20% | 2% | 0% |
| No | 382 | 71% | 26% | 3% | 0% |
| MAGA | |||||
| MAGA Republican | 76 | 82% | 15% | 3% | 0% |
| Never Trumper | 4 | 86% | 0% | 14% | 0% |
| Neither | 73 | 59% | 34% | 7% | 0% |
| Regrets degree | |||||
| Regrets | 22 | 73% | 27% | 0% | 0% |
| No regret | 139 | 76% | 24% | 1% | 0% |
| College major | |||||
| Bus./Finance | 19 | 64% | 36% | 0% | 0% |
| Eng./CS | 27 | 78% | 22% | 0% | 0% |
| Natural Sci. | 11 | 92% | 8% | 0% | 0% |
| Math | 3 | 100% | 0% | 0% | 0% |
| Social Sci. | 28 | 74% | 26% | 0% | 0% |
| Humanities | 21 | 74% | 26% | 0% | 0% |
| Education | 15 | 67% | 33% | 0% | 0% |
| Health/Nursing | 8 | 87% | 5% | 8% | 0% |
| Arts/Comm. | 18 | 68% | 32% | 0% | 0% |
| Other | 11 | 86% | 14% | 0% | 0% |
Table A30 | Department: Computer science
“How important is it for a typical university to maintain a department in each of the following fields?” Item: Computer science (rotating item, asked of a random subset)
| Subgroup | N | Essential — a university should always have this department | Important, but could be cut if necessary | Not very important | This department should be cut |
|---|---|---|---|---|---|
| Overall | 431 | 71% | 25% | 4% | 0% |
| Party | |||||
| Democrat | 125 | 76% | 23% | 1% | 0% |
| Independent | 141 | 65% | 30% | 5% | 0% |
| Republican | 124 | 75% | 20% | 4% | 1% |
| Gender | |||||
| Male | 197 | 71% | 26% | 2% | 0% |
| Female | 234 | 72% | 23% | 5% | 0% |
| Age | |||||
| 18-29 | 67 | 76% | 15% | 9% | 0% |
| 30-44 | 123 | 68% | 27% | 5% | 0% |
| 45-64 | 135 | 70% | 27% | 2% | 1% |
| 65+ | 106 | 74% | 26% | 0% | 0% |
| Religion | |||||
| Protestant | 168 | 66% | 29% | 4% | 0% |
| Catholic | 76 | 72% | 25% | 3% | 0% |
| Other Christian | 8 | 94% | 0% | 6% | 0% |
| Jewish | 7 | 78% | 22% | 0% | 0% |
| Other faith | 34 | 68% | 20% | 12% | 0% |
| Atheist/Agnostic | 64 | 83% | 17% | 0% | 0% |
| Nothing in particular | 74 | 72% | 26% | 3% | 0% |
| Income | |||||
| <$50k | 168 | 63% | 34% | 2% | 0% |
| $50-100k | 132 | 74% | 21% | 5% | 0% |
| $100k+ | 103 | 80% | 17% | 3% | 0% |
| College degree | |||||
| Yes | 161 | 77% | 21% | 2% | 0% |
| No | 270 | 68% | 27% | 5% | 0% |
| Child in college | |||||
| Yes | 63 | 81% | 19% | 1% | 0% |
| No | 368 | 70% | 26% | 4% | 0% |
| Student loans | |||||
| Yes | 60 | 81% | 18% | 2% | 0% |
| No | 371 | 70% | 26% | 4% | 0% |
| MAGA | |||||
| MAGA Republican | 86 | 76% | 20% | 3% | 1% |
| Never Trumper | 7 | 66% | 26% | 8% | 0% |
| Neither | 71 | 69% | 27% | 4% | 0% |
| Regrets degree | |||||
| Regrets | 25 | 65% | 35% | 0% | 0% |
| No regret | 136 | 79% | 18% | 3% | 0% |
| College major | |||||
| Bus./Finance | 23 | 76% | 24% | 0% | 0% |
| Eng./CS | 17 | 66% | 34% | 0% | 0% |
| Natural Sci. | 15 | 89% | 11% | 0% | 0% |
| Math | 3 | 74% | 26% | 0% | 0% |
| Social Sci. | 26 | 76% | 24% | 0% | 0% |
| Humanities | 22 | 78% | 22% | 0% | 0% |
| Education | 16 | 86% | 14% | 0% | 0% |
| Health/Nursing | 10 | 65% | 9% | 27% | 0% |
| Arts/Comm. | 15 | 82% | 18% | 0% | 0% |
| Other | 14 | 75% | 25% | 0% | 0% |
Table A31 | Department: Political science
“How important is it for a typical university to maintain a department in each of the following fields?” Item: Political science (rotating item, asked of a random subset)
| Subgroup | N | Essential — a university should always have this department | Important, but could be cut if necessary | Not very important | This department should be cut |
|---|---|---|---|---|---|
| Overall | 398 | 44% | 40% | 13% | 2% |
| Party | |||||
| Democrat | 126 | 55% | 40% | 5% | 1% |
| Independent | 117 | 40% | 45% | 12% | 3% |
| Republican | 120 | 39% | 37% | 23% | 2% |
| Gender | |||||
| Male | 176 | 40% | 43% | 14% | 3% |
| Female | 222 | 48% | 38% | 13% | 1% |
| Age | |||||
| 18-29 | 64 | 40% | 45% | 13% | 1% |
| 30-44 | 120 | 43% | 39% | 16% | 2% |
| 45-64 | 113 | 50% | 37% | 10% | 2% |
| 65+ | 101 | 43% | 42% | 15% | 1% |
| Religion | |||||
| Protestant | 153 | 42% | 42% | 15% | 1% |
| Catholic | 66 | 45% | 42% | 11% | 1% |
| Other Christian | 5 | 24% | 29% | 24% | 24% |
| Jewish | 6 | 34% | 52% | 14% | 0% |
| Other faith | 37 | 36% | 39% | 21% | 4% |
| Atheist/Agnostic | 61 | 59% | 27% | 9% | 4% |
| Nothing in particular | 70 | 43% | 46% | 10% | 0% |
| Income | |||||
| <$50k | 143 | 47% | 34% | 13% | 5% |
| $50-100k | 126 | 41% | 42% | 18% | 0% |
| $100k+ | 92 | 42% | 50% | 8% | 0% |
| College degree | |||||
| Yes | 151 | 49% | 43% | 8% | 0% |
| No | 247 | 41% | 38% | 17% | 3% |
| Child in college | |||||
| Yes | 58 | 55% | 37% | 7% | 0% |
| No | 340 | 42% | 41% | 15% | 2% |
| Student loans | |||||
| Yes | 56 | 56% | 39% | 5% | 0% |
| No | 342 | 43% | 40% | 15% | 2% |
| MAGA | |||||
| MAGA Republican | 81 | 45% | 37% | 18% | 0% |
| Never Trumper | 5 | 34% | 39% | 28% | 0% |
| Neither | 75 | 28% | 45% | 23% | 5% |
| Regrets degree | |||||
| Regrets | 28 | 38% | 59% | 3% | 0% |
| No regret | 123 | 52% | 39% | 9% | 0% |
| College major | |||||
| Bus./Finance | 23 | 30% | 63% | 7% | 0% |
| Eng./CS | 23 | 60% | 31% | 9% | 0% |
| Natural Sci. | 10 | 47% | 53% | 0% | 0% |
| Math | 4 | 19% | 81% | 0% | 0% |
| Social Sci. | 23 | 61% | 39% | 0% | 0% |
| Humanities | 23 | 49% | 51% | 0% | 0% |
| Education | 14 | 47% | 38% | 15% | 0% |
| Health/Nursing | 8 | 40% | 60% | 0% | 0% |
| Arts/Comm. | 12 | 70% | 21% | 9% | 0% |
| Other | 11 | 51% | 9% | 40% | 0% |
Table A32 | Department: Sociology
“How important is it for a typical university to maintain a department in each of the following fields?” Item: Sociology (rotating item, asked of a random subset)
| Subgroup | N | Essential — a university should always have this department | Important, but could be cut if necessary | Not very important | This department should be cut |
|---|---|---|---|---|---|
| Overall | 380 | 45% | 41% | 11% | 2% |
| Party | |||||
| Democrat | 129 | 66% | 28% | 5% | 1% |
| Independent | 124 | 38% | 42% | 16% | 4% |
| Republican | 102 | 32% | 54% | 13% | 1% |
| Gender | |||||
| Male | 172 | 35% | 45% | 18% | 2% |
| Female | 208 | 55% | 37% | 6% | 2% |
| Age | |||||
| 18-29 | 65 | 55% | 34% | 8% | 3% |
| 30-44 | 107 | 47% | 41% | 7% | 4% |
| 45-64 | 114 | 38% | 45% | 16% | 1% |
| 65+ | 94 | 44% | 41% | 13% | 1% |
| Religion | |||||
| Protestant | 120 | 39% | 40% | 18% | 2% |
| Catholic | 78 | 42% | 47% | 7% | 4% |
| Other Christian | 5 | 59% | 27% | 15% | 0% |
| Jewish | 9 | 66% | 24% | 10% | 0% |
| Other faith | 28 | 48% | 49% | 3% | 0% |
| Atheist/Agnostic | 55 | 54% | 34% | 10% | 2% |
| Nothing in particular | 85 | 49% | 41% | 9% | 1% |
| Income | |||||
| <$50k | 141 | 47% | 39% | 12% | 2% |
| $50-100k | 127 | 42% | 45% | 9% | 4% |
| $100k+ | 88 | 44% | 41% | 15% | 0% |
| College degree | |||||
| Yes | 146 | 49% | 41% | 9% | 1% |
| No | 234 | 44% | 41% | 12% | 3% |
| Child in college | |||||
| Yes | 47 | 52% | 43% | 3% | 2% |
| No | 333 | 45% | 41% | 13% | 2% |
| Student loans | |||||
| Yes | 48 | 59% | 34% | 6% | 1% |
| No | 332 | 43% | 42% | 12% | 2% |
| MAGA | |||||
| MAGA Republican | 74 | 32% | 53% | 13% | 2% |
| Never Trumper | 4 | 0% | 52% | 48% | 0% |
| Neither | 56 | 25% | 45% | 28% | 3% |
| Regrets degree | |||||
| Regrets | 19 | 25% | 74% | 0% | 1% |
| No regret | 127 | 52% | 36% | 11% | 0% |
| College major | |||||
| Bus./Finance | 17 | 11% | 67% | 21% | 2% |
| Eng./CS | 23 | 48% | 44% | 7% | 0% |
| Natural Sci. | 9 | 52% | 33% | 16% | 0% |
| Math | 2 | 33% | 0% | 67% | 0% |
| Social Sci. | 31 | 67% | 25% | 7% | 0% |
| Humanities | 13 | 47% | 44% | 6% | 4% |
| Education | 17 | 37% | 58% | 5% | 0% |
| Health/Nursing | 4 | 90% | 0% | 10% | 0% |
| Arts/Comm. | 18 | 56% | 35% | 9% | 0% |
| Other | 12 | 48% | 52% | 0% | 0% |
Table A33 | Department: Anthropology
“How important is it for a typical university to maintain a department in each of the following fields?” Item: Anthropology (rotating item, asked of a random subset)
| Subgroup | N | Essential — a university should always have this department | Important, but could be cut if necessary | Not very important | This department should be cut |
|---|---|---|---|---|---|
| Overall | 406 | 31% | 45% | 21% | 3% |
| Party | |||||
| Democrat | 134 | 37% | 46% | 15% | 2% |
| Independent | 130 | 31% | 44% | 22% | 3% |
| Republican | 106 | 22% | 44% | 30% | 4% |
| Gender | |||||
| Male | 195 | 31% | 49% | 16% | 4% |
| Female | 211 | 31% | 41% | 26% | 1% |
| Age | |||||
| 18-29 | 79 | 44% | 38% | 14% | 3% |
| 30-44 | 118 | 29% | 47% | 25% | 0% |
| 45-64 | 114 | 26% | 48% | 20% | 5% |
| 65+ | 95 | 25% | 47% | 26% | 2% |
| Religion | |||||
| Protestant | 140 | 30% | 40% | 27% | 3% |
| Catholic | 78 | 28% | 43% | 26% | 3% |
| Other Christian | 5 | 10% | 32% | 16% | 43% |
| Jewish | 7 | 69% | 31% | 0% | 0% |
| Other faith | 37 | 13% | 60% | 25% | 2% |
| Atheist/Agnostic | 55 | 45% | 50% | 4% | 1% |
| Nothing in particular | 84 | 34% | 47% | 18% | 1% |
| Income | |||||
| <$50k | 147 | 32% | 49% | 16% | 3% |
| $50-100k | 125 | 24% | 44% | 27% | 4% |
| $100k+ | 104 | 33% | 43% | 22% | 3% |
| College degree | |||||
| Yes | 151 | 36% | 40% | 20% | 4% |
| No | 255 | 28% | 48% | 21% | 2% |
| Child in college | |||||
| Yes | 44 | 22% | 50% | 27% | 2% |
| No | 362 | 32% | 44% | 20% | 3% |
| Student loans | |||||
| Yes | 59 | 42% | 42% | 15% | 1% |
| No | 347 | 29% | 46% | 22% | 3% |
| MAGA | |||||
| MAGA Republican | 74 | 15% | 48% | 32% | 5% |
| Never Trumper | 5 | 0% | 37% | 63% | 0% |
| Neither | 60 | 24% | 37% | 32% | 7% |
| Regrets degree | |||||
| Regrets | 20 | 34% | 23% | 38% | 4% |
| No regret | 131 | 37% | 42% | 17% | 4% |
| College major | |||||
| Bus./Finance | 18 | 34% | 23% | 31% | 12% |
| Eng./CS | 24 | 34% | 44% | 22% | 0% |
| Natural Sci. | 15 | 17% | 54% | 29% | 0% |
| Math | 3 | 0% | 57% | 0% | 43% |
| Social Sci. | 26 | 57% | 37% | 3% | 3% |
| Humanities | 17 | 60% | 18% | 22% | 0% |
| Education | 19 | 39% | 24% | 31% | 5% |
| Health/Nursing | 10 | 6% | 74% | 20% | 0% |
| Arts/Comm. | 10 | 45% | 55% | 0% | 0% |
| Other | 9 | 31% | 41% | 28% | 0% |
Table A34 | Department: Gender and sexuality studies
“How important is it for a typical university to maintain a department in each of the following fields?” Item: Gender and sexuality studies (rotating item, asked of a random subset)
| Subgroup | N | Essential — a university should always have this department | Important, but could be cut if necessary | Not very important | This department should be cut |
|---|---|---|---|---|---|
| Overall | 427 | 24% | 28% | 21% | 28% |
| Party | |||||
| Democrat | 127 | 34% | 46% | 13% | 7% |
| Independent | 138 | 23% | 28% | 19% | 30% |
| Republican | 131 | 16% | 13% | 28% | 43% |
| Gender | |||||
| Male | 204 | 24% | 25% | 20% | 30% |
| Female | 223 | 23% | 30% | 21% | 25% |
| Age | |||||
| 18-29 | 72 | 37% | 35% | 16% | 12% |
| 30-44 | 124 | 34% | 28% | 16% | 22% |
| 45-64 | 130 | 14% | 22% | 29% | 35% |
| 65+ | 101 | 13% | 28% | 18% | 41% |
| Religion | |||||
| Protestant | 164 | 23% | 23% | 20% | 34% |
| Catholic | 89 | 16% | 28% | 27% | 30% |
| Other Christian | 6 | 0% | 41% | 33% | 26% |
| Jewish | 7 | 57% | 21% | 0% | 22% |
| Other faith | 26 | 26% | 50% | 8% | 17% |
| Atheist/Agnostic | 50 | 45% | 36% | 13% | 6% |
| Nothing in particular | 85 | 20% | 26% | 24% | 30% |
| Income | |||||
| <$50k | 156 | 31% | 26% | 22% | 21% |
| $50-100k | 122 | 23% | 29% | 18% | 29% |
| $100k+ | 109 | 15% | 29% | 23% | 33% |
| College degree | |||||
| Yes | 169 | 31% | 25% | 20% | 25% |
| No | 258 | 19% | 29% | 21% | 30% |
| Child in college | |||||
| Yes | 63 | 22% | 25% | 26% | 27% |
| No | 364 | 24% | 28% | 20% | 28% |
| Student loans | |||||
| Yes | 50 | 57% | 19% | 14% | 11% |
| No | 377 | 19% | 29% | 22% | 30% |
| MAGA | |||||
| MAGA Republican | 87 | 15% | 14% | 21% | 49% |
| Never Trumper | 5 | 0% | 0% | 36% | 64% |
| Neither | 72 | 14% | 11% | 31% | 45% |
| Regrets degree | |||||
| Regrets | 28 | 13% | 25% | 18% | 43% |
| No regret | 141 | 34% | 25% | 20% | 21% |
| College major | |||||
| Bus./Finance | 23 | 35% | 13% | 12% | 41% |
| Eng./CS | 23 | 33% | 32% | 15% | 20% |
| Natural Sci. | 13 | 53% | 19% | 28% | 0% |
| Math | 4 | 0% | 19% | 61% | 20% |
| Social Sci. | 32 | 37% | 26% | 24% | 13% |
| Humanities | 24 | 50% | 11% | 14% | 25% |
| Education | 13 | 10% | 40% | 16% | 33% |
| Health/Nursing | 9 | 0% | 48% | 13% | 39% |
| Arts/Comm. | 14 | 22% | 26% | 35% | 17% |
| Other | 14 | 22% | 20% | 11% | 47% |
Table A35 | Department: African American / ethnic studies
“How important is it for a typical university to maintain a department in each of the following fields?” Item: African American / ethnic studies (rotating item, asked of a random subset)
| Subgroup | N | Essential — a university should always have this department | Important, but could be cut if necessary | Not very important | This department should be cut |
|---|---|---|---|---|---|
| Overall | 418 | 33% | 32% | 19% | 16% |
| Party | |||||
| Democrat | 141 | 48% | 39% | 12% | 2% |
| Independent | 131 | 35% | 31% | 18% | 15% |
| Republican | 111 | 13% | 23% | 28% | 36% |
| Gender | |||||
| Male | 192 | 30% | 31% | 23% | 16% |
| Female | 226 | 35% | 33% | 15% | 17% |
| Age | |||||
| 18-29 | 67 | 41% | 31% | 18% | 10% |
| 30-44 | 117 | 35% | 31% | 22% | 12% |
| 45-64 | 129 | 30% | 31% | 19% | 21% |
| 65+ | 105 | 28% | 37% | 16% | 20% |
| Religion | |||||
| Protestant | 161 | 29% | 29% | 25% | 17% |
| Catholic | 74 | 25% | 37% | 15% | 23% |
| Other Christian | 5 | 0% | 62% | 38% | 0% |
| Jewish | 7 | 94% | 0% | 0% | 6% |
| Other faith | 30 | 44% | 34% | 14% | 8% |
| Atheist/Agnostic | 60 | 34% | 44% | 16% | 6% |
| Nothing in particular | 81 | 39% | 26% | 15% | 21% |
| Income | |||||
| <$50k | 154 | 39% | 30% | 20% | 10% |
| $50-100k | 132 | 27% | 31% | 22% | 19% |
| $100k+ | 104 | 31% | 33% | 15% | 20% |
| College degree | |||||
| Yes | 152 | 39% | 29% | 14% | 18% |
| No | 266 | 29% | 34% | 21% | 16% |
| Child in college | |||||
| Yes | 58 | 40% | 25% | 22% | 13% |
| No | 360 | 32% | 33% | 18% | 17% |
| Student loans | |||||
| Yes | 53 | 51% | 26% | 14% | 8% |
| No | 365 | 30% | 33% | 19% | 17% |
| MAGA | |||||
| MAGA Republican | 87 | 14% | 22% | 22% | 42% |
| Never Trumper | 6 | 0% | 29% | 43% | 29% |
| Neither | 56 | 7% | 26% | 40% | 27% |
| Regrets degree | |||||
| Regrets | 23 | 34% | 21% | 17% | 28% |
| No regret | 129 | 40% | 31% | 14% | 16% |
| College major | |||||
| Bus./Finance | 17 | 21% | 6% | 25% | 48% |
| Eng./CS | 21 | 35% | 40% | 3% | 22% |
| Natural Sci. | 13 | 67% | 5% | 15% | 13% |
| Math | 2 | 0% | 33% | 0% | 67% |
| Social Sci. | 30 | 50% | 26% | 14% | 10% |
| Humanities | 19 | 61% | 14% | 15% | 10% |
| Education | 17 | 25% | 61% | 13% | 0% |
| Health/Nursing | 11 | 28% | 55% | 8% | 9% |
| Arts/Comm. | 12 | 28% | 49% | 11% | 12% |
| Other | 10 | 30% | 9% | 35% | 26% |
Table A36 | Do professors push a political agenda?
“Do you think most college professors generally push a particular political agenda in their teaching?”
| Subgroup | N | Yes, a strong liberal agenda | Yes, a somewhat liberal agenda | No, they are generally neutral | Yes, a somewhat conservative agenda | Yes, a strong conservative agenda |
|---|---|---|---|---|---|---|
| Overall | 1,000 | 21% | 18% | 52% | 6% | 3% |
| Party | ||||||
| Democrat | 318 | 1% | 16% | 72% | 6% | 5% |
| Independent | 316 | 22% | 16% | 54% | 7% | 1% |
| Republican | 279 | 41% | 24% | 26% | 4% | 5% |
| Gender | ||||||
| Male | 464 | 27% | 17% | 49% | 4% | 3% |
| Female | 536 | 14% | 19% | 55% | 8% | 4% |
| Age | ||||||
| 18-29 | 162 | 10% | 17% | 66% | 6% | 1% |
| 30-44 | 287 | 17% | 16% | 54% | 6% | 7% |
| 45-64 | 300 | 24% | 20% | 47% | 5% | 4% |
| 65+ | 251 | 30% | 18% | 46% | 6% | 0% |
| Religion | ||||||
| Protestant | 364 | 29% | 18% | 44% | 6% | 3% |
| Catholic | 187 | 26% | 16% | 45% | 4% | 8% |
| Other Christian | 12 | 22% | 55% | 18% | 5% | 0% |
| Jewish | 21 | 20% | 12% | 68% | 0% | 0% |
| Other faith | 78 | 19% | 11% | 61% | 10% | 0% |
| Atheist/Agnostic | 140 | 5% | 18% | 73% | 4% | 0% |
| Nothing in particular | 198 | 11% | 21% | 58% | 7% | 3% |
| Income | ||||||
| <$50k | 363 | 14% | 14% | 60% | 7% | 5% |
| $50-100k | 312 | 24% | 15% | 49% | 8% | 3% |
| $100k+ | 243 | 23% | 27% | 47% | 2% | 1% |
| College degree | ||||||
| Yes | 376 | 18% | 21% | 55% | 4% | 2% |
| No | 624 | 22% | 16% | 51% | 7% | 4% |
| Child in college | ||||||
| Yes | 141 | 15% | 28% | 42% | 9% | 6% |
| No | 859 | 22% | 16% | 54% | 5% | 3% |
| Student loans | ||||||
| Yes | 123 | 11% | 19% | 62% | 6% | 2% |
| No | 877 | 22% | 18% | 51% | 6% | 3% |
| MAGA | ||||||
| MAGA Republican | 196 | 51% | 18% | 20% | 3% | 7% |
| Never Trumper | 12 | 21% | 35% | 39% | 5% | 0% |
| Neither | 162 | 37% | 27% | 31% | 4% | 1% |
| Regrets degree | ||||||
| Regrets | 58 | 37% | 18% | 39% | 6% | 0% |
| No regret | 318 | 15% | 21% | 58% | 4% | 2% |
| College major | ||||||
| Bus./Finance | 53 | 29% | 17% | 48% | 4% | 1% |
| Eng./CS | 53 | 20% | 13% | 46% | 11% | 11% |
| Natural Sci. | 31 | 16% | 9% | 71% | 4% | 0% |
| Math | 7 | 31% | 37% | 32% | 0% | 0% |
| Social Sci. | 67 | 8% | 27% | 63% | 3% | 0% |
| Humanities | 43 | 21% | 29% | 50% | 0% | 0% |
| Education | 39 | 12% | 32% | 50% | 4% | 3% |
| Health/Nursing | 20 | 10% | 20% | 66% | 3% | 0% |
| Arts/Comm. | 36 | 20% | 21% | 56% | 3% | 0% |
| Other | 27 | 27% | 13% | 59% | 0% | 0% |
Table A37 | Is the faculty party imbalance a problem?
“About 25% of Americans identify as Republican, but on average only 6% of faculty identify as Republican. How much of a problem do you think this is?”
| Subgroup | N | This is a serious problem that needs to be fixed | This is a problem but not a high priority | This is not ideal but not really a problem | This is fine — faculty don’t need to mirror the general population |
|---|---|---|---|---|---|
| Overall | 1,000 | 25% | 16% | 25% | 34% |
| Party | |||||
| Democrat | 318 | 7% | 9% | 32% | 53% |
| Independent | 316 | 19% | 20% | 24% | 37% |
| Republican | 279 | 51% | 22% | 17% | 11% |
| Gender | |||||
| Male | 464 | 29% | 17% | 22% | 32% |
| Female | 536 | 21% | 15% | 27% | 37% |
| Age | |||||
| 18-29 | 162 | 14% | 17% | 27% | 41% |
| 30-44 | 287 | 22% | 17% | 27% | 35% |
| 45-64 | 300 | 30% | 15% | 23% | 32% |
| 65+ | 251 | 30% | 16% | 23% | 31% |
| Religion | |||||
| Protestant | 364 | 36% | 19% | 23% | 23% |
| Catholic | 187 | 29% | 19% | 20% | 32% |
| Other Christian | 12 | 40% | 8% | 29% | 23% |
| Jewish | 21 | 16% | 4% | 32% | 48% |
| Other faith | 78 | 21% | 13% | 32% | 33% |
| Atheist/Agnostic | 140 | 7% | 6% | 21% | 66% |
| Nothing in particular | 198 | 15% | 17% | 32% | 36% |
| Income | |||||
| <$50k | 363 | 21% | 16% | 24% | 39% |
| $50-100k | 312 | 27% | 17% | 22% | 34% |
| $100k+ | 243 | 25% | 16% | 26% | 33% |
| College degree | |||||
| Yes | 376 | 20% | 15% | 27% | 39% |
| No | 624 | 28% | 17% | 24% | 32% |
| Child in college | |||||
| Yes | 141 | 25% | 16% | 26% | 33% |
| No | 859 | 25% | 16% | 24% | 35% |
| Student loans | |||||
| Yes | 123 | 14% | 16% | 28% | 43% |
| No | 877 | 27% | 16% | 24% | 33% |
| MAGA | |||||
| MAGA Republican | 196 | 64% | 15% | 15% | 6% |
| Never Trumper | 12 | 13% | 34% | 40% | 13% |
| Neither | 162 | 34% | 33% | 19% | 13% |
| Regrets degree | |||||
| Regrets | 58 | 37% | 15% | 19% | 29% |
| No regret | 318 | 16% | 15% | 28% | 41% |
| College major | |||||
| Bus./Finance | 53 | 32% | 7% | 35% | 26% |
| Eng./CS | 53 | 26% | 23% | 24% | 27% |
| Natural Sci. | 31 | 12% | 4% | 10% | 73% |
| Math | 7 | 19% | 23% | 36% | 21% |
| Social Sci. | 67 | 11% | 14% | 30% | 44% |
| Humanities | 43 | 23% | 9% | 28% | 41% |
| Education | 39 | 14% | 14% | 32% | 40% |
| Health/Nursing | 20 | 5% | 26% | 20% | 50% |
| Arts/Comm. | 36 | 13% | 15% | 28% | 44% |
| Other | 27 | 32% | 24% | 14% | 30% |
Table A38 | Faculty imbalance factor: Universities discriminate against conservatives in hiring
“How much is each of the following a factor in the political imbalance of university faculty?” Item: Universities discriminate against conservatives in hiring. Wording carried over from the February questionnaire.
| Subgroup | N | A major factor | A minor factor | Not a factor | Not sure |
|---|---|---|---|---|---|
| Overall | 1,000 | 29% | 15% | 33% | 23% |
| Party | |||||
| Democrat | 318 | 7% | 13% | 59% | 21% |
| Independent | 316 | 26% | 15% | 34% | 25% |
| Republican | 279 | 57% | 17% | 8% | 18% |
| Gender | |||||
| Male | 464 | 33% | 17% | 32% | 18% |
| Female | 536 | 25% | 13% | 34% | 28% |
| Age | |||||
| 18-29 | 162 | 22% | 19% | 38% | 21% |
| 30-44 | 287 | 24% | 16% | 36% | 23% |
| 45-64 | 300 | 31% | 15% | 30% | 24% |
| 65+ | 251 | 39% | 9% | 29% | 23% |
| Religion | |||||
| Protestant | 364 | 41% | 14% | 22% | 23% |
| Catholic | 187 | 36% | 16% | 29% | 19% |
| Other Christian | 12 | 36% | 11% | 46% | 8% |
| Jewish | 21 | 19% | 12% | 63% | 6% |
| Other faith | 78 | 24% | 13% | 32% | 31% |
| Atheist/Agnostic | 140 | 8% | 9% | 68% | 14% |
| Nothing in particular | 198 | 18% | 20% | 30% | 32% |
| Income | |||||
| <$50k | 363 | 25% | 14% | 30% | 31% |
| $50-100k | 312 | 31% | 15% | 33% | 21% |
| $100k+ | 243 | 29% | 19% | 42% | 10% |
| College degree | |||||
| Yes | 376 | 26% | 12% | 47% | 14% |
| No | 624 | 31% | 16% | 25% | 28% |
| Child in college | |||||
| Yes | 141 | 30% | 14% | 37% | 18% |
| No | 859 | 29% | 15% | 32% | 24% |
| Student loans | |||||
| Yes | 123 | 22% | 16% | 46% | 17% |
| No | 877 | 30% | 15% | 31% | 24% |
| MAGA | |||||
| MAGA Republican | 196 | 66% | 15% | 6% | 12% |
| Never Trumper | 12 | 47% | 16% | 37% | 0% |
| Neither | 162 | 49% | 20% | 10% | 21% |
| Regrets degree | |||||
| Regrets | 58 | 42% | 10% | 27% | 20% |
| No regret | 318 | 23% | 13% | 51% | 13% |
| College major | |||||
| Bus./Finance | 53 | 30% | 14% | 29% | 27% |
| Eng./CS | 53 | 36% | 18% | 40% | 5% |
| Natural Sci. | 31 | 16% | 8% | 63% | 12% |
| Math | 7 | 54% | 23% | 24% | 0% |
| Social Sci. | 67 | 10% | 11% | 65% | 14% |
| Humanities | 43 | 33% | 2% | 61% | 4% |
| Education | 39 | 27% | 12% | 37% | 24% |
| Health/Nursing | 20 | 21% | 9% | 58% | 12% |
| Arts/Comm. | 36 | 32% | 14% | 42% | 12% |
| Other | 27 | 29% | 18% | 35% | 18% |
Table A39 | Faculty imbalance factor: Academic culture discourages conservatives from academic careers
“How much is each of the following a factor in the political imbalance of university faculty?” Item: Academic culture discourages conservatives from academic careers. Wording carried over from the February questionnaire.
| Subgroup | N | A major factor | A minor factor | Not a factor | Not sure |
|---|---|---|---|---|---|
| Overall | 1,000 | 23% | 21% | 31% | 26% |
| Party | |||||
| Democrat | 318 | 7% | 21% | 48% | 24% |
| Independent | 316 | 22% | 19% | 32% | 27% |
| Republican | 279 | 44% | 22% | 11% | 23% |
| Gender | |||||
| Male | 464 | 27% | 23% | 29% | 21% |
| Female | 536 | 20% | 18% | 32% | 31% |
| Age | |||||
| 18-29 | 162 | 20% | 24% | 33% | 23% |
| 30-44 | 287 | 21% | 23% | 29% | 27% |
| 45-64 | 300 | 23% | 18% | 35% | 24% |
| 65+ | 251 | 29% | 19% | 24% | 28% |
| Religion | |||||
| Protestant | 364 | 32% | 22% | 21% | 25% |
| Catholic | 187 | 31% | 21% | 29% | 19% |
| Other Christian | 12 | 22% | 31% | 29% | 18% |
| Jewish | 21 | 7% | 15% | 49% | 29% |
| Other faith | 78 | 22% | 16% | 35% | 28% |
| Atheist/Agnostic | 140 | 10% | 18% | 57% | 15% |
| Nothing in particular | 198 | 11% | 22% | 27% | 40% |
| Income | |||||
| <$50k | 363 | 18% | 19% | 27% | 36% |
| $50-100k | 312 | 26% | 19% | 34% | 21% |
| $100k+ | 243 | 25% | 24% | 36% | 15% |
| College degree | |||||
| Yes | 376 | 24% | 22% | 37% | 17% |
| No | 624 | 23% | 20% | 27% | 30% |
| Child in college | |||||
| Yes | 141 | 21% | 24% | 33% | 21% |
| No | 859 | 23% | 20% | 30% | 26% |
| Student loans | |||||
| Yes | 123 | 15% | 25% | 39% | 21% |
| No | 877 | 24% | 20% | 29% | 26% |
| MAGA | |||||
| MAGA Republican | 196 | 49% | 21% | 11% | 18% |
| Never Trumper | 12 | 41% | 33% | 26% | 0% |
| Neither | 162 | 38% | 24% | 13% | 25% |
| Regrets degree | |||||
| Regrets | 58 | 35% | 17% | 22% | 26% |
| No regret | 318 | 22% | 23% | 39% | 16% |
| College major | |||||
| Bus./Finance | 53 | 31% | 14% | 29% | 26% |
| Eng./CS | 53 | 28% | 30% | 23% | 19% |
| Natural Sci. | 31 | 13% | 13% | 47% | 27% |
| Math | 7 | 19% | 57% | 10% | 14% |
| Social Sci. | 67 | 13% | 27% | 48% | 12% |
| Humanities | 43 | 32% | 18% | 40% | 10% |
| Education | 39 | 19% | 22% | 43% | 16% |
| Health/Nursing | 20 | 19% | 29% | 37% | 15% |
| Arts/Comm. | 36 | 35% | 12% | 40% | 13% |
| Other | 27 | 26% | 23% | 30% | 21% |
Table A40 | Faculty imbalance factor: People with more education tend to become more liberal
“How much is each of the following a factor in the political imbalance of university faculty?” Item: People with more education tend to become more liberal. Wording carried over from the February questionnaire.
| Subgroup | N | A major factor | A minor factor | Not a factor | Not sure |
|---|---|---|---|---|---|
| Overall | 1,000 | 34% | 24% | 19% | 23% |
| Party | |||||
| Democrat | 318 | 49% | 21% | 14% | 16% |
| Independent | 316 | 30% | 27% | 19% | 24% |
| Republican | 279 | 24% | 27% | 23% | 26% |
| Gender | |||||
| Male | 464 | 35% | 26% | 20% | 19% |
| Female | 536 | 33% | 21% | 18% | 27% |
| Age | |||||
| 18-29 | 162 | 39% | 32% | 10% | 19% |
| 30-44 | 287 | 38% | 18% | 19% | 26% |
| 45-64 | 300 | 28% | 24% | 26% | 22% |
| 65+ | 251 | 34% | 23% | 18% | 25% |
| Religion | |||||
| Protestant | 364 | 26% | 29% | 20% | 25% |
| Catholic | 187 | 33% | 25% | 24% | 18% |
| Other Christian | 12 | 49% | 19% | 22% | 10% |
| Jewish | 21 | 71% | 10% | 10% | 9% |
| Other faith | 78 | 29% | 22% | 23% | 26% |
| Atheist/Agnostic | 140 | 54% | 21% | 14% | 11% |
| Nothing in particular | 198 | 34% | 17% | 14% | 35% |
| Income | |||||
| <$50k | 363 | 31% | 17% | 19% | 32% |
| $50-100k | 312 | 33% | 25% | 22% | 20% |
| $100k+ | 243 | 37% | 34% | 16% | 13% |
| College degree | |||||
| Yes | 376 | 42% | 26% | 17% | 15% |
| No | 624 | 29% | 23% | 20% | 28% |
| Child in college | |||||
| Yes | 141 | 32% | 29% | 24% | 15% |
| No | 859 | 34% | 23% | 18% | 25% |
| Student loans | |||||
| Yes | 123 | 46% | 22% | 17% | 15% |
| No | 877 | 32% | 24% | 19% | 24% |
| MAGA | |||||
| MAGA Republican | 196 | 27% | 23% | 28% | 21% |
| Never Trumper | 12 | 24% | 44% | 20% | 12% |
| Neither | 162 | 19% | 38% | 20% | 23% |
| Regrets degree | |||||
| Regrets | 58 | 45% | 12% | 23% | 20% |
| No regret | 318 | 42% | 28% | 16% | 14% |
| College major | |||||
| Bus./Finance | 53 | 30% | 19% | 22% | 29% |
| Eng./CS | 53 | 36% | 34% | 15% | 16% |
| Natural Sci. | 31 | 74% | 10% | 11% | 4% |
| Math | 7 | 10% | 56% | 12% | 22% |
| Social Sci. | 67 | 47% | 26% | 15% | 12% |
| Humanities | 43 | 66% | 22% | 10% | 2% |
| Education | 39 | 43% | 12% | 26% | 19% |
| Health/Nursing | 20 | 19% | 43% | 26% | 11% |
| Arts/Comm. | 36 | 51% | 27% | 18% | 4% |
| Other | 27 | 24% | 36% | 15% | 25% |
Table A41 | Faculty imbalance factor: Conservatives choose higher-paying careers outside academia
“How much is each of the following a factor in the political imbalance of university faculty?” Item: Conservatives choose higher-paying careers outside academia. Wording carried over from the February questionnaire.
| Subgroup | N | A major factor | A minor factor | Not a factor | Not sure |
|---|---|---|---|---|---|
| Overall | 1,000 | 26% | 27% | 19% | 28% |
| Party | |||||
| Democrat | 318 | 25% | 27% | 21% | 27% |
| Independent | 316 | 26% | 27% | 21% | 26% |
| Republican | 279 | 27% | 31% | 15% | 26% |
| Gender | |||||
| Male | 464 | 30% | 27% | 20% | 23% |
| Female | 536 | 23% | 26% | 18% | 33% |
| Age | |||||
| 18-29 | 162 | 20% | 31% | 21% | 28% |
| 30-44 | 287 | 25% | 25% | 21% | 30% |
| 45-64 | 300 | 27% | 24% | 22% | 27% |
| 65+ | 251 | 32% | 30% | 11% | 28% |
| Religion | |||||
| Protestant | 364 | 26% | 30% | 18% | 26% |
| Catholic | 187 | 35% | 32% | 13% | 20% |
| Other Christian | 12 | 51% | 13% | 18% | 18% |
| Jewish | 21 | 41% | 8% | 29% | 22% |
| Other faith | 78 | 34% | 19% | 11% | 37% |
| Atheist/Agnostic | 140 | 17% | 23% | 35% | 26% |
| Nothing in particular | 198 | 19% | 24% | 18% | 39% |
| Income | |||||
| <$50k | 363 | 24% | 20% | 17% | 39% |
| $50-100k | 312 | 25% | 31% | 20% | 24% |
| $100k+ | 243 | 32% | 33% | 21% | 14% |
| College degree | |||||
| Yes | 376 | 29% | 28% | 21% | 22% |
| No | 624 | 25% | 26% | 18% | 32% |
| Child in college | |||||
| Yes | 141 | 34% | 31% | 14% | 21% |
| No | 859 | 25% | 26% | 20% | 29% |
| Student loans | |||||
| Yes | 123 | 23% | 30% | 24% | 23% |
| No | 877 | 27% | 26% | 18% | 29% |
| MAGA | |||||
| MAGA Republican | 196 | 33% | 30% | 18% | 19% |
| Never Trumper | 12 | 19% | 51% | 30% | 0% |
| Neither | 162 | 25% | 35% | 14% | 27% |
| Regrets degree | |||||
| Regrets | 58 | 27% | 24% | 20% | 29% |
| No regret | 318 | 29% | 29% | 21% | 20% |
| College major | |||||
| Bus./Finance | 53 | 28% | 25% | 16% | 30% |
| Eng./CS | 53 | 31% | 31% | 25% | 14% |
| Natural Sci. | 31 | 26% | 16% | 16% | 42% |
| Math | 7 | 40% | 26% | 34% | 0% |
| Social Sci. | 67 | 30% | 29% | 25% | 16% |
| Humanities | 43 | 39% | 29% | 18% | 14% |
| Education | 39 | 23% | 28% | 24% | 24% |
| Health/Nursing | 20 | 21% | 36% | 26% | 17% |
| Arts/Comm. | 36 | 30% | 36% | 14% | 20% |
| Other | 27 | 24% | 22% | 22% | 32% |
Table A42 | Whose job is it to fix the imbalance?
“Whose responsibility is it to address political imbalance among faculty?” Wording carried over from the February questionnaire.
| Subgroup | N | Universities themselves | State governments | Federal government | It doesn’t need to be addressed | Not sure |
|---|---|---|---|---|---|---|
| Overall | 1,000 | 46% | 7% | 6% | 25% | 16% |
| Party | ||||||
| Democrat | 318 | 37% | 4% | 4% | 41% | 15% |
| Independent | 316 | 50% | 7% | 4% | 26% | 12% |
| Republican | 279 | 56% | 12% | 9% | 8% | 14% |
| Gender | ||||||
| Male | 464 | 47% | 8% | 6% | 25% | 14% |
| Female | 536 | 45% | 7% | 6% | 25% | 18% |
| Age | ||||||
| 18-29 | 162 | 42% | 9% | 3% | 29% | 18% |
| 30-44 | 287 | 34% | 10% | 8% | 28% | 20% |
| 45-64 | 300 | 51% | 6% | 6% | 23% | 14% |
| 65+ | 251 | 57% | 5% | 5% | 20% | 12% |
| Religion | ||||||
| Protestant | 364 | 52% | 11% | 5% | 17% | 14% |
| Catholic | 187 | 52% | 10% | 10% | 17% | 12% |
| Other Christian | 12 | 49% | 0% | 10% | 41% | 0% |
| Jewish | 21 | 35% | 0% | 0% | 52% | 13% |
| Other faith | 78 | 38% | 5% | 12% | 24% | 22% |
| Atheist/Agnostic | 140 | 39% | 2% | 0% | 49% | 10% |
| Nothing in particular | 198 | 37% | 5% | 5% | 28% | 26% |
| Income | ||||||
| <$50k | 363 | 40% | 9% | 6% | 24% | 21% |
| $50-100k | 312 | 49% | 8% | 6% | 24% | 13% |
| $100k+ | 243 | 51% | 5% | 7% | 29% | 8% |
| College degree | ||||||
| Yes | 376 | 47% | 7% | 4% | 33% | 9% |
| No | 624 | 46% | 8% | 7% | 20% | 20% |
| Child in college | ||||||
| Yes | 141 | 53% | 6% | 9% | 23% | 10% |
| No | 859 | 45% | 8% | 5% | 25% | 17% |
| Student loans | ||||||
| Yes | 123 | 44% | 6% | 3% | 40% | 7% |
| No | 877 | 46% | 8% | 6% | 23% | 17% |
| MAGA | ||||||
| MAGA Republican | 196 | 58% | 13% | 13% | 5% | 11% |
| Never Trumper | 12 | 70% | 0% | 0% | 30% | 0% |
| Neither | 162 | 65% | 8% | 3% | 10% | 15% |
| Regrets degree | ||||||
| Regrets | 58 | 57% | 6% | 7% | 15% | 15% |
| No regret | 318 | 45% | 7% | 4% | 36% | 8% |
| College major | ||||||
| Bus./Finance | 53 | 50% | 8% | 4% | 17% | 20% |
| Eng./CS | 53 | 38% | 19% | 8% | 25% | 10% |
| Natural Sci. | 31 | 39% | 2% | 0% | 58% | 0% |
| Math | 7 | 52% | 0% | 12% | 14% | 22% |
| Social Sci. | 67 | 43% | 6% | 3% | 47% | 1% |
| Humanities | 43 | 52% | 0% | 0% | 44% | 3% |
| Education | 39 | 48% | 9% | 6% | 34% | 3% |
| Health/Nursing | 20 | 61% | 2% | 0% | 31% | 7% |
| Arts/Comm. | 36 | 47% | 4% | 0% | 35% | 14% |
| Other | 27 | 55% | 0% | 15% | 8% | 22% |
Table A43 | Considering political viewpoints in hiring
“Should universities consider political viewpoints when hiring faculty, to ensure a range of perspectives are represented?”
| Subgroup | N | Strongly support | Somewhat support | Neither support nor oppose | Somewhat oppose | Strongly oppose |
|---|---|---|---|---|---|---|
| Overall | 1,000 | 7% | 16% | 37% | 14% | 27% |
| Party | ||||||
| Democrat | 318 | 3% | 8% | 36% | 18% | 34% |
| Independent | 316 | 7% | 19% | 32% | 15% | 27% |
| Republican | 279 | 10% | 24% | 39% | 10% | 17% |
| Gender | ||||||
| Male | 464 | 7% | 18% | 33% | 13% | 28% |
| Female | 536 | 6% | 14% | 40% | 15% | 25% |
| Age | ||||||
| 18-29 | 162 | 5% | 17% | 40% | 18% | 20% |
| 30-44 | 287 | 6% | 14% | 38% | 16% | 27% |
| 45-64 | 300 | 7% | 18% | 33% | 12% | 30% |
| 65+ | 251 | 9% | 15% | 38% | 12% | 26% |
| Religion | ||||||
| Protestant | 364 | 10% | 18% | 36% | 12% | 23% |
| Catholic | 187 | 9% | 20% | 36% | 13% | 22% |
| Other Christian | 12 | 0% | 26% | 31% | 37% | 5% |
| Jewish | 21 | 0% | 5% | 41% | 23% | 31% |
| Other faith | 78 | 3% | 21% | 34% | 11% | 31% |
| Atheist/Agnostic | 140 | 3% | 7% | 25% | 17% | 49% |
| Nothing in particular | 198 | 3% | 14% | 47% | 15% | 21% |
| Income | ||||||
| <$50k | 363 | 5% | 14% | 43% | 13% | 26% |
| $50-100k | 312 | 8% | 18% | 33% | 14% | 27% |
| $100k+ | 243 | 9% | 18% | 31% | 15% | 28% |
| College degree | ||||||
| Yes | 376 | 8% | 14% | 31% | 15% | 31% |
| No | 624 | 6% | 17% | 40% | 13% | 24% |
| Child in college | ||||||
| Yes | 141 | 8% | 22% | 31% | 16% | 24% |
| No | 859 | 6% | 15% | 38% | 14% | 27% |
| Student loans | ||||||
| Yes | 123 | 4% | 14% | 32% | 17% | 33% |
| No | 877 | 7% | 16% | 37% | 14% | 26% |
| MAGA | ||||||
| MAGA Republican | 196 | 13% | 29% | 33% | 9% | 16% |
| Never Trumper | 12 | 6% | 12% | 34% | 10% | 38% |
| Neither | 162 | 9% | 20% | 40% | 10% | 20% |
| Regrets degree | ||||||
| Regrets | 58 | 8% | 14% | 36% | 11% | 31% |
| No regret | 318 | 8% | 14% | 30% | 16% | 31% |
| College major | ||||||
| Bus./Finance | 53 | 13% | 16% | 46% | 9% | 16% |
| Eng./CS | 53 | 14% | 20% | 26% | 21% | 18% |
| Natural Sci. | 31 | 3% | 2% | 32% | 19% | 43% |
| Math | 7 | 0% | 0% | 31% | 34% | 35% |
| Social Sci. | 67 | 4% | 22% | 21% | 19% | 34% |
| Humanities | 43 | 4% | 19% | 33% | 7% | 37% |
| Education | 39 | 0% | 9% | 45% | 16% | 30% |
| Health/Nursing | 20 | 14% | 3% | 18% | 20% | 45% |
| Arts/Comm. | 36 | 11% | 7% | 26% | 21% | 34% |
| Other | 27 | 5% | 17% | 30% | 0% | 47% |
Table A44 | Hiring preference: conservative candidate version
“Suppose two equally qualified candidates apply for a professor job in a department where almost no faculty are [conservative / people of color]. Would you support or oppose the university choosing the [conservative candidate specifically because of their political views / candidate of color specifically because of their race]?” Respondents randomly assigned to the conservative-candidate version.
| Subgroup | N | Strongly support | Somewhat support | Neither support nor oppose | Somewhat oppose | Strongly oppose |
|---|---|---|---|---|---|---|
| Overall | 500 | 8% | 12% | 41% | 15% | 24% |
| Party | ||||||
| Democrat | 160 | 4% | 6% | 36% | 20% | 33% |
| Independent | 152 | 5% | 14% | 43% | 15% | 23% |
| Republican | 137 | 18% | 21% | 36% | 13% | 13% |
| Gender | ||||||
| Male | 228 | 13% | 14% | 38% | 16% | 19% |
| Female | 272 | 3% | 11% | 44% | 14% | 28% |
| Age | ||||||
| 18-29 | 80 | 1% | 12% | 44% | 21% | 22% |
| 30-44 | 139 | 6% | 10% | 45% | 16% | 23% |
| 45-64 | 145 | 8% | 10% | 42% | 15% | 24% |
| 65+ | 136 | 16% | 18% | 32% | 10% | 24% |
| Religion | ||||||
| Protestant | 189 | 12% | 17% | 40% | 12% | 20% |
| Catholic | 89 | 13% | 14% | 39% | 19% | 15% |
| Other Christian | 7 | 21% | 16% | 0% | 33% | 30% |
| Jewish | 12 | 0% | 13% | 17% | 51% | 18% |
| Other faith | 39 | 4% | 3% | 43% | 14% | 36% |
| Atheist/Agnostic | 70 | 1% | 5% | 31% | 24% | 39% |
| Nothing in particular | 94 | 3% | 10% | 56% | 8% | 22% |
| Income | ||||||
| <$50k | 181 | 5% | 11% | 44% | 18% | 22% |
| $50-100k | 146 | 11% | 10% | 39% | 15% | 25% |
| $100k+ | 128 | 10% | 15% | 32% | 15% | 28% |
| College degree | ||||||
| Yes | 180 | 8% | 11% | 33% | 16% | 33% |
| No | 320 | 8% | 13% | 45% | 15% | 18% |
| Child in college | ||||||
| Yes | 65 | 5% | 16% | 43% | 13% | 23% |
| No | 435 | 9% | 11% | 41% | 16% | 24% |
| Student loans | ||||||
| Yes | 56 | 6% | 12% | 22% | 25% | 34% |
| No | 444 | 8% | 12% | 43% | 14% | 22% |
| MAGA | ||||||
| MAGA Republican | 93 | 25% | 19% | 34% | 8% | 14% |
| Never Trumper | 8 | 0% | 26% | 34% | 18% | 22% |
| Neither | 77 | 9% | 23% | 37% | 22% | 9% |
| Regrets degree | ||||||
| Regrets | 26 | 15% | 10% | 33% | 7% | 35% |
| No regret | 154 | 7% | 11% | 33% | 17% | 32% |
| College major | ||||||
| Bus./Finance | 23 | 23% | 3% | 49% | 12% | 12% |
| Eng./CS | 25 | 4% | 21% | 39% | 14% | 23% |
| Natural Sci. | 15 | 0% | 9% | 26% | 33% | 32% |
| Math | 5 | 0% | 15% | 24% | 43% | 18% |
| Social Sci. | 36 | 0% | 8% | 24% | 26% | 42% |
| Humanities | 16 | 16% | 13% | 26% | 12% | 33% |
| Education | 16 | 16% | 5% | 35% | 0% | 43% |
| Health/Nursing | 9 | 10% | 9% | 16% | 6% | 59% |
| Arts/Comm. | 20 | 0% | 16% | 28% | 11% | 45% |
| Other | 15 | 15% | 9% | 47% | 4% | 26% |
Table A45 | Hiring preference: candidate of color version
“Suppose two equally qualified candidates apply for a professor job in a department where almost no faculty are [conservative / people of color]. Would you support or oppose the university choosing the [conservative candidate specifically because of their political views / candidate of color specifically because of their race]?” Respondents randomly assigned to the candidate-of-color version.
| Subgroup | N | Strongly support | Somewhat support | Neither support nor oppose | Somewhat oppose | Strongly oppose |
|---|---|---|---|---|---|---|
| Overall | 500 | 8% | 13% | 30% | 18% | 32% |
| Party | ||||||
| Democrat | 158 | 14% | 25% | 35% | 17% | 10% |
| Independent | 164 | 6% | 10% | 32% | 16% | 35% |
| Republican | 142 | 3% | 5% | 22% | 22% | 48% |
| Gender | ||||||
| Male | 236 | 7% | 13% | 26% | 22% | 32% |
| Female | 264 | 9% | 13% | 34% | 14% | 31% |
| Age | ||||||
| 18-29 | 82 | 6% | 15% | 33% | 24% | 22% |
| 30-44 | 148 | 9% | 14% | 42% | 7% | 28% |
| 45-64 | 155 | 9% | 9% | 22% | 22% | 37% |
| 65+ | 115 | 8% | 14% | 26% | 17% | 35% |
| Religion | ||||||
| Protestant | 175 | 9% | 10% | 24% | 23% | 34% |
| Catholic | 98 | 6% | 11% | 27% | 16% | 41% |
| Other Christian | 5 | 0% | 0% | 45% | 12% | 43% |
| Jewish | 9 | 10% | 33% | 30% | 21% | 6% |
| Other faith | 39 | 5% | 9% | 29% | 16% | 42% |
| Atheist/Agnostic | 70 | 16% | 27% | 29% | 12% | 17% |
| Nothing in particular | 104 | 4% | 10% | 45% | 15% | 26% |
| Income | ||||||
| <$50k | 182 | 7% | 9% | 37% | 19% | 28% |
| $50-100k | 166 | 9% | 12% | 30% | 12% | 38% |
| $100k+ | 115 | 8% | 19% | 19% | 24% | 30% |
| College degree | ||||||
| Yes | 196 | 12% | 19% | 24% | 16% | 29% |
| No | 304 | 6% | 9% | 33% | 19% | 33% |
| Child in college | ||||||
| Yes | 76 | 11% | 15% | 26% | 10% | 39% |
| No | 424 | 7% | 12% | 31% | 19% | 30% |
| Student loans | ||||||
| Yes | 67 | 17% | 16% | 27% | 19% | 20% |
| No | 433 | 7% | 12% | 30% | 18% | 33% |
| MAGA | ||||||
| MAGA Republican | 103 | 3% | 3% | 18% | 17% | 59% |
| Never Trumper | 4 | 0% | 72% | 0% | 0% | 28% |
| Neither | 85 | 3% | 5% | 25% | 24% | 42% |
| Regrets degree | ||||||
| Regrets | 32 | 3% | 17% | 26% | 13% | 41% |
| No regret | 164 | 14% | 20% | 24% | 17% | 26% |
| College major | ||||||
| Bus./Finance | 30 | 6% | 16% | 18% | 20% | 40% |
| Eng./CS | 28 | 11% | 33% | 13% | 10% | 33% |
| Natural Sci. | 16 | 8% | 42% | 32% | 11% | 7% |
| Math | 2 | 0% | 46% | 0% | 0% | 54% |
| Social Sci. | 31 | 12% | 18% | 20% | 25% | 24% |
| Humanities | 27 | 14% | 15% | 45% | 15% | 10% |
| Education | 23 | 24% | 6% | 28% | 12% | 30% |
| Health/Nursing | 11 | 4% | 5% | 39% | 18% | 33% |
| Arts/Comm. | 16 | 13% | 29% | 21% | 30% | 7% |
| Other | 12 | 11% | 13% | 9% | 0% | 67% |
Table A46 | Should universities take public positions?
“When a national or global controversy arises, do you think colleges and universities should issue official institutional statements taking a position, or should they generally remain neutral?”
| Subgroup | N | Should almost always take a public position | Should take a position on some issues but not others | Should generally remain neutral | Should always remain neutral | Not sure |
|---|---|---|---|---|---|---|
| Overall | 1,000 | 5% | 18% | 39% | 25% | 12% |
| Party | ||||||
| Democrat | 318 | 7% | 30% | 40% | 14% | 10% |
| Independent | 316 | 6% | 15% | 43% | 24% | 13% |
| Republican | 279 | 2% | 13% | 38% | 38% | 9% |
| Gender | ||||||
| Male | 464 | 4% | 17% | 41% | 27% | 11% |
| Female | 536 | 5% | 20% | 38% | 23% | 14% |
| Age | ||||||
| 18-29 | 162 | 7% | 28% | 37% | 15% | 13% |
| 30-44 | 287 | 6% | 22% | 35% | 18% | 18% |
| 45-64 | 300 | 3% | 13% | 42% | 32% | 10% |
| 65+ | 251 | 3% | 14% | 42% | 33% | 8% |
| Religion | ||||||
| Protestant | 364 | 3% | 16% | 40% | 31% | 10% |
| Catholic | 187 | 3% | 20% | 40% | 28% | 9% |
| Other Christian | 12 | 14% | 45% | 34% | 6% | 0% |
| Jewish | 21 | 0% | 18% | 43% | 16% | 23% |
| Other faith | 78 | 3% | 19% | 42% | 19% | 17% |
| Atheist/Agnostic | 140 | 12% | 25% | 37% | 17% | 7% |
| Nothing in particular | 198 | 6% | 14% | 38% | 20% | 21% |
| Income | ||||||
| <$50k | 363 | 5% | 20% | 39% | 20% | 16% |
| $50-100k | 312 | 4% | 18% | 40% | 27% | 11% |
| $100k+ | 243 | 6% | 17% | 42% | 29% | 6% |
| College degree | ||||||
| Yes | 376 | 6% | 23% | 40% | 23% | 7% |
| No | 624 | 4% | 16% | 39% | 26% | 15% |
| Child in college | ||||||
| Yes | 141 | 4% | 21% | 48% | 22% | 6% |
| No | 859 | 5% | 18% | 38% | 25% | 13% |
| Student loans | ||||||
| Yes | 123 | 8% | 20% | 47% | 17% | 8% |
| No | 877 | 4% | 18% | 38% | 26% | 13% |
| MAGA | ||||||
| MAGA Republican | 196 | 1% | 14% | 33% | 44% | 7% |
| Never Trumper | 12 | 5% | 9% | 55% | 11% | 21% |
| Neither | 162 | 2% | 9% | 46% | 36% | 7% |
| Regrets degree | ||||||
| Regrets | 58 | 8% | 11% | 40% | 28% | 13% |
| No regret | 318 | 6% | 25% | 40% | 22% | 6% |
| College major | ||||||
| Bus./Finance | 53 | 4% | 24% | 28% | 31% | 14% |
| Eng./CS | 53 | 13% | 25% | 37% | 15% | 10% |
| Natural Sci. | 31 | 10% | 24% | 43% | 2% | 21% |
| Math | 7 | 0% | 10% | 57% | 33% | 0% |
| Social Sci. | 67 | 11% | 30% | 41% | 14% | 4% |
| Humanities | 43 | 0% | 23% | 60% | 15% | 2% |
| Education | 39 | 7% | 18% | 35% | 38% | 3% |
| Health/Nursing | 20 | 0% | 21% | 45% | 34% | 0% |
| Arts/Comm. | 36 | 7% | 19% | 45% | 25% | 4% |
| Other | 27 | 2% | 15% | 33% | 41% | 10% |
Table A47 | The AAUP’s political endorsement
“The American Association of University Professors, a national organization representing university professors recently endorsed a Democratic candidate for the U.S. Senate, the first political endorsement in the organization’s 111-year history. Do you approve or disapprove of the AAUP endorsing political candidates?”
| Subgroup | N | Strongly approve | Somewhat approve | Neither approve nor disapprove | Somewhat disapprove | Strongly disapprove |
|---|---|---|---|---|---|---|
| Overall | 1,000 | 8% | 11% | 39% | 14% | 28% |
| Party | ||||||
| Democrat | 318 | 17% | 22% | 43% | 14% | 4% |
| Independent | 316 | 7% | 10% | 41% | 16% | 27% |
| Republican | 279 | 2% | 3% | 30% | 11% | 54% |
| Gender | ||||||
| Male | 464 | 8% | 9% | 36% | 15% | 32% |
| Female | 536 | 8% | 13% | 43% | 12% | 24% |
| Age | ||||||
| 18-29 | 162 | 6% | 13% | 47% | 19% | 14% |
| 30-44 | 287 | 9% | 13% | 47% | 10% | 21% |
| 45-64 | 300 | 9% | 8% | 33% | 13% | 37% |
| 65+ | 251 | 7% | 9% | 32% | 15% | 37% |
| Religion | ||||||
| Protestant | 364 | 6% | 8% | 34% | 16% | 36% |
| Catholic | 187 | 12% | 9% | 29% | 18% | 32% |
| Other Christian | 12 | 10% | 16% | 19% | 16% | 40% |
| Jewish | 21 | 21% | 22% | 23% | 22% | 12% |
| Other faith | 78 | 6% | 10% | 52% | 4% | 28% |
| Atheist/Agnostic | 140 | 9% | 18% | 43% | 10% | 20% |
| Nothing in particular | 198 | 6% | 12% | 55% | 10% | 17% |
| Income | ||||||
| <$50k | 363 | 7% | 12% | 51% | 11% | 20% |
| $50-100k | 312 | 7% | 10% | 34% | 14% | 35% |
| $100k+ | 243 | 12% | 9% | 29% | 20% | 30% |
| College degree | ||||||
| Yes | 376 | 10% | 12% | 35% | 15% | 28% |
| No | 624 | 6% | 10% | 42% | 13% | 28% |
| Child in college | ||||||
| Yes | 141 | 11% | 14% | 37% | 12% | 27% |
| No | 859 | 7% | 10% | 40% | 14% | 29% |
| Student loans | ||||||
| Yes | 123 | 7% | 17% | 39% | 20% | 18% |
| No | 877 | 8% | 10% | 40% | 13% | 30% |
| MAGA | ||||||
| MAGA Republican | 196 | 3% | 4% | 24% | 9% | 60% |
| Never Trumper | 12 | 0% | 16% | 0% | 32% | 52% |
| Neither | 162 | 2% | 2% | 29% | 19% | 48% |
| Regrets degree | ||||||
| Regrets | 58 | 5% | 5% | 39% | 14% | 37% |
| No regret | 318 | 11% | 13% | 34% | 15% | 26% |
| College major | ||||||
| Bus./Finance | 53 | 7% | 10% | 37% | 8% | 38% |
| Eng./CS | 53 | 14% | 11% | 32% | 15% | 28% |
| Natural Sci. | 31 | 16% | 26% | 31% | 20% | 7% |
| Math | 7 | 0% | 0% | 55% | 14% | 31% |
| Social Sci. | 67 | 14% | 14% | 28% | 21% | 24% |
| Humanities | 43 | 15% | 14% | 26% | 26% | 20% |
| Education | 39 | 6% | 6% | 52% | 17% | 19% |
| Health/Nursing | 20 | 0% | 8% | 46% | 7% | 39% |
| Arts/Comm. | 36 | 12% | 14% | 32% | 17% | 24% |
| Other | 27 | 6% | 7% | 33% | 0% | 55% |
Table A48 | College graduation
“Have you completed a four-year college degree?”
| Subgroup | N | Yes | No |
|---|---|---|---|
| Overall | 1,000 | 37% | 63% |
| Party | |||
| Democrat | 318 | 42% | 58% |
| Independent | 316 | 38% | 62% |
| Republican | 279 | 34% | 66% |
| Gender | |||
| Male | 464 | 36% | 64% |
| Female | 536 | 38% | 62% |
| Age | |||
| 18-29 | 162 | 32% | 68% |
| 30-44 | 287 | 43% | 57% |
| 45-64 | 300 | 37% | 63% |
| 65+ | 251 | 32% | 68% |
| Religion | |||
| Protestant | 364 | 35% | 65% |
| Catholic | 187 | 29% | 71% |
| Other Christian | 12 | 74% | 26% |
| Jewish | 21 | 68% | 32% |
| Other faith | 78 | 29% | 71% |
| Atheist/Agnostic | 140 | 57% | 43% |
| Nothing in particular | 198 | 32% | 68% |
| Income | |||
| <$50k | 363 | 19% | 81% |
| $50-100k | 312 | 43% | 57% |
| $100k+ | 243 | 58% | 42% |
| Child in college | |||
| Yes | 141 | 51% | 49% |
| No | 859 | 34% | 66% |
| Student loans | |||
| Yes | 123 | 56% | 44% |
| No | 877 | 34% | 66% |
| MAGA | |||
| MAGA Republican | 196 | 33% | 67% |
| Never Trumper | 12 | 75% | 25% |
| Neither | 162 | 36% | 64% |
Table A49 | College major
“What was your primary field of study (major)?” Asked if college_grad = Yes. Major categories abbreviated for width.
| Subgroup | N | Bus./Finance | Eng./CS | Natural Sci. | Math | Social Sci. | Humanities | Education | Health/Nursing | Arts/Comm. | Other |
|---|---|---|---|---|---|---|---|---|---|---|---|
| Overall | 376 | 15% | 15% | 7% | 2% | 17% | 10% | 10% | 7% | 9% | 7% |
| Party | |||||||||||
| Democrat | 146 | 10% | 12% | 11% | 1% | 21% | 13% | 13% | 7% | 10% | 3% |
| Independent | 124 | 14% | 14% | 7% | 2% | 19% | 12% | 8% | 10% | 6% | 8% |
| Republican | 86 | 24% | 19% | 3% | 2% | 8% | 6% | 10% | 5% | 9% | 12% |
| Gender | |||||||||||
| Male | 181 | 21% | 20% | 5% | 2% | 12% | 12% | 6% | 4% | 7% | 10% |
| Female | 195 | 10% | 10% | 9% | 2% | 22% | 9% | 14% | 10% | 11% | 4% |
| Age | |||||||||||
| 18-29 | 51 | 18% | 11% | 16% | 0% | 17% | 0% | 6% | 20% | 8% | 4% |
| 30-44 | 124 | 18% | 24% | 4% | 2% | 18% | 11% | 11% | 2% | 6% | 4% |
| 45-64 | 115 | 12% | 11% | 4% | 3% | 20% | 15% | 8% | 6% | 10% | 12% |
| 65+ | 86 | 15% | 11% | 10% | 2% | 12% | 9% | 15% | 5% | 12% | 8% |
| Religion | |||||||||||
| Protestant | 126 | 19% | 17% | 4% | 2% | 14% | 11% | 11% | 6% | 11% | 5% |
| Catholic | 59 | 12% | 29% | 5% | 3% | 13% | 7% | 13% | 4% | 12% | 3% |
| Other Christian | 8 | 30% | 0% | 18% | 0% | 32% | 0% | 7% | 0% | 0% | 14% |
| Jewish | 14 | 0% | 6% | 30% | 0% | 31% | 11% | 11% | 0% | 11% | 0% |
| Other faith | 22 | 0% | 4% | 12% | 4% | 15% | 10% | 16% | 14% | 4% | 21% |
| Atheist/Agnostic | 84 | 11% | 10% | 9% | 1% | 26% | 9% | 5% | 13% | 7% | 10% |
| Nothing in particular | 63 | 23% | 12% | 7% | 3% | 13% | 13% | 9% | 5% | 8% | 7% |
| Income | |||||||||||
| <$50k | 75 | 11% | 11% | 12% | 2% | 15% | 8% | 15% | 4% | 7% | 16% |
| $50-100k | 127 | 20% | 11% | 4% | 1% | 17% | 10% | 14% | 7% | 9% | 8% |
| $100k+ | 152 | 14% | 22% | 7% | 2% | 19% | 10% | 5% | 9% | 9% | 3% |
| Child in college | |||||||||||
| Yes | 72 | 12% | 24% | 5% | 1% | 12% | 15% | 9% | 11% | 7% | 4% |
| No | 304 | 16% | 13% | 8% | 2% | 19% | 9% | 10% | 6% | 9% | 8% |
| Student loans | |||||||||||
| Yes | 72 | 12% | 7% | 13% | 1% | 37% | 8% | 7% | 3% | 10% | 1% |
| No | 304 | 16% | 17% | 6% | 2% | 13% | 11% | 11% | 8% | 9% | 9% |
| MAGA | |||||||||||
| MAGA Republican | 58 | 30% | 18% | 3% | 1% | 4% | 7% | 9% | 6% | 5% | 16% |
| Never Trumper | 8 | 12% | 20% | 14% | 0% | 13% | 0% | 0% | 32% | 0% | 9% |
| Neither | 51 | 11% | 17% | 2% | 4% | 24% | 3% | 13% | 8% | 15% | 4% |
| Regrets degree | |||||||||||
| Regrets | 58 | 25% | 8% | 3% | 1% | 10% | 20% | 9% | 5% | 9% | 10% |
| No regret | 318 | 13% | 16% | 8% | 2% | 19% | 8% | 10% | 7% | 9% | 7% |
Table A50 | Would still get their degree
“If you could go back, would you still choose to get your college degree?” Asked if college_grad = Yes.
| Subgroup | N | Definitely yes | Probably yes | Probably not | Definitely not |
|---|---|---|---|---|---|
| Overall | 377 | 58% | 26% | 10% | 6% |
| Party | |||||
| Democrat | 146 | 66% | 24% | 7% | 3% |
| Independent | 125 | 57% | 26% | 9% | 8% |
| Republican | 86 | 52% | 27% | 13% | 8% |
| Gender | |||||
| Male | 182 | 57% | 26% | 12% | 5% |
| Female | 195 | 59% | 26% | 8% | 6% |
| Age | |||||
| 18-29 | 52 | 67% | 24% | 6% | 3% |
| 30-44 | 124 | 47% | 32% | 12% | 10% |
| 45-64 | 115 | 58% | 24% | 13% | 5% |
| 65+ | 86 | 68% | 23% | 5% | 3% |
| Religion | |||||
| Protestant | 126 | 58% | 27% | 11% | 4% |
| Catholic | 60 | 59% | 26% | 8% | 7% |
| Other Christian | 8 | 67% | 20% | 14% | 0% |
| Jewish | 14 | 79% | 13% | 8% | 0% |
| Other faith | 22 | 50% | 29% | 19% | 2% |
| Atheist/Agnostic | 84 | 67% | 22% | 8% | 3% |
| Nothing in particular | 63 | 44% | 33% | 9% | 14% |
| Income | |||||
| <$50k | 75 | 52% | 23% | 15% | 10% |
| $50-100k | 127 | 55% | 26% | 12% | 8% |
| $100k+ | 152 | 62% | 29% | 6% | 3% |
| Child in college | |||||
| Yes | 72 | 59% | 33% | 8% | 0% |
| No | 305 | 58% | 25% | 11% | 7% |
| Student loans | |||||
| Yes | 72 | 59% | 23% | 8% | 9% |
| No | 305 | 58% | 27% | 10% | 5% |
| MAGA | |||||
| MAGA Republican | 58 | 46% | 25% | 19% | 10% |
| Never Trumper | 8 | 73% | 16% | 12% | 0% |
| Neither | 51 | 54% | 37% | 4% | 4% |
| Regrets degree | |||||
| Regrets | 58 | 0% | 0% | 64% | 36% |
| No regret | 318 | 69% | 31% | 0% | 0% |
| College major | |||||
| Bus./Finance | 53 | 42% | 32% | 15% | 11% |
| Eng./CS | 53 | 71% | 20% | 7% | 2% |
| Natural Sci. | 31 | 77% | 17% | 6% | 0% |
| Math | 7 | 43% | 45% | 12% | 0% |
| Social Sci. | 67 | 67% | 24% | 5% | 4% |
| Humanities | 43 | 49% | 20% | 13% | 18% |
| Education | 39 | 53% | 33% | 7% | 6% |
| Health/Nursing | 20 | 73% | 15% | 6% | 6% |
| Arts/Comm. | 36 | 49% | 35% | 13% | 3% |
| Other | 27 | 49% | 30% | 21% | 0% |
Table A51 | Regret not getting a degree
“Do you regret not getting a four-year college degree?” Asked if college_grad = No.
| Subgroup | N | Yes | No |
|---|---|---|---|
| Overall | 624 | 27% | 73% |
| Party | |||
| Democrat | 172 | 34% | 66% |
| Independent | 192 | 24% | 76% |
| Republican | 193 | 20% | 80% |
| Gender | |||
| Male | 283 | 27% | 73% |
| Female | 341 | 27% | 73% |
| Age | |||
| 18-29 | 111 | 26% | 74% |
| 30-44 | 163 | 36% | 64% |
| 45-64 | 185 | 25% | 75% |
| 65+ | 165 | 21% | 79% |
| Religion | |||
| Protestant | 238 | 23% | 77% |
| Catholic | 128 | 33% | 67% |
| Other Christian | 4 | 13% | 87% |
| Jewish | 7 | 45% | 55% |
| Other faith | 56 | 22% | 78% |
| Atheist/Agnostic | 56 | 39% | 61% |
| Nothing in particular | 135 | 24% | 76% |
| Income | |||
| <$50k | 288 | 27% | 73% |
| $50-100k | 185 | 32% | 68% |
| $100k+ | 91 | 18% | 82% |
| Child in college | |||
| Yes | 69 | 38% | 62% |
| No | 555 | 26% | 74% |
| Student loans | |||
| Yes | 51 | 40% | 60% |
| No | 573 | 26% | 74% |
| MAGA | |||
| MAGA Republican | 138 | 26% | 74% |
| Never Trumper | 4 | 28% | 72% |
| Neither | 111 | 17% | 83% |
Table A52 | Outstanding student loan debt
“Do you currently have outstanding student loan debt?”
| Subgroup | N | Yes | No |
|---|---|---|---|
| Overall | 1,000 | 12% | 88% |
| Party | |||
| Democrat | 318 | 16% | 84% |
| Independent | 316 | 13% | 87% |
| Republican | 279 | 9% | 91% |
| Gender | |||
| Male | 464 | 10% | 90% |
| Female | 536 | 15% | 85% |
| Age | |||
| 18-29 | 162 | 19% | 81% |
| 30-44 | 287 | 17% | 83% |
| 45-64 | 300 | 11% | 89% |
| 65+ | 251 | 2% | 98% |
| Religion | |||
| Protestant | 364 | 15% | 85% |
| Catholic | 187 | 4% | 96% |
| Other Christian | 12 | 8% | 92% |
| Jewish | 21 | 28% | 72% |
| Other faith | 78 | 7% | 93% |
| Atheist/Agnostic | 140 | 18% | 82% |
| Nothing in particular | 198 | 12% | 88% |
| Income | |||
| <$50k | 363 | 12% | 88% |
| $50-100k | 312 | 14% | 86% |
| $100k+ | 243 | 13% | 87% |
| College degree | |||
| Yes | 376 | 19% | 81% |
| No | 624 | 9% | 91% |
| Child in college | |||
| Yes | 141 | 14% | 86% |
| No | 859 | 12% | 88% |
| MAGA | |||
| MAGA Republican | 196 | 5% | 95% |
| Never Trumper | 12 | 0% | 100% |
| Neither | 162 | 17% | 83% |
| Regrets degree | |||
| Regrets | 58 | 21% | 79% |
| No regret | 318 | 18% | 82% |
| College major | |||
| Bus./Finance | 53 | 15% | 85% |
| Eng./CS | 53 | 9% | 91% |
| Natural Sci. | 31 | 32% | 68% |
| Math | 7 | 12% | 88% |
| Social Sci. | 67 | 40% | 60% |
| Humanities | 43 | 15% | 85% |
| Education | 39 | 13% | 87% |
| Health/Nursing | 20 | 9% | 91% |
| Arts/Comm. | 36 | 20% | 80% |
| Other | 27 | 3% | 97% |
Table A53 | Child in or headed to college
“Do you have a child currently enrolled in or planning to attend college?”
| Subgroup | N | Yes | No |
|---|---|---|---|
| Overall | 1,000 | 14% | 86% |
| Party | |||
| Democrat | 318 | 14% | 86% |
| Independent | 316 | 14% | 86% |
| Republican | 279 | 14% | 86% |
| Gender | |||
| Male | 464 | 12% | 88% |
| Female | 536 | 16% | 84% |
| Age | |||
| 18-29 | 162 | 4% | 96% |
| 30-44 | 287 | 17% | 83% |
| 45-64 | 300 | 24% | 76% |
| 65+ | 251 | 7% | 93% |
| Religion | |||
| Protestant | 364 | 15% | 85% |
| Catholic | 187 | 17% | 83% |
| Other Christian | 12 | 16% | 84% |
| Jewish | 21 | 5% | 95% |
| Other faith | 78 | 13% | 87% |
| Atheist/Agnostic | 140 | 10% | 90% |
| Nothing in particular | 198 | 14% | 86% |
| Income | |||
| <$50k | 363 | 11% | 89% |
| $50-100k | 312 | 15% | 85% |
| $100k+ | 243 | 19% | 81% |
| College degree | |||
| Yes | 376 | 20% | 80% |
| No | 624 | 11% | 89% |
| Student loans | |||
| Yes | 123 | 17% | 83% |
| No | 877 | 14% | 86% |
| MAGA | |||
| MAGA Republican | 196 | 12% | 88% |
| Never Trumper | 12 | 25% | 75% |
| Neither | 162 | 20% | 80% |
| Regrets degree | |||
| Regrets | 58 | 10% | 90% |
| No regret | 318 | 22% | 78% |
| College major | |||
| Bus./Finance | 53 | 16% | 84% |
| Eng./CS | 53 | 32% | 68% |
| Natural Sci. | 31 | 13% | 87% |
| Math | 7 | 10% | 90% |
| Social Sci. | 67 | 14% | 86% |
| Humanities | 43 | 31% | 69% |
| Education | 39 | 17% | 83% |
| Health/Nursing | 20 | 30% | 70% |
| Arts/Comm. | 36 | 15% | 85% |
| Other | 27 | 11% | 89% |