

The paper
Sean J. Westwood, Justin Grimmer, Matthew Tyler, and Clayton Nall (2022). Current research overstates American support for political violence. Proceedings of the National Academy of Sciences 119(12), e2116870119.
doi:10.1073/pnas.2116870119 (opens in a new tab) · Replication data: doi:10.7910/DVN/ZEHO8E (opens in a new tab)
Main text
p. 1, Abstract
Published
We reconcile these seemingly conflicting facts with four large survey experiments (n = 4,904)
Correction
We reconcile these seemingly conflicting facts with four large survey experiments (n = 4,897)
Basis The four studies have 1,002, 1,023, 1,863 and 1,009 respondents (pp. 4 and 6), which sum to 4,897.
p. 1, Abstract
Published
Respondent disengagement also inflates the relationship between support for violence and previously identified correlates by a factor of 4.
Correction
Respondent disengagement also inflates the relationship between support for violence and previously identified correlates, by a factor of 1.2 on the Kalmoe–Mason measure and 2.1 on our measure.
Basis The factor of 4 divides the slope for the Kalmoe–Mason measure among all respondents (0.82) by the slope for our measure among engaged respondents (0.20), so it combines a change of measure with disengagement. Holding the measure fixed isolates disengagement; see the correction to pp. 7–8.
p. 2, description of the studies
Published
First, we use two different levels of violence for study 1, study 2, and study 3: assault and murder.
Correction
First, we use two different levels of violence for study 1, study 2, and study 3: assault and attempted murder.
Basis The study 2 and study 3 vignette reports an arrest for attempted murder, and the victim later speaks to reporters (SI Appendix, sections S4.2 and S5.2).
p. 2, Fig. 1B
Published
Fig. 1B (Republicans): blue line marking the smallest estimate from our studies.
Correction
Corrected Fig. 1B. The smallest Republican estimate from our studies is 1.31% (study 2). The published blue line is drawn at 1.1%, which matches none of the estimates.
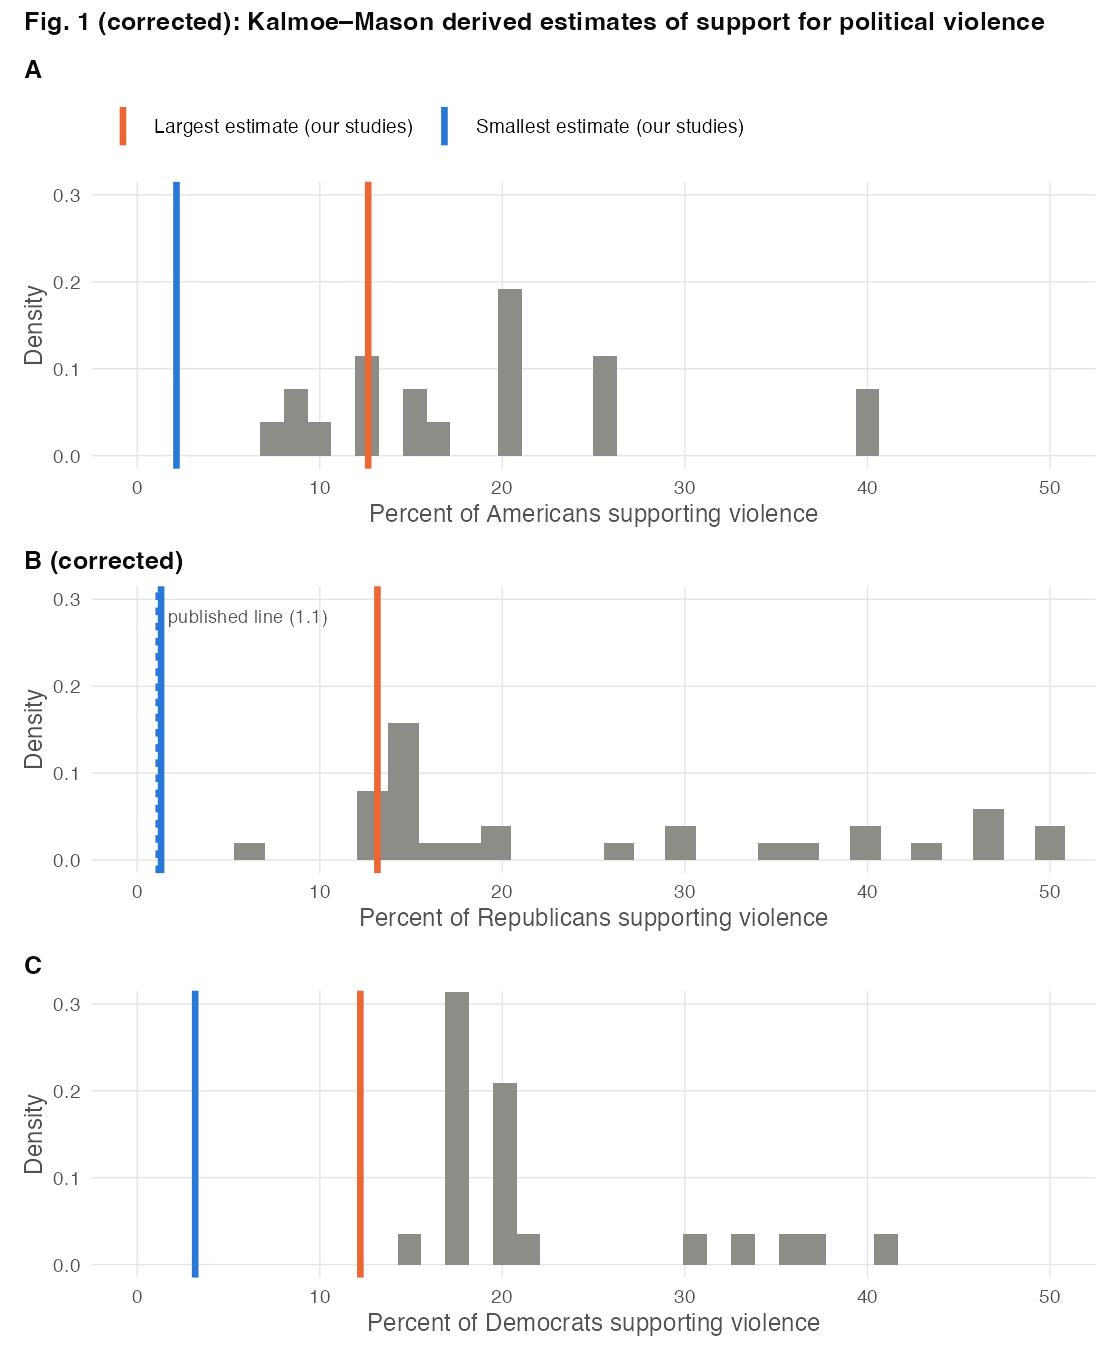
Basis The archived figure1.R types the line positions in by hand. The estimates are the shares of engaged respondents in the in-party condition who support or strongly support the suspect; study 3 gives 1.58% for Republicans. The other five lines match the estimates. The dashed line in panel B marks the published position.
p. 3, Assessing Partisan Differences in Who Commits Political Violence
Published
As we show below, we fail to find a consistent partisan difference—implying that there is little evidence for a general leeway or cheerleading effect. While we find little evidence of partisan cheerleading among all partisans, we might worry that a specific subset of partisans engage in explicit partisan cheerleading.
Correction
As we show below, engaged respondents are more lenient toward in-party than toward out-party perpetrators. The point estimates favor the in-party perpetrator in all nine combinations of study and outcome, and in each study at least one difference remains statistically significant after correction for multiple testing. The differences are small in absolute terms. Political violence receives no more support than otherwise identical apolitical violence.
While this in-party leniency is small among partisans as a whole, we might worry that a specific subset of partisans engage in explicit partisan cheerleading.
Engaged respondents, out-party minus in-party perpetrator (studies 1 and 2 reproduce SI Table S2). HC2 standard errors; study 3 uses the YouGov weights. Holm adjustment across the nine tests. Negative differences in Justified and Support and positive differences in Charged favour the in-party perpetrator. Study Outcome Out-party minus in-party (SE) p Holm-adjusted p N Study 1 Justified −0.076 (0.036) .036 .143 315 Study 1 Support (1-5) −0.246 (0.144) .089 .268 315 Study 1 Charged 0.075 (0.028) .009 .048 315 Study 2 Justified −0.048 (0.017) .006 .041 572 Study 2 Support (1-5) −0.231 (0.052) < 0.001 < 0.001 572 Study 2 Charged 0.007 (0.007) .299 .599 572 Study 3 Justified −0.002 (0.018) .894 .894 1,533 Study 3 Support (1-5) −0.168 (0.058) .004 .030 1,533 Study 3 Charged 0.026 (0.010) .008 .048 1,533 Basis SI Appendix, section S3.5 and Table S2 already report this leniency for studies 1 and 2 (“individuals are more willing to excuse the actions of co-partisans”). The table adds study 3; five of the nine differences remain significant after Holm correction. With the in-party and out-party conditions pooled, political and apolitical violence do not differ among engaged respondents in studies 1 and 2 (smallest p = 0.13).
p. 4, Methods, Measuring Engagement
Published
Respondents who can identify the state where the event in the vignette they just read occurred (information that was repeated in the headline and up to two times in the text) are coded as engaged
Correction
Respondents who can identify the state where the event in the vignette they just read occurred (information that appeared in the headline and up to two times in the text in studies 2 and 3, and only in the text in study 1) are coded as engaged
Basis None of the four study 1 headlines names the state; the Florida headline names Jacksonville (SI Appendix, section S3.2). The study 2 and 3 headline begins “Iowa Man Arrested” (sections S4.2 and S5.2).
p. 4, footnote ‡
Published
SI Appendix, Table S64 shows that removing disengaged respondents does not meaningfully change the demographics of our sample (age, gender, race, partisanship, income, and education).
Correction
SI Appendix, Table S64 shows that older respondents are more likely to pass the engagement check and that, in study 1, White and more educated respondents are as well. In study 1, removing disengaged respondents raises the mean age of the sample from 47.0 to 50.6 years and the White share from 77.6% to 82.6%. This shift changes our estimates little: reweighting engaged respondents in the study 2 in-party condition to the age distribution of the full study 2 sample moves their support for the shooter from 2.15% to 2.33%.
Basis In study 1, 53% of respondents under 30 pass the engagement check against 87% of those 60 and older, and mean age is 50.6 among engaged and 39.2 among disengaged respondents. SI Appendix, section S8 also reports the age, race and education differences. The reweighting uses three age groups (18–34, 35–54, 55 and older).
p. 4, descriptions of studies 1 and 2
Published
In the first story, a Democratic driver was charged with hitting a group of Republicans in Florida who were registering citizens to vote. In the second story, a Republican driver was charged with assault for driving his car through Democratic protesters in Oregon. [...] To test the bounds of support for political violence, this story reported an extreme form of violence: murder. Similar to study 1, participants were randomly assigned to see a story with a Republican or Democratic shooter engaging in politically motivated violence or an apolitical act of murder.
Correction
In the first story, a driver was charged with aggravated assault after driving a van through the tent of a group of Republicans in Florida who were registering citizens to vote; the story does not state the driver’s party, and the analysis treats him as a Democrat. In the second story, a Republican driver was arrested after a caravan of Republicans assaulted Democratic protesters in Oregon with pepper spray and paintballs and drove trucks at unsafe speeds through crowded streets; he was charged with disorderly conduct and interfering with a peace officer. [...] To test the bounds of support for political violence, this story reported an extreme form of violence: a shooting that led to an arrest for attempted murder. Similar to study 1, participants were randomly assigned to see a story with a Republican or Democratic shooter engaging in politically motivated violence or an apolitical shooting.
Basis The vignette texts are in SI Appendix, section S3.2 (study 1: the Florida driver was charged with aggravated assault, criminal mischief and driving with a suspended license; the Oregon driver “was charged with Disorderly Conduct II and Interfering with a Peace Officer”) and section S4.2 (study 2: “arrested for attempted murder”; “The victim later told reporters”).
p. 4, Disengaged Responses Lead to Higher Estimates of Support for Political Violence
Published
We find a similarly high level of support for the apolitical versions, where 20.56% of respondents in study 1 say the driver’s action is justified. [...] with 10.02% of respondents in study 2 describing the political homicide as justified and 6.70% of the respondents describing the apolitical homicide as justified. In study 3, 10.11% described the homicide as justified.
Correction
We find a similarly high level of support for the apolitical versions, where 20.08% of respondents in study 1 say the driver’s action is justified. [...] describing the political shooting as justified and [...] describing the apolitical shooting as justified. In study 3, [...] described the shooting as justified.
Basis The archived study_results.R selects the apolitical condition with alignment != "In-Party Driver" | alignment != "Out-Party Driver", which is true for every respondent, so the printed 20.56% is the share for all study 1 respondents. The apolitical condition alone gives 20.08%. The study 2 and 3 vignette describes a shooting and an arrest for attempted murder (SI Appendix, sections S4.2 and S5.2).
p. 5, text introducing Table 1
Published
First, we show, in Table 1, that the current hypothetical question developed by refs. 1 and 2 (measured here with a balanced Likert with a neutral midpoint) generates overestimates of public support for partisan violence, because of disengaged respondents.
Correction
First, we show, in Table 1, that the current hypothetical question developed by refs. 1 and 2 (measured here with its original unipolar five-point scale, from “Not at all” to “A great deal”, which has no neutral midpoint) generates overestimates of public support for partisan violence, because of disengaged respondents.
Basis In the public data, studies 1 and 2 label the scale “1 - Not at all” to “5 - A great deal”, and study 3 uses “Not at all”, “A little”, “A moderate amount”, “A lot” and “A great deal”. This is the scale described on p. 3. The balanced scale with a neutral midpoint is our own support question.
p. 5, Table 1
Published
Table 1, column “Study 3”: “Disengaged respondents” 41 (354); “Engaged respondents” 19 (1,509); “Combined estimate” 23 (1,863).
Correction
Corrected Table 1. Study 3 has 330 disengaged and 1,533 engaged respondents.
Corrected Table 1. Kalmoe–Mason support for violence measure by engagement. Study 3 percentages use the YouGov survey weights; N is the number of respondents in every column. Percentages are shown to one decimal place. Support for violence Kalmoe–Mason measure % (N) Study 1 Study 2 Study 3 Disengaged respondents 55.0 (312) 42.6 (190) 41.5 (330) Engaged respondents 21.2 (690) 26.4 (833) 18.8 (1,533) Combined estimate 31.7 (1,002) 29.4 (1,023) 23.1 (1,863) Basis The published study 3 Ns (354 and 1,509) are sums of the YouGov survey weights. The weighted percentages are unchanged; the study 3 disengaged share is 41.5%, printed as 41.
p. 6, study 2 results
Published
Results from study 2, where the reported crime was murder, show a more dramatic difference between the engaged and the disengaged. [...] This compares to disengaged respondents where justification peaks at 35.50%, support peaks at 17.10%, [...] Disengaged respondents report support that is ∼8 times greater than engaged respondents.
Correction
Results from study 2, where the reported crime was attempted murder, show a more dramatic difference between the engaged and the disengaged. [...] This compares to disengaged respondents where [...] support peaks at 20.00%, [...] Disengaged respondents report support that is ∼9 times greater than engaged respondents.
Basis Among disengaged study 2 respondents, support is 16.7% in the apolitical condition, 20.0% in the in-party condition and 17.1% in the out-party condition, so 17.10% is the out-party value. Divided by the engaged peak of 2.15%, the peak gives a ratio of 9.3. The study 2 vignette reports an arrest for attempted murder (SI Appendix, section S4.2).
pp. 7–8, Disengaged Respondents Bias Estimates of the Correlates of Political Violence
Published
Fig. 6 shows that, if we use all respondents and the original measure of violence support from ref. 2, moving from the least to most aggressive personalities is associated with an 82 percentage point increase in support for violence. That same shift goes down to 67 percentage points among just the engaged respondents with the original measure. But, if we focus on only the engaged respondents, using our more precise measure, that same large shift from least to most aggressive is associated with a 20 percentage point increase in support for violence. Taken together, using imprecise survey questions and failing to account for disengaged respondents produces a relationship between aggressive personality and support for violence that is ∼4 times too large.
Correction
Fig. 6 shows that, if we use all respondents and the original measure of violence support from ref. 2, moving from the least to most aggressive personalities is associated with an 82 percentage point increase in support for violence. That same shift goes down to 67 percentage points among just the engaged respondents with the original measure, so with the measure held fixed, disengaged respondents inflate the relationship by a factor of 1.2. Our more precise measure is a five-point scale rescaled to run from 0 to 1. In the in-party condition, the same shift is associated with an increase of 0.43 on that scale among all respondents and 0.20 among engaged respondents, a factor of 2.1. Among engaged respondents, it raises the share who support or strongly support the suspect by 10.5 percentage points. Because the two measures are on different scales, the ratio of their slopes does not measure the combined effect of question wording and disengagement. Standardized, the correlation between aggression and support among engaged respondents in the in-party condition is 0.30 for the original measure and 0.22 for ours.
Basis The published 20 is a slope on the rescaled five-point scale, so it is not a percentage-point change. The published factor of about 4 (4.0) divides the Kalmoe–Mason slope among all respondents by our measure's slope among engaged respondents, which mixes two measures, two scales and two samples (all three conditions for the Kalmoe–Mason measure, the in-party condition for ours). The slopes are those in SI Appendix, Table S65.
p. 8, Fig. 6
Published
Fig. 6, panel “Kalmoe–Mason's Measure”, row “All Respondents”: the 95% confidence interval.
Correction
Corrected Fig. 6. The 95% confidence interval for the Kalmoe–Mason measure among all respondents is [0.69, 0.94]. The published figure draws it with zero width.
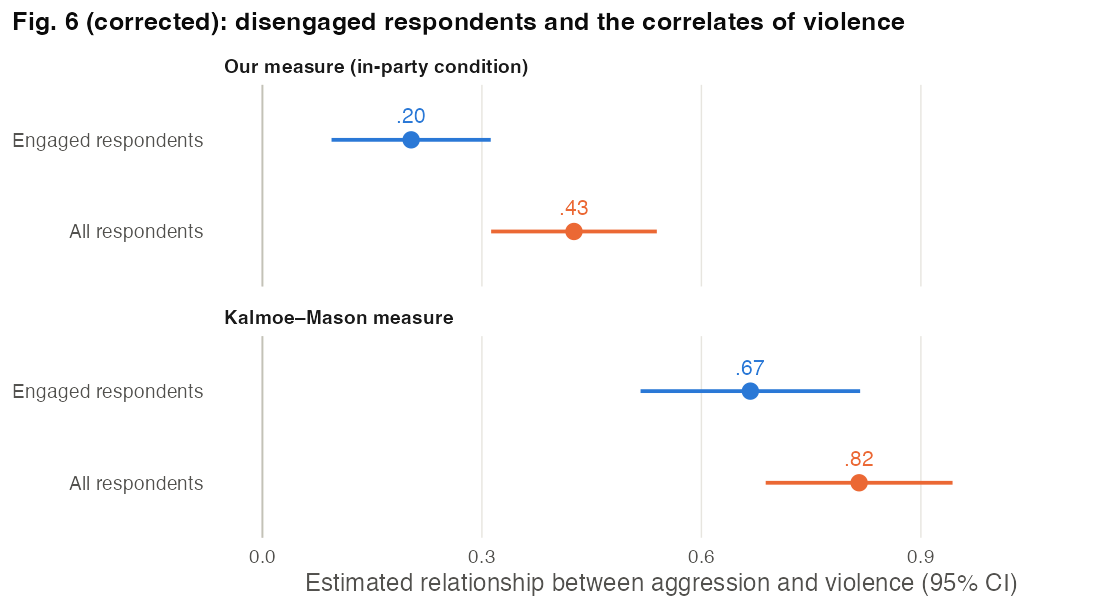
Basis The archived figure7.R sets both ends of that interval to its upper bound (lower = confint(m6)[2,2]). The point estimates are unchanged; see the correction to pp. 7–8 for how they compare.
p. 8, Discussion of partisan cheerleading
Published
but this is unlikely to drive our results, as this represents 3.6% of the sample
Correction
but this is unlikely to drive our results, as this represents 3.8% of the sample
Basis 71 of the 1,863 study 3 respondents are cheerleaders (4.2% with survey weights).
p. 9, partial identification bounds
Published
For example, in the study 3 outcomes asking about murder, [...] We note that 6.3% support is less than the minimum support for violence reported in Fig. 1.
Correction
For example, in the study 3 outcomes asking about attempted murder, [...] We note that 6.86% support is less than the minimum support for violence reported in Fig. 1.
Basis The upper bound reported in the preceding sentence is 6.86%. The smallest estimate in Fig. 1A is 8%, so the comparison holds. The study 3 vignette reports an arrest for attempted murder (SI Appendix, section S5.2).
p. 9, footnote ¶
Published
and with 0 to 20 disengaged support the full population average is [2.63%, 10.14%].
Correction
and with 0 to 20 disengaged support the full population average is [2.63%, 9.07%].
Basis The published interval uses a cap of 25% (the archived partial_id_bounds.R sets b = 0.25 for this outcome). With the 20% cap that the footnote states and that the main text uses for support, the interval is [2.63%, 9.07%]. The other intervals in the footnote are unchanged.