

The paper
Marc S. Jacob, Yphtach Lelkes, Samuel Wolken, and Sean J. Westwood (2026). Systemic electioneering from the evangelical pulpit: Evidence from a computational analysis. Proceedings of the National Academy of Sciences 123(21), e2603911123.
doi:10.1073/pnas.2603911123 (opens in a new tab) · Replication data: osf.io/xruwa (opens in a new tab) · Other public data used: github.com/LibraryOfCongress/data-exploration (opens in a new tab)
Main text
p. 1, Abstract
Published
Our results provide large-scale quantification of political speech from American pulpits that constitutes prohibited electioneering under current Internal Revenue Service (IRS) guidelines, revealing a pattern of base mobilization driven by local partisan context rather than national electoral strategy.
Correction
Our results provide large-scale quantification of political speech from American pulpits that, apart from a small number of passages on ballot measures, constitutes prohibited electioneering under current Internal Revenue Service (IRS) guidelines, revealing a pattern of base mobilization driven by local partisan context rather than national electoral strategy.
Basis IRS guidance treats advocacy on a ballot measure by a 501(c)(3) organization as lobbying, which is permitted when it is an insubstantial part of the organization's activities; the prohibition on political campaign intervention concerns candidates for public office. Of the 1,307 human-verified advocacy passages in the public archive, 17 mention a ballot proposition, a numbered amendment, a ballot measure or a referendum.
p. 1, introduction
Published
This is especially true in the unstructured evangelical community, which accounts for 23% of American Christians (9).
Correction
This is especially true in the unstructured evangelical community, which accounts for 23% of American adults (9).
Basis Ref. 9, the Pew Research Center's 2023–24 Religious Landscape Study, reports evangelical Protestants as 23% of all U.S. adults and Christians as 62%. On those figures evangelicals are about 37% of American Christians.
p. 2, definition of advocacy
Published
Defining advocacy according to IRS guidelines—candidate endorsements or proposition advocacy—we uncover systematic evidence of direct and likely illegal political advocacy in American churches.
Correction
Defining advocacy according to IRS guidelines—support for or opposition to candidates and parties—we uncover systematic evidence of direct and likely illegal political advocacy in American churches. Our counts also include a small number of passages that advocate on ballot propositions, such as the Proposition 1 passage in Table 1; IRS guidelines treat these as lobbying, which churches may engage in within limits.
Basis See the correction to the Abstract on p. 1.
p. 2, Data and Methods
Published
We assessed 497 randomly sampled passages from the first classification stage and estimate precision at 73.8% and passage-level recall at 31.8% (SI Appendix, section 7). Because this audit preceded the second LLM pass and the manual verification step—both designed to eliminate false positives—final precision is substantially higher, while the recall estimate remains a reasonable approximation. The pipeline therefore catches roughly one in three true advocacy passages, but those it ultimately retains are human-verified as genuine. Dividing observed rates by this recall factor yields approximate upper bounds on true prevalence: For example, the 14.7% church-level advocacy rate we report for 2024 could be as high as 46.1%. Our reported rates are therefore best interpreted as conservative lower bounds, with the true values lying between the observed figures and the recall-adjusted upper bounds.
Correction
An independent coder assessed 497 passages that had passed both LLM classification stages and been sent to human verification (SI Appendix, section 7). Against this coder, our final, human-verified labels have a precision of 73.8% and a recall of 31.8% within that pool of passages (Cohen's κ = −0.03). Because every assessed passage had already passed the second LLM pass, the recall estimate does not count advocacy that either LLM pass missed, and recall for the full pipeline is at most 31.8%. Our reported rates are therefore not bounds on true prevalence: counting advocacy missed by the LLM passes would raise them, and excluding verified passages that the independent coder did not judge to be advocacy (26.2% of the verified passages assessed) would lower them. Dividing observed rates by the recall factor, for example from 14.7% to 46.1% of churches in 2024, gives neither an upper nor a lower bound.
Basis All 497 assessed passages appear in the archive's file of passages sent to human verification (excerpts_labeled.csv), which holds 4,021 distinct passages, 5.7% of the 69,919 distinct first-stage passages in round1.csv; a random draw from first-stage output would place about 29 of the 497 there. The archived code (recall_estimation.R) and SI section 7 (“Matching”) score the assessment against the final labels, so 73.8% is the precision of the final labels. The κ of −0.03 is printed by the archived code.
p. 2, Sample Composition
Published
The 1,853 churches in our sample generated sermons [...] The churches represent 935 counties that are predominantly urban (65.9%) and medium-sized (mean population 274,320).
Correction
The 1,852 churches in our sample generated sermons [...] The churches represent 828 counties that are predominantly urban (70.3%) and medium-sized (mean population 298,659).
Basis The archived analysis sample contains 1,852 churches. The published county figures describe all 2,568 locations in the church metadata file, including 490 classified as “other” or “commercial” locations that the analysis excludes. Matching all 2,568 locations by county name to the USDA's 2023 Rural-Urban Continuum Codes reproduces the published figures (urban means a metropolitan county); the corrected figures apply the same codes to the churches in the analysis sample.
p. 2, upload regularity
Published
Upload regularity is high—the typical church covers roughly 72% of Sundays during a four-month election window—and, critically, churches with medium and high regularity show nearly identical advocacy rates
Correction
Upload regularity is high—the typical church covers 92% (2020), 80% (2022) and 67% (2024) of the Sundays in an election window—and, critically, churches with medium and high regularity show nearly identical advocacy rates
Basis The published 72% is the pooled median from SI section 5, which divides each church's covered Sundays by all Sundays from September 1 to December 31 (17 or 18) and pools the five-Sunday May 2021 window. The sermon data span 13, 15 and 15 Sundays in the three election windows (see the correction to SI p. 9). The comparison of regularity terciles is unchanged, because a church's rank within a window does not depend on the denominator.
p. 2, partisan direction of advocacy
Published
Unsurprisingly, 87.5% of references to Republicans were favorable, and 71.3% of references to Democrats were in opposition.
Correction
Unsurprisingly, 87.5% of favorable references were to Republicans, and 71.3% of oppositional references were to Democrats. Of the passages coded favorable or opposed to Republicans, 84.1% were favorable; of those coded favorable or opposed to Democrats, 87.0% were in opposition.
Basis The published percentages divide by all favorable codes and by all oppositional codes, so they give the target of favorable and of oppositional references. The archived classifications_round3.csv has 2,607 rows: 1,307 passages, 1,300 of them repeated exactly. The percentages are the same with the repeats removed.
p. 3, Fig. 1D
Published
Fig. 1D, panel title “Churches political advocacy by county lean”.
Correction
Corrected Fig. 1D: churches binned by their county's 2024 Trump vote share, with one row per church. In 2024, 6.8% of churches in Solid Left counties and 21.2% of churches in Solid Right counties engaged in advocacy.
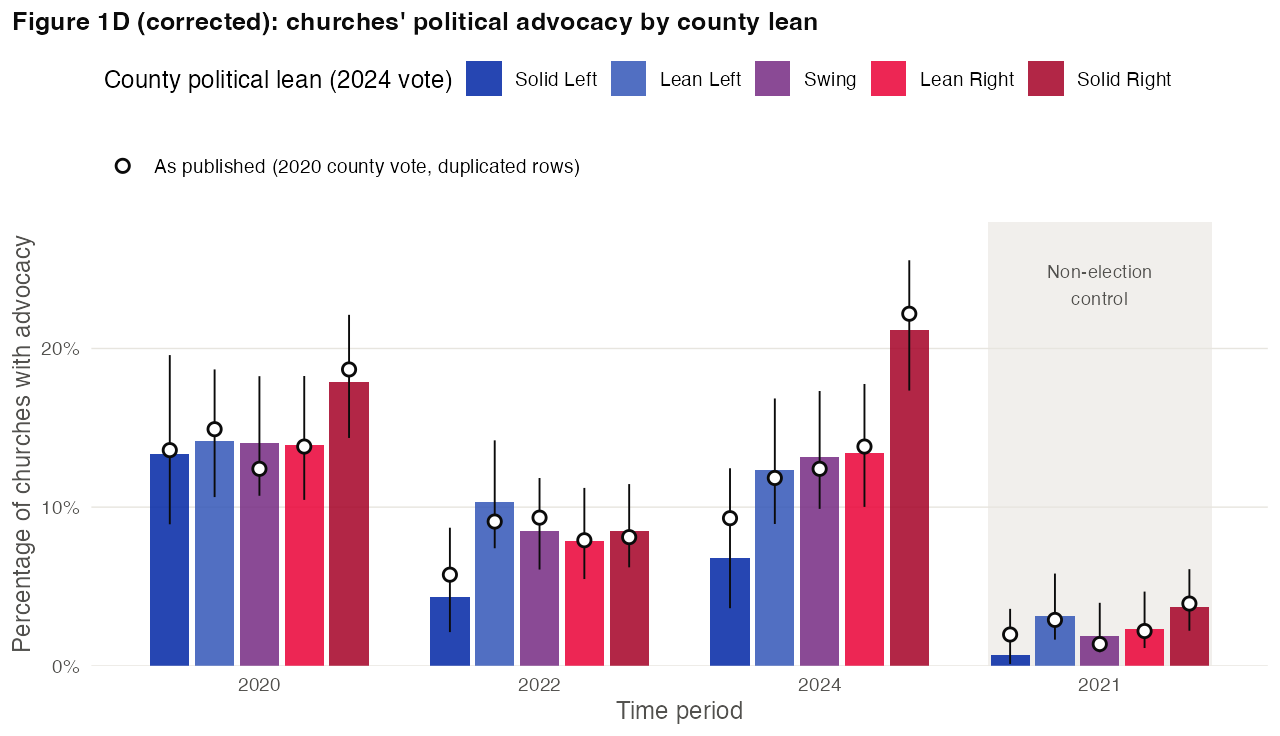
Basis The archived figure code (figure.R) bins churches on the 2020 county vote, while the text and SI section 2 state the 2024 vote. The data preparation (data_cleaning.R) also joins churches to election tables that contain blank state rows and repeated county names (for example, Baltimore County and Baltimore city both appear as “Baltimore”), which turns 6,193 church-years into 7,203 and counts 28 churches up to 59 times. Every church affected by a repeated county name is listed in the county, so the corrected figure uses the county rows. Hollow points show the published estimates.
p. 3, non-election control
Published
Even during nonelection periods, more than 2.6% of churches engaged in political advocacy.
Correction
Even during nonelection periods, 2.6% of churches engaged in political advocacy.
Basis 39 of 1,525 churches (2.56%) in May 2021.
p. 3, Advocacy Rates Covary with Local Partisan Composition
Published
In 2024 in the most Democratic-leaning counties, about 9.3% of churches engaged in political advocacy. In contrast, roughly 22.2% of churches in the most solidly Republican counties did so.
Correction
In 2024 in the most Democratic-leaning counties, about 6.8% of churches engaged in political advocacy. In contrast, roughly 21.2% of churches in the most solidly Republican counties did so.
Basis See the correction to Fig. 1D on this page.
p. 3, References 7 and 8
Published
7. R. P. Burge, “Gen Z and religion in 2021” Religion in Public (2022). https://religioninpublic.blog/2022/06/15/gen-z-and-religion-in-2021/. Accessed 5 May 2026. 8. Internal Revenue Service, Charities, churches and politics (2025). https://www.irs.gov/newsroom/charities-churches-and-politics. Accessed 5 May 2026.
Correction
- M. A. Johnson, “Pulpit politics: Pastors endorse candidates, thumbing noses at the IRS,” NBC News (4 November 2012). https://www.nbcnews.com/news/us-news/pulpit-politics-pastors-endorse-candidates-thumbing-noses-irs-flna1C6859817.
- Joint Motion for Entry of Consent Judgment, National Religious Broadcasters v. Long, No. 6:24-cv-00311 (E.D. Tex. filed 7 July 2025), ECF No. 35.
Basis Ref. 7 is cited on p. 1 for Pulpit Freedom Sunday and the absence of IRS action against participating churches; it does not discuss Pulpit Freedom Sunday, endorsements or the IRS. Ref. 8 is cited for a 2025 IRS court filing; the IRS newsroom page restates the ban on campaign intervention and does not describe a court filing. The NBC News report describes pastors sending their Pulpit Freedom Sunday remarks to the IRS without hearing back, and the July 2025 joint motion is the filing in which the IRS agreed to a consent judgment on churches' speech to their congregations about electoral politics.
Supplementary information
SI section 4.3, p. 8, partisan-direction prompt, Output 6
Published
Output 6: [...] { "favorability": "Republicans", "opposition": "Neither", "party_mentioned": [""], "person_mentioned": ["Donald Trump"] }
Correction
Output 6: { "favorability": "Neither", "opposition": "Democrats", "party_mentioned": [], "person_mentioned": ["Kamala Harris"] }
Basis Text 6 opposes a vote for Harris and names neither Donald Trump nor a party. The published output contradicts the prompt's Core Rule 1 and Example 3, which codes a parallel passage about Harris as opposition to Democrats. The SI presents this prompt as the one applied. In the archived output (classifications_round3.csv), 2 of the 37 passages that name Harris follow the Output 6 pattern (favorable to Republicans, no opposition), and 1 of the 196 passages that list Trump as mentioned does not contain his name.
SI section 5, p. 9, upload coverage
Published
Election windows span September 1 through December 31 for the 2020, 2022, and 2024 cycles; the 2021 non-election control window covers May 1–31. These windows contain 17, 17, 18, and 5 Sundays, respectively. [...] • 2020 (Sep–Dec): N = 1,519 churches, median coverage = 71%, share with coverage >80% < 1%, share with coverage <30% = 9.1%. [...] • 2022 (Sep–Dec): N = 1,691 churches, median coverage = 71%, share >80% < 1%, share <30% = 7.1%. • 2024 (Sep–Dec): N = 1,458 churches, median coverage = 56%, share >80% < 1%, share <30% = 10.4%. • Pooled: N = 6,193 church-windows, median coverage = 72%, share >80% = 16.2%, share <30% = 7.5%. Sparse uploaders (coverage <30%) account for 7–10% of churches across election windows.
Correction
Election windows span the Sundays covered by the sermon data: September 6 to November 29, 2020; September 11 to December 18, 2022; and September 1 to December 8, 2024. The 2021 non-election control window covers May 1–31. These windows contain 13, 15, 15, and 5 Sundays, respectively. [...] • 2020: N = 1,519 churches, median coverage = 92%, share with coverage >80% = 73.1%, share with coverage <30% = 5.3%. [...] • 2022: N = 1,691 churches, median coverage = 80%, share >80% = 48.6%, share <30% = 5.1%. • 2024: N = 1,458 churches, median coverage = 67%, share >80% = 28.1%, share <30% = 8.2%. • Pooled: N = 6,193 church-windows, median coverage = 87%, share >80% = 53.9%, share <30% = 5.6%. Sparse uploaders (coverage <30%) account for 5–8% of churches across election windows.
Basis The sermon data contain no sermons from these windows before or after the dates above, so the published denominators count Sundays on which no church in the data uploaded. With 17 Sundays in the 2020 denominator, no church could exceed 76% coverage, which produced the published share above 80% of less than 1%. The 2021 figures and the advocacy rates by regularity tercile are unchanged, because a church's rank within a window does not depend on the denominator.
SI section 5, p. 10, Implications
Published
the typical church covers roughly 60–75% of Sundays in a four-month election window.
Correction
the typical church covers roughly 67–92% of Sundays in an election window.
Basis See the correction to SI p. 9.
SI section 6, p. 10, panel persistence
Published
In total, 461 churches (24.9%) appear in exactly two cycles
Correction
In total, 461 churches (25.0%) appear in exactly two cycles
Basis 461 of 1,847 churches is 24.96%.
SI section 7, p. 12, sample and results
Published
We drew a random sample of 500 passages from the pool of passages extracted by the Stage 1 LLM (i.e., passages that Stage 1 identified as containing political or advocacy content). [...] • Specificity: 63.2% [54.2%, 71.4%] (74/117 audit-negative passages correctly excluded)
Correction
The 500 passages were drawn from the passages that passed both LLM stages and were sent to human verification. [...] • Specificity: [...] • Cohen's κ between the independent coder and the final labels: −0.03
Basis All 497 passages with substantive text appear in the archive's file of passages sent to human verification; see the correction to p. 2. The archived code (recall_estimation.R) computes κ; the SI does not report it.
SI section 7, p. 13, Bounding true advocacy rates
Published
Bounding true advocacy rates. We can use the recall estimate to place approximate bounds on the true prevalence of advocacy. [...] • 2020: sermon-level observed = 1.2%, corrected = 3.6% [3.2%, 4.2%]; church-level observed = 14.7%, upper bound = 46.1%. [...] 1. Church-level correction is an upper bound, not a point estimate. [...] The true church-level rate therefore lies between the observed value and the upper bound, likely closer to the observed value for churches with many sermons.
Correction
Adjusting observed rates. The recall estimate comes from passages that had already passed both LLM stages, so it does not count advocacy that either stage missed, and a precision below 1 means that some verified passages are not advocacy in the independent coder's judgment. Adjusting the observed sermon-level rates for both precision and recall within this pool (observed × 73.8% / 31.8%, a factor of 2.32) gives 2.7% (2020), 0.9% (2021), 1.3% (2022) and 2.8% (2024), against observed rates of 1.2%, 0.4%, 0.5% and 1.2%. These adjusted rates omit advocacy missed by the LLM stages, so they are not bounds. Dividing a church-level rate by passage-level recall (for example, 14.7% to 46.1% in 2024) gives neither an upper nor a lower bound on the true church-level rate.
Basis See the corrections to p. 2 and SI p. 12.
SI section 7, p. 14, Implications
Published
The advocacy rates reported in the main text should be interpreted as conservative lower bounds on the true prevalence of political advocacy in sermons. The pipeline’s high precision means that the patterns we identify—temporal spikes around elections, variation by county partisanship—reflect genuine advocacy rather than measurement noise.
Correction
The advocacy rates reported in the main text are not bounds on the true prevalence of political advocacy in sermons: counting advocacy missed by the LLM stages would raise them, and excluding verified passages that the independent coder did not judge to be advocacy (26.2% of the verified passages assessed) would lower them. Against the independent coder, the final labels have a precision of 73.8% and a Cohen's κ of −0.03.
Basis See the corrections to p. 2 and SI p. 12.