

The paper
Johann D. Gaebler, Sean J. Westwood, Shanto Iyengar, and Sharad Goel (2025). No news is good news? The declining information value of broadcast news in America. PLOS One 20(10), e0331607.
doi:10.1371/journal.pone.0331607 (opens in a new tab) · Replication data: github.com/jgaeb/no-news (opens in a new tab)
Main text
p. 1, Abstract
Published
Despite the rise of digital media, Americans are five times more likely to consume news via television than through online platforms.
Correction
Despite the rise of digital media, Americans consume roughly five times as much news via television as through online platforms.
Basis The cited source, Allen et al. (2020) [2], measures time spent: 54 minutes of television news against 9.7 minutes of online news per day. On reach, the same source reports that essentially everyone is exposed to some television news and that 44% of its sample saw no online news at all. The Introduction (“by a factor of five to one [2]”) states the ratio correctly.
p. 4, Data
Published
(We begin our formal analyses with 1969, the first full year of data.)
Correction
(Our analyses include the broadcasts from August 5 to December 31, 1968, which Figs 2, 3 and 4 show as the year 1968; 1969 is the first full year of data.)
Basis The analysis code (analyze.R) applies no date filter. The 1,093,885 segments counted on p. 5 and the 19,806 news days on p. 6 include 6,526 segments from 308 broadcasts on 105 days in 1968, and the first point in each of Figs 2, 3 and 4 is 1968. In Fig 3, for example, campaign coverage takes 27.5% of news time in 1968, a presidential election year, and 6.0% in 1969. The Fig 2 caption gives the period of that figure as “between 1969 and 2024”. Fig 5 and the comparisons of 1969 with 2024 in the text use 1969 alone. See also the correction to S1 Appendix p. 1.
p. 5, Data
Published
Of the 1,093,885 total segments in our corpus, 626,056 have abstracts and are not commercials.
Correction
Of the 1,093,885 total segments in our corpus, 622,154 have abstracts and are not commercials.
Basis Counted in the public replication database with the filters in analyze.R, which reproduce the total of 1,093,885 exactly. The printed 626,056 is the number of non-commercial segments that received model labels. It includes 3,902 segments that the database flags as having no abstract, which the analysis counts as empty segments in Fig 2 and leaves out of the topic shares in Fig 3.
p. 6, Classification
Published
To ensure the accuracy of our model-generated labels, we compare the model-generated classifications for each of the three dimensions—viz., whether an abstract covers hard or soft news, and the topic and issue to which it most closely relates—to human experts’ categorizations. We find that model-generated labels closely match those produced by human experts, with human experts agreeing with model and with each other at roughly the same rate; see S5 Fig and S1 Appendix.
Correction
To ensure the accuracy of our model-generated labels, we compare the model-generated classifications for each of the three dimensions—viz., whether an abstract covers hard or soft news, and the topic and issue to which it most closely relates—to the categorizations of crowd-sourced annotators recruited through Prolific. We find that model-generated labels closely match those produced by these annotators, with annotators agreeing with the model and with each other at roughly the same rate; see S5 Fig and S1 Appendix.
Basis The S1 Appendix describes the raters as 334 English-speaking adults located in the U.S. recruited through Prolific. The survey code in the public repository (qualtrics.py) builds an anonymous survey for Prolific with a consent form, instructions and the rating questions, and no screen for expertise. The comparison itself stands: the model agrees with the plurality label about as often as individual raters do. The same wording is corrected on pp. 11 and 12 and in the S1 Appendix (pp. 2 and 8).
p. 7, Fig 2
Published
Fig 2, “News Content”: the high-quality non-issue (light green) and low-quality non-issue (turquoise) bands.
Correction
Corrected Fig 2, with man-made disasters counted as high-quality non-issue news, as the text on p. 7 and S4 Table state. High-quality and low-quality non-issue news come to 1.50 and 0.90 minutes per broadcast in 1969 (published figure: 1.46 and 0.94) and 4.06 and 2.10 minutes in 2024 (published figure: 3.90 and 2.26).
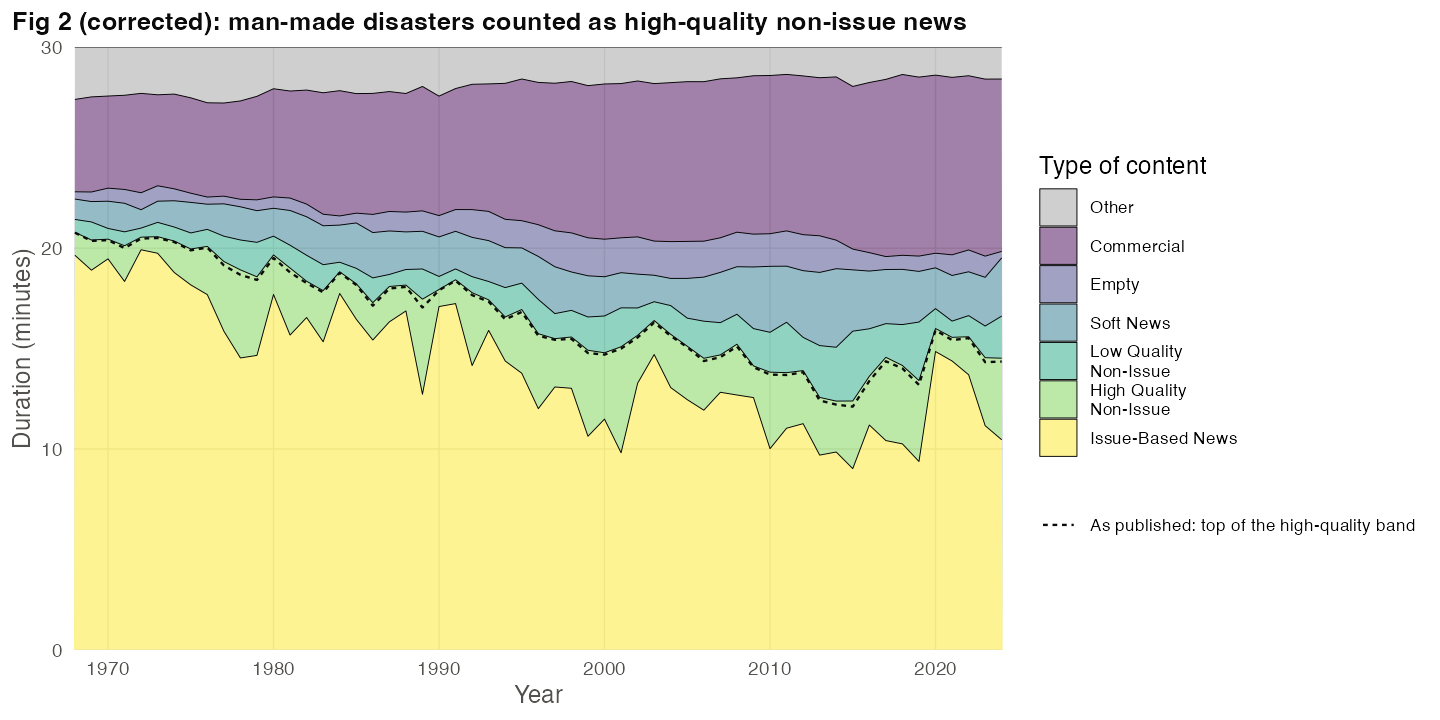
Basis In analyze.R, high_quality_indices is c(1:5, 8, 9, 12), and other.py numbers Man-Made Disasters 13, so the published figure counted man-made disasters as low-quality. The dashed line marks the top of the published high-quality band; the largest shift is 0.42 minutes, in 1989. The other bands are unchanged.
p. 9
Published
Coverage of natural disasters—shown in the top central panel—rose from a few percentage points of coverage to almost a sixth of a typical newscast in 2024.
Correction
Coverage of natural disasters—shown in the top central panel—rose from a few percentage points of coverage to about one seventh of news time (14.1%) in 2024.
Basis On the denominator Fig 3 plots (news time among non-commercial segments with abstracts), natural disasters account for 14.1% of news time in 2024 and 14.6% in 2023, against 1.4% to 2.2% in 1969-1975.
p. 11, Discussion
Published
LLMs performed well overall, performing at a comparable level to human expert annotators (see S1 Appendix)
Correction
LLMs performed well overall, performing at a comparable level to crowd-sourced human annotators (see S1 Appendix)
Basis See the correction to p. 6.
p. 12, Supporting information (S5 Fig)
Published
S5 Fig: A comparison of the classification accuracy of the LLM classification pipeline described in the main text and human experts;
Correction
S5 Fig: A comparison of the classification accuracy of the LLM classification pipeline described in the main text and crowd-sourced human annotators;
Basis See the correction to p. 6.
Supplementary information
S1 Appendix p. 1, Additional notes on data
Published
we limit our analysis to ABC, CBS, and NBC from 1969, the first complete year in our data, to the end of 2024.
Correction
we limit our analysis to ABC, CBS, and NBC from the start of our data on August 5, 1968, to the end of 2024; 1969 is the first complete year in our data.
Basis See the correction to p. 4 of the article.
S1 Appendix p. 1, Additional notes on data
Published
To avoid distorting our estimates, we exclude any segment lasting longer than 30 minutes. Together, these two exclusion criteria cover approximately 0.4% of segments in our data.
Correction
To avoid distorting our estimates, we exclude any segment lasting longer than 30 minutes. Together, these two exclusion criteria cover approximately 1.4% of segments in our data (15,578 of 1,116,940 ABC, CBS, and NBC segments). We also exclude 7,477 evening-news segments that air before a broadcast's opening “Preview” or “Introduction” segment or after its closing “Goodnight” segment.
Basis Counted in the public replication database: 14,917 segments come from special programs outside the three evening newscasts, and 661 evening-news segments last longer than 30 minutes. The last sentence describes the in_news filter that analyze.R applies; the repository precomputes the flag and gives its rule in commented code.
S1 Appendix p. 2, Validation study
Published
To investigate the quality of our LLM-based news classification pipeline, we conducted a validation study comparing its performance to that of human experts. [...] We then tabulated the number of experts who chose each possibility [...] Overall, our LLM-based pipeline produced results of similar quality to human experts’ labels: both human experts and our pipeline chose a soft news designation [...] Two randomly chosen experts classified whether news was hard or soft identically [...] The labels produced by our pipeline matched a randomly chosen human expert’s selections almost exactly as often. [...] however, the performance of our LLM pipeline is almost precisely on par with that of human experts.
Correction
To investigate the quality of our LLM-based news classification pipeline, we conducted a validation study comparing its performance to that of crowd-sourced human annotators. [...] We then tabulated the number of annotators who chose each possibility [...] Overall, our LLM-based pipeline produced results of similar quality to the annotators’ labels: both the annotators and our pipeline chose a soft news designation [...] Two randomly chosen annotators classified whether news was hard or soft identically [...] The labels produced by our pipeline matched a randomly chosen annotator’s selections almost exactly as often. [...] however, the performance of our LLM pipeline is almost precisely on par with that of the annotators.
Basis See the correction to p. 6 of the article.
S1 Appendix p. 8, S5 Fig caption and legend
Published
S5 Fig.: A comparison of the performance of the LLM classification pipeline described in the main text and human experts. The left-hand panel shows the probability that the pipeline label and a randomly chosen human expert’s label match the “ground truth” plurality classification [...] The right-hand panel shows the probability that the labels of two randomly chosen experts (red) and the label produced by a randomly chosen expert and the LLM pipeline (blue) match. [...] resampling both expert raters and rated segments. Overall, the LLM pipeline and human experts perform similarly.
S5 Fig legend: “Rater”: “Human Experts”, “Model”.
Correction
S5 Fig.: A comparison of the performance of the LLM classification pipeline described in the main text and crowd-sourced human annotators. The left-hand panel shows the probability that the pipeline label and a randomly chosen annotator’s label match the “ground truth” plurality classification [...] The right-hand panel shows the probability that the labels of two randomly chosen annotators (red) and the label produced by a randomly chosen annotator and the LLM pipeline (blue) match. [...] resampling both annotators and rated segments. Overall, the LLM pipeline and the annotators perform similarly. (Legend: Rater: Human Annotators, Model.)
Basis See the correction to p. 6 of the article.