

The paper
Sean J. Westwood (2025). The potential existential threat of large language models to online survey research. Proceedings of the National Academy of Sciences 122(47), e2518075122.
doi:10.1073/pnas.2518075122 (opens in a new tab) · Replication data: osf.io/ektqr (opens in a new tab) · Other public data used: doi:10.7910/DVN/HUKSID (opens in a new tab)
Main text
p. 1, Abstract
Published
achieving a 99.8% pass rate on 6,000 trials of standard attention checks.
Correction
achieving a 100% pass rate on 6,000 trials of standard attention checks.
Basis The 10 responses scored as failures all comply with their items. In 5 responses to the Berinsky item that asks respondents to “just ignore the choices below”, the empty selection is recorded as “[]”, and the scoring code (Figure5-Attention.R) accepted only a blank. In 5 answers to the question about what the law professor said about the Klan, the paraphrase of his statement refers to the Klan as “them” or “em”, and the scoring code required the word “Klan” or “KKK”. See also the corrections to pp. 5 and 6 and to SI Table S28.
p. 3, Section 2.1.1
Published
This behavior was widespread, with 7 of 9 other LLMs also defaulting to the human persona.
Correction
This behavior was widespread, with most of the eight other LLMs also defaulting to the human persona.
Basis Section 2 lists nine LLMs in total, o4-mini among them, so eight other models were tested. The archive contains no output from this test, so the exact count cannot be recovered. If the printed 7 counts the other models, the count is 7 of 8; if it counts all nine models, it is 6 of 8.
p. 3, Section 2.1.2
Published
the synthetic respondent achieved an overall accuracy of 74.8%. [...] it correctly identified its own assigned state capital at a much higher rate (90.7%). Importantly, its performance was calibrated by its assigned education level: synthetic respondents with a postgraduate profile achieved 95.5% accuracy, whereas those with a profile of “less than high school” education answered correctly only 30.0% of the time
Correction
the synthetic respondent achieved an overall accuracy of 75.8%. [...] it correctly identified its own assigned state capital at a much higher rate (99.0%). Importantly, its performance was calibrated by its assigned education level: synthetic respondents with a postgraduate profile achieved 96.3% accuracy, whereas those with a profile of “less than high school” education answered correctly only 30.9% of the time
Basis The scoring code (Figure2-Context.R) selects the answers with QID1:QID50, but the archived file stores them in the order QID1, QID10–QID19, QID2, …, QID5, QID50, QID6–QID9. The published figures therefore omit Colorado, Connecticut, Delaware and Florida and count the 17 personas who live in those states as missing their own capital. The 132 answers of “St. Paul” for Minnesota were also scored wrong. The corrected figures score all 50 states and accept “St. Paul”; with “St. Paul” scored wrong they are 75.0% overall and 96.3% for the own state.
p. 3, Fig. 2A
Published
Fig. 2A, “State Capital Knowledge by Education Level” (distribution of the percentage of capitals correct, scored on 46 states).
Correction
Corrected Fig. 2A, scored on all 50 states with “St. Paul” accepted.
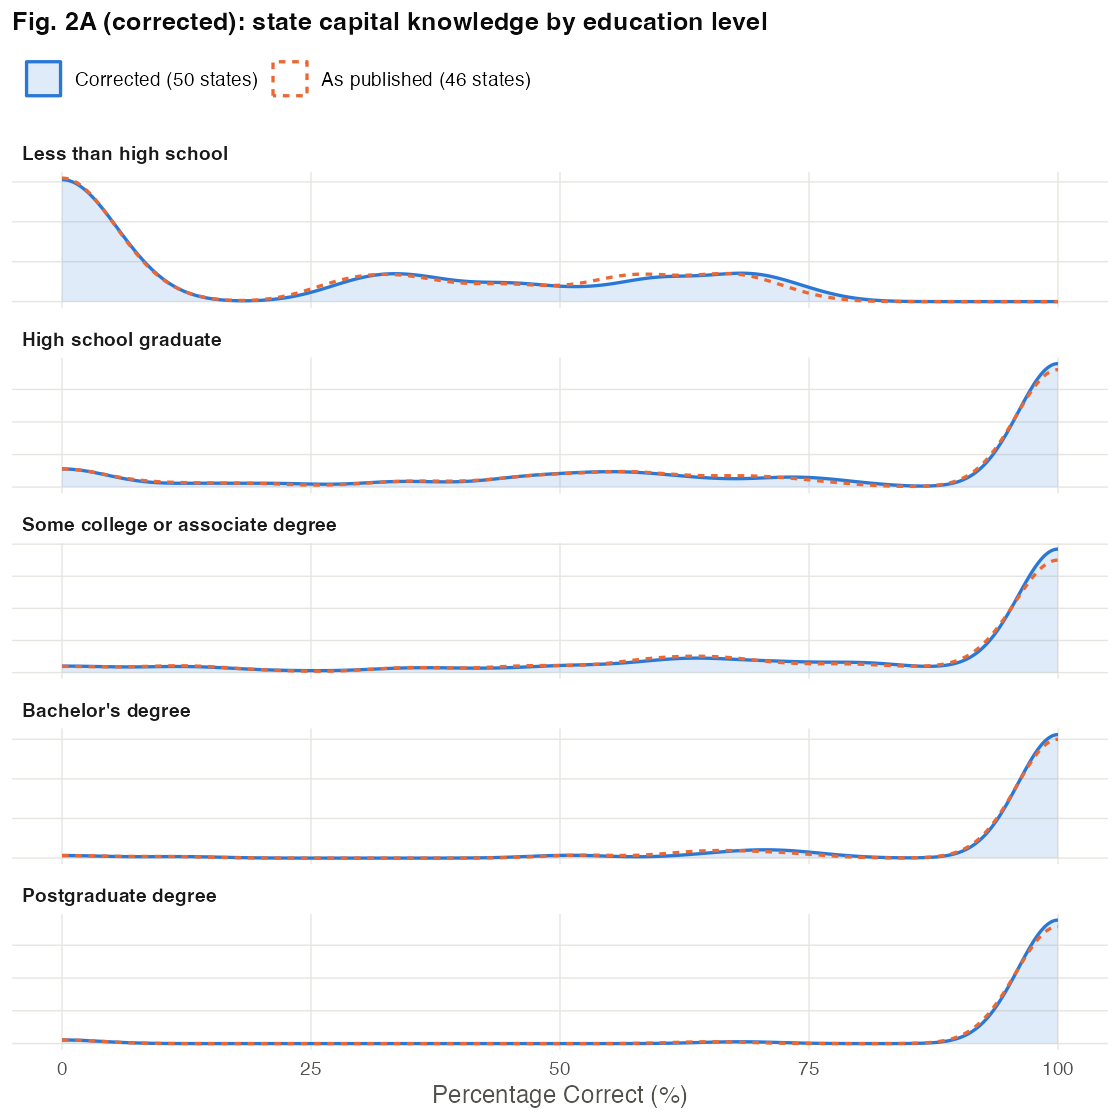
Basis Dashed lines show the published scoring (46 states). Both curves use a smoothing bandwidth of 4 percentage points. See the correction to Section 2.1.2.
p. 3, Section 2.1.2 and Fig. 2 legend
Published
For example, reported monthly rent scaled with income, from an average of $591 (95% CI [$518, $663]) for the lowest income bracket to $2,154 (95% CI [$1,960, $2,349]) for the highest. The synthetic respondent also correctly inferred that older personas were more likely to own their homes (94.3% for those over 65 vs. 0% for those under 30). Demonstrating cross-question coherence, the number of bathrooms reported scaled logically with rent paid [...] (B) (Middle) shows that reported rent is conditional on both state and income.
Correction
For example, the reported monthly housing payment (rent or mortgage, with $0 for personas who own outright) scaled with income, from an average of $591 (95% CI [$518, $663]) for the lowest income bracket to $2,154 (95% CI [$1,960, $2,349]) for the highest. The synthetic respondent also correctly inferred that older personas were more likely to own their homes outright (94.3% for those over 65 vs. 0% for those under 30; counting homes owned with a mortgage, 97.2% vs. 33.6%). Demonstrating cross-question coherence, the number of bathrooms reported scaled logically with the monthly housing payment [...]
(B) (Middle) shows that the reported monthly housing payment (rent or mortgage) is conditional on both state and income.
Basis The survey item asks for the monthly rent or mortgage payment, and personas who own outright report $0 (17% to 28% of each income bracket). The 94.3% and 0% are shares owning outright; SI Table S14 shows that 33.6% of personas under 30 own with a mortgage.
p. 4, Section 2.1.3
Published
the α for one of the three scales was below conventional thresholds (Need for Cognition α = 0.99, Big Five α = 0.70, and Need for Chaos α = 0.49)
Correction
the α for one of the three scales was below conventional thresholds (Need for Cognition α = 0.99, Big Five α = 0.73 averaged over the five two-item subscales, whose alphas range from 0.57 to 0.86, and Need for Chaos α = 0.49)
Basis The archived code (Figure3-Scales.R) computes only the five subscale alphas printed in Fig. 3. No calculation from it gives 0.70: the median of the subscale alphas is 0.71, and the alpha of the ten items pooled is 0.61.
p. 5, Fig. 4A
Published
Fig. 4A, “Within-Dataset Response Similarity”: “Followup” 0.084, “Change Government” 0.083, “Most Important Problem” 0.072.
Correction
Corrected Fig. 4A, computed over all pairs of responses in each dataset (300 per dataset): Change Government 0.070, Followup 0.070, Most Important Problem 0.064.
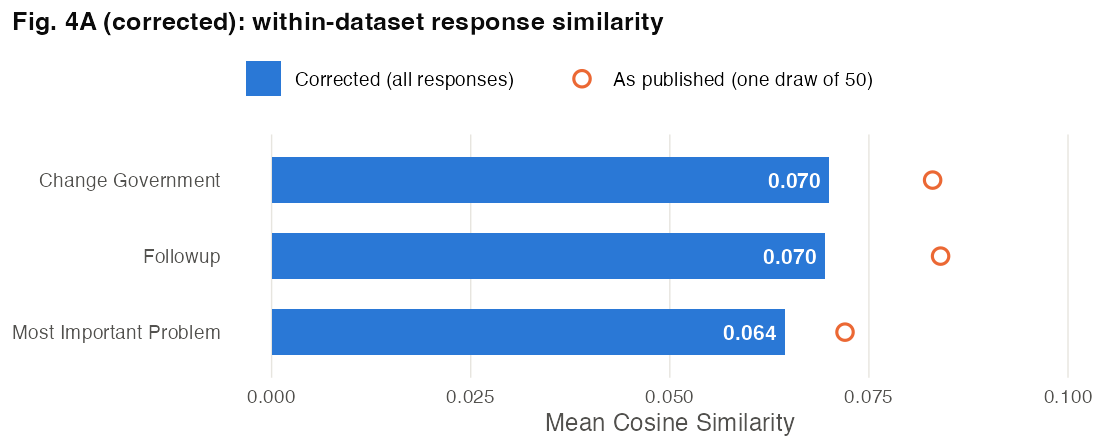
Basis The published values come from a single random draw of 50 responses per dataset taken without a seed (Figure4-Language.R), so they cannot be regenerated; SI Table S22 reports a different draw. Across 500 repeated draws of 50 responses, 94%, 85% and 57% of draws fall at or below the published Followup, Change Government and Most Important Problem values. Hollow points show the published values. The responses remain diverse on the full samples.
p. 5, Section 2.1.5
Published
Moreover, as shown in Table 2, vocabulary complexity (Pearson’s r = 0.50), misspelling rate (r = –0.37), and proper capitalization (r = 0.23) all correlated positively with assigned education level.
Correction
Moreover, as shown in Fig. 4 and SI Appendix, Table S26, vocabulary complexity (Pearson’s r = 0.50) and proper capitalization (r = 0.23) correlated positively with assigned education level, and misspelling rate correlated negatively (r = −0.37).
Basis Table 2 shows example responses; the correlations are reported in SI Table S26.
p. 5, Section 2.2.1
Published
Across 6,000 total trials (20 questions × 300 repetitions), the synthetic respondent committed only 10 errors, achieving an overall pass rate of 99.8% and scoring perfectly on 18 of the 20 ACQ types.
Correction
Across 6,000 total trials (20 questions × 300 repetitions), the synthetic respondent committed no errors, achieving an overall pass rate of 100% and scoring perfectly on all 20 ACQ types.
Basis See the correction to the Abstract (p. 1).
p. 6, Fig. 5A and legend
Published
(A) (Top) shows a 99.8% pass rate on standard attention checks.
Fig. 5A: “Reading Comprehension (n=9)” and “Instruction Following (n=8)” each 99.8% passed, 0.2% failed. The sentence above is from the Fig. 5 legend.
Correction
Corrected Fig. 5A: every category passes at 100%. Legend: “(A) (Top) shows a 100% pass rate on standard attention checks.”
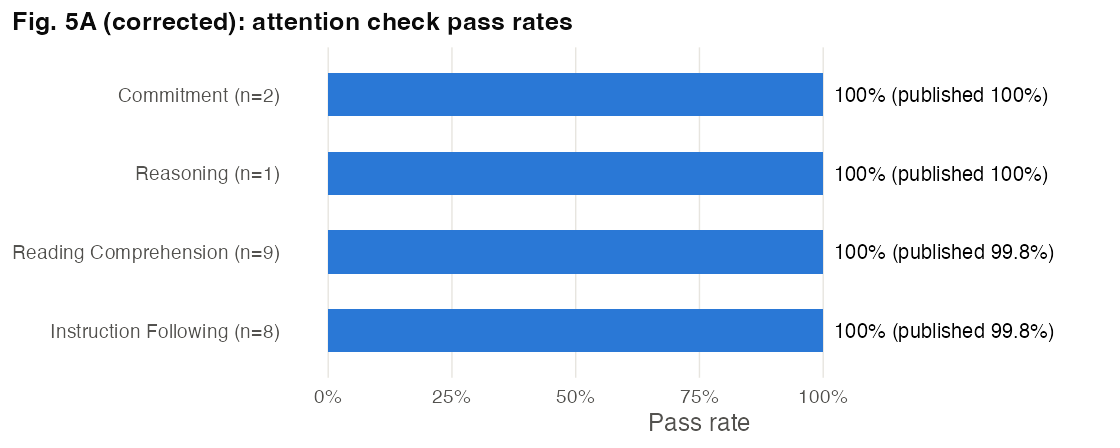
Basis See the correction to the Abstract (p. 1).
p. 7, Section 2.3.2
Published
For instance, net presidential approval swung from a baseline of 34% to 98.3% under the pro-Republican directive and to 0% under the pro-Democrat directive (Fig. 7B).
Correction
For instance, the share approving of the president swung from a baseline of 34.3% to 98.3% under the pro-Republican directive and to 0% under the pro-Democrat directive (Fig. 7B).
Basis The three figures are shares approving strongly or somewhat, as in Fig. 7B and SI Table S34. Net approval (approve minus disapprove) at baseline is −30.3 points.
p. 7, Section 2.3.3
Published
I collected seven top-tier national polls conducted in the final week of the campaign (average n = 1,599). [...] a remarkably small number of synthetic respondents, between just 10 and 52, could have injected enough biased responses to flip the prediction of which candidate was leading. To not only flip the outcome but move the new result outside the poll’s margin of error would have required only 55 to 97 synthetic respondents (SI Appendix, section S3.6.2).
Correction
I collected seven top-tier national polls conducted between October 20 and November 4, 2024, 5 of them in the final week of the campaign (average n = 1,599). [...] a remarkably small number of synthetic respondents, between just 19 and 52 in the 3 polls that showed a leader (the other 4 were tied), could have injected enough biased responses to flip the prediction of which candidate was leading. To not only flip the outcome but move the new result outside the poll’s margin of error would have required only 30 to 97 synthetic respondents (SI Appendix, section S3.6.2).
Basis From SI Table S35, the respondents needed to flip the leader (Resp. Diff.) range from 19.5 to 51.9 in the polls with a leader and are 0 in the tied polls, and the respondents needed to move the result outside the margin of error (Resp. Diff. + MOE) range from 30.0 to 97.3. CNN/SSRS and NYT/Siena were fielded October 20–23, 2024.
p. 8, Section 2.3.3
Published
The results show that even this limited intervention—injecting fewer than 30 biased responses into each targeted sample of 1,500—is sufficient to erode a candidate’s lead in the aggregate in a close election, making a narrow advantage appear to be a statistical tie.
Correction
The results show that even this limited intervention—injecting 30 biased responses into each targeted sample of 1,000—is sufficient to erode a candidate’s lead in the aggregate in a close election, making a narrow advantage appear to be a statistical tie.
Basis The simulation code (Figure-Simulation.R) and SI Appendix use 1,000 respondents per poll and 30 synthetic respondents in each poisoned poll. Over 20,000 simulated ten-poll series with these settings, candidate A’s lead in the aggregate falls on average from 2.0 points in the clean polls to 0.5 points after poisoning, and candidate B leads the poisoned aggregate in 31% of series. SI Table S36 reports a single draw, in which a 1.5-point lead becomes −0.1.
p. 8, Section 2.4
Published
yielding a 22.2-percentage-point increase in hypothesis-confirming answers over the original experiment (31) and a 24.4-percentage-point increase over a later replication (30).
Correction
yielding a 22.2-percentage-point increase in hypothesis-confirming answers over the original experiment (31) and a 24.2-percentage-point increase over a later replication (30).
Basis On the share favoring a strike, the difference between the democracy and non-democracy conditions is −33.7 points for the synthetic respondent and −9.4 points in Mummolo and Peterson’s baseline arm, a gap of 24.2 points. Fig. 8D as published plots Mummolo and Peterson’s difference in 0–1 means (−8.25), which gives a gap of 25.4 points. Neither comparison, nor the same comparison with their other demand arms, gives 24.4. See the correction to Fig. 8.
p. 8, Fig. 8
Published
Fig. 8. (A) Mummolo & Peterson correct guesses: 23.6% (Favor a U.S. Strike of a Non-Democracy), 28% (Favor a U.S. Strike of a Democracy). (B) “Mummolo & Peterson Support: 50% (SE: 1.1)”, “Diff.: .07 (p<.01)”. (C) “Mummolo & Peterson Support: 41% (SE: 1.1)”, “Diff.: −.18 (p<.01)”. (D) “Difference in Percent Favoring a U.S. Strike”, Mummolo and Peterson (2019) plotted at −8.25.
Correction
Corrected Fig. 8, with every comparison on the share favoring a strike. (A) Mummolo and Peterson’s respondents guessed the purpose correctly in 28.0% of cases in the non-democracy condition and 23.6% in the democracy condition. (B) Synthetic respondent 56.7% favor (SE 2.9); Mummolo and Peterson 38.9% favor (SE 1.6); difference +0.18 (p < .001). (C) Synthetic respondent 23.0% favor (SE 2.4); Mummolo and Peterson 29.4% favor (SE 1.5); difference −0.06 (p = .024). (D) Mummolo and Peterson’s effect on the share favoring is −9.4 percentage points (95% CI [−13.9, −5.0]); the synthetic effect is −33.7 (95% CI [−41.4, −26.0]).
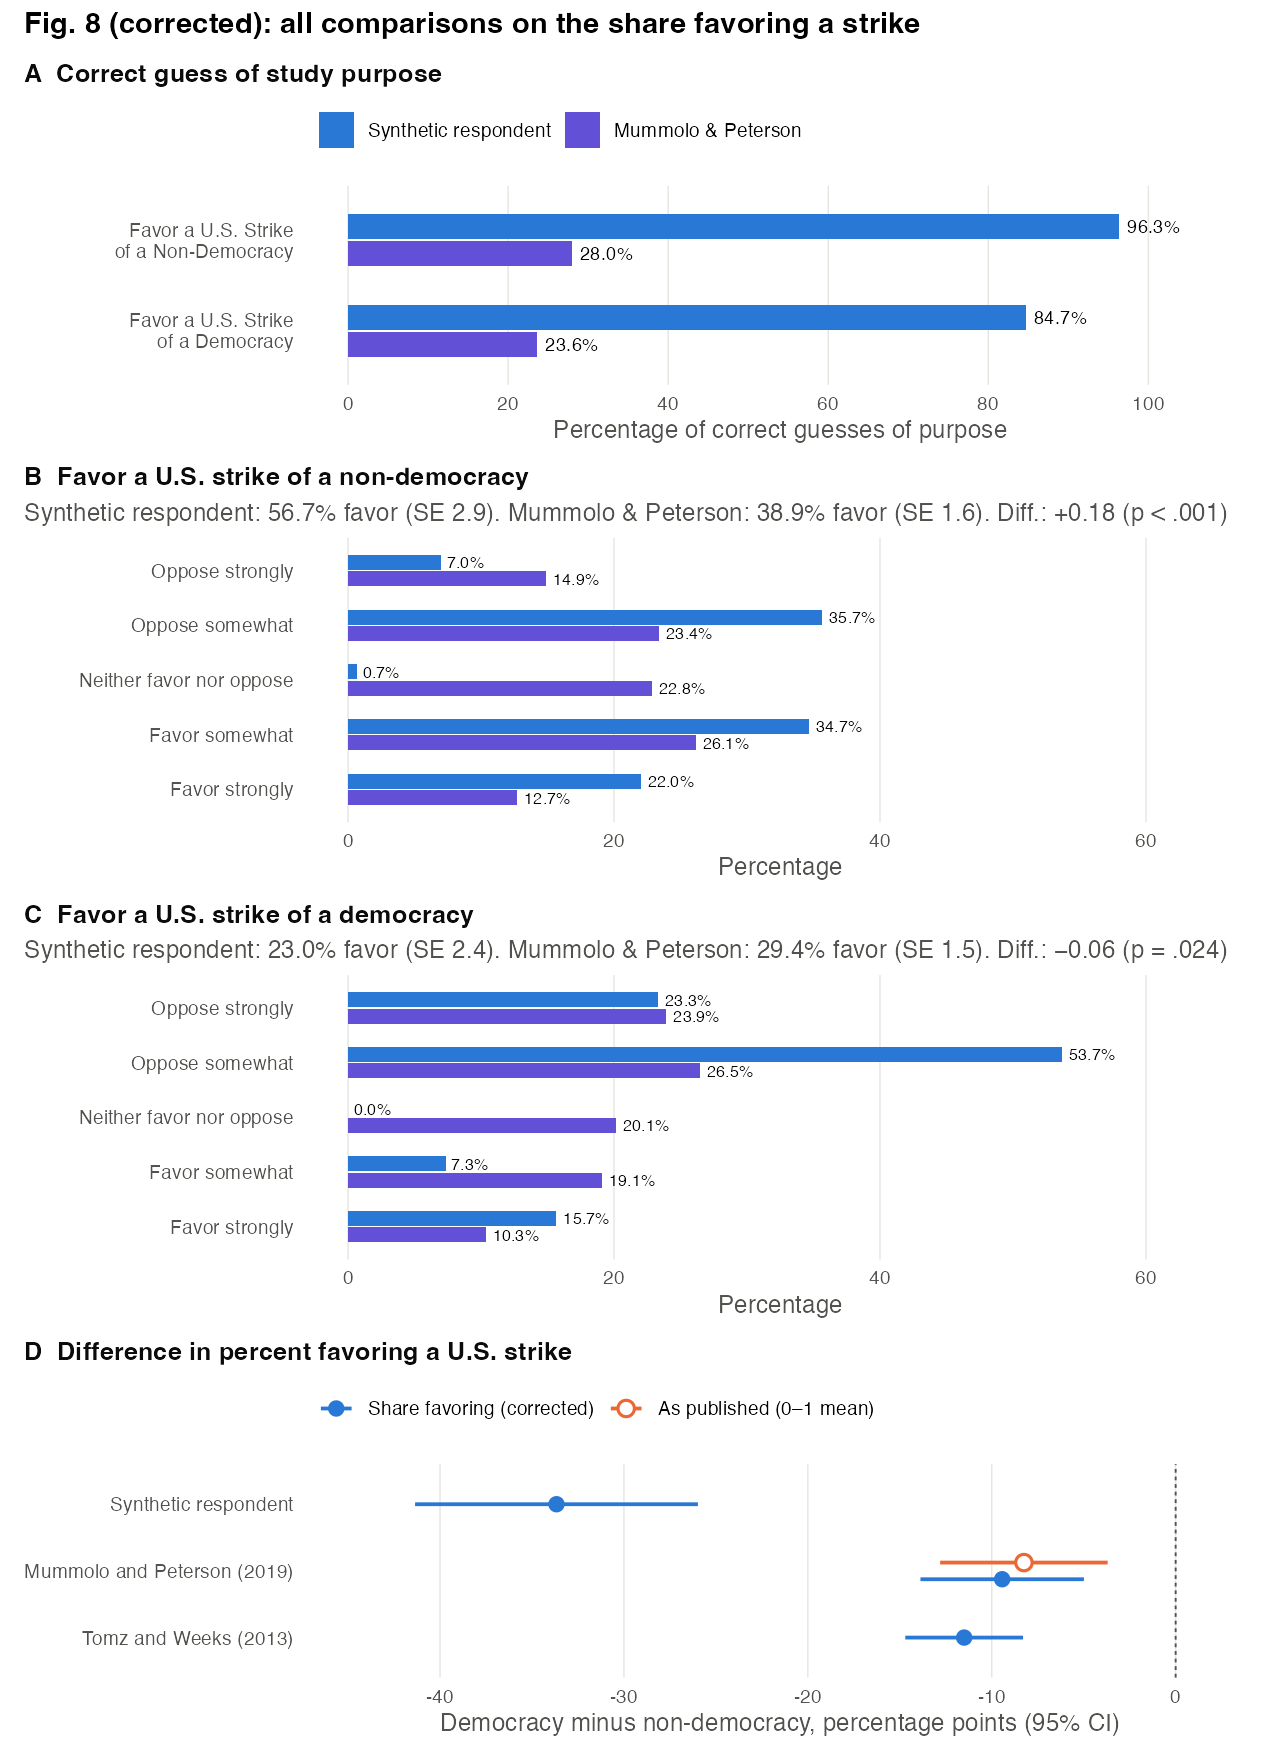
Basis The published panels set the synthetic share favoring a strike against Mummolo and Peterson’s mean on a 0–1 scale (0.496 and 0.414), and panel D plotted their difference in 0–1 means (−8.25, hollow point) under a title that refers to percent favoring. SI Appendix, section S5.1 describes the recode to share favoring for the synthetic data only. Panel A attached each human guess rate to the other condition. Human values are from Mummolo and Peterson’s baseline arm (N = 880 non-democracy and 948 democracy; Harvard Dataverse doi:10.7910/DVN/HUKSID). On the share scale, the synthetic effect exceeds Mummolo and Peterson’s by 24.2 percentage points and Tomz and Weeks’s by 22.2.
Supplementary information
SI p. 32, Table S11
Published
Table S11 (“State Capital Knowledge Performance by Education Level”): “Overall” 74.83 [71.2, 78.46], “Own State Correct (%)” 90.7.
Correction
Corrected Table S11, all 50 states scored, with “St. Paul” accepted.
Corrected Table S11: all 50 states scored, with “St. Paul” accepted for Saint Paul. Education Level N Mean % Correct [95% CI] Own State Correct (%) Overall 300 75.85 [72.2, 79.5] 99.0 Less than high school 26 30.85 [20.48, 41.22] 96.2 High school graduate 82 70.8 [63.63, 77.97] 98.8 Some college or associate degree 101 76.24 [70.5, 81.98] 100.0 Bachelor's degree 55 90.51 [84.88, 96.14] 100.0 Postgraduate degree 36 96.33 [90.67, 101.99] 97.2 Basis See the correction to p. 3, Section 2.1.2.
SI p. 38, Table S22
Published
Sample size limited to 50 responses per dataset for computational efficiency.
Table S22 (“Within-Dataset Response Similarity by Survey Type”): “Change Government” 0.085, “Followup” 0.075, “Most Important Problem” 0.067 (“N Responses” 300). The sentence above is from the table note.
Correction
Corrected Table S22, computed over all pairs of responses in each dataset.
Corrected Table S22: mean cosine similarity over all pairs of responses in each dataset (no subsampling). Survey Dataset N Responses Mean Cosine Similarity Change Government 300 0.070 Followup 300 0.070 Most Important Problem 300 0.064 Basis See the correction to p. 5, Fig. 4A.
SI p. 41, Table S28
Published
Table S28 (“Attention Check Performance by Category”): “Reading Comprehension” and “Instruction Following”, “Pass Rate (%)” 99.8, “Fail Rate (%)” 0.2.
Correction
Corrected Table S28.
Corrected Table S28: attention-check performance with the two scoring rules corrected. Category Questions Total Responses Pass Rate (%) Fail Rate (%) Commitment 2 600 100 0 Reasoning 1 300 100 0 Reading Comprehension 9 2,700 100 0 Instruction Following 8 2,400 100 0 Basis See the correction to the Abstract (p. 1).
SI p. 47, Appendix: Simulation of a Coordinated Attack on Poll Aggregations, Model Parameters
Published
Number of Injected Bots (nbots): The number of synthetic respondents added to each poisoned poll. Value: 30 (2% of the sample size)
Correction
Number of Injected Bots (nbots): The number of synthetic respondents added to each poisoned poll. Value: 30 (3% of the sample size)
Basis The sample size is 1,000. See the correction to p. 8, Section 2.3.3.