

The paper
Sean J. Westwood and Erik Peterson (2022). The Inseparability of Race and Partisanship in the United States. Political Behavior 44(3), 1125–1147.
doi:10.1007/s11109-020-09648-9 (opens in a new tab) · Replication data: doi:10.7910/DVN/IXOMN4 (opens in a new tab)
Main text
p. 1125, Abstract
Published
We find support for this in three behavioral game experiments with 5496 respondents.
Correction
We find support for this in three behavioral game experiments with 5,194 respondents.
Basis The analytic samples are 1,697 (Study 1), 1,975 (Study 2) and 1,522 (Study 3, white and Black respondents; see the correction to p. 1135).
pp. 1133-1134
Published
However, in a dose-response pre-test discussed in the supporting materials, we found that this average value is perceived by participants as a “negative” result.
Correction
However, in a dose-response pre-test discussed in the supporting materials, which used whole-dollar amounts, participants rated $4, the amount closest to this average, below “probably yes” when asked whether Player 1 trusted them (mean 3.60 on a five-point scale).
Basis With every response coded (see the correction to SI section 1), 57.5% of ratings at $4 say Player 1 probably or definitely trusted Player 2 and 9.2% say probably or definitely not. The choice of $7 and $8 for the positive condition is unaffected.
p. 1135, description of Study 3
Published
(n = 1824; again recruited via Qualtrics Panels with the same criteria as the first two studies)
Correction
(n = 1,522 white and Black respondents; again recruited via Qualtrics Panels with the same criteria as the first two studies)
Basis The text prints 1,824; the published Study 3 analysis used 1,814 respondents. That sample included 292 respondents who are neither white nor Black (172 Hispanic, 88 Asian, 32 other), whose out-race feeling thermometer the code set to 50. Footnote 1 limits the paper to white and African American respondents, and Study 1 applies that restriction. All Study 3 results below are re-estimated on the 1,522 white and Black respondents.
p. 1136, Figure 3c
Published
Figure 3c, Study 3 (partisan treatment): out-partisan affect and parallel updating to out-racial affect.
Correction
Figure 3c re-estimated on white and Black respondents. Out-partisan affect: −18.68 [−21.30, −16.07]. Out-racial affect: −7.76 [−9.92, −5.61].
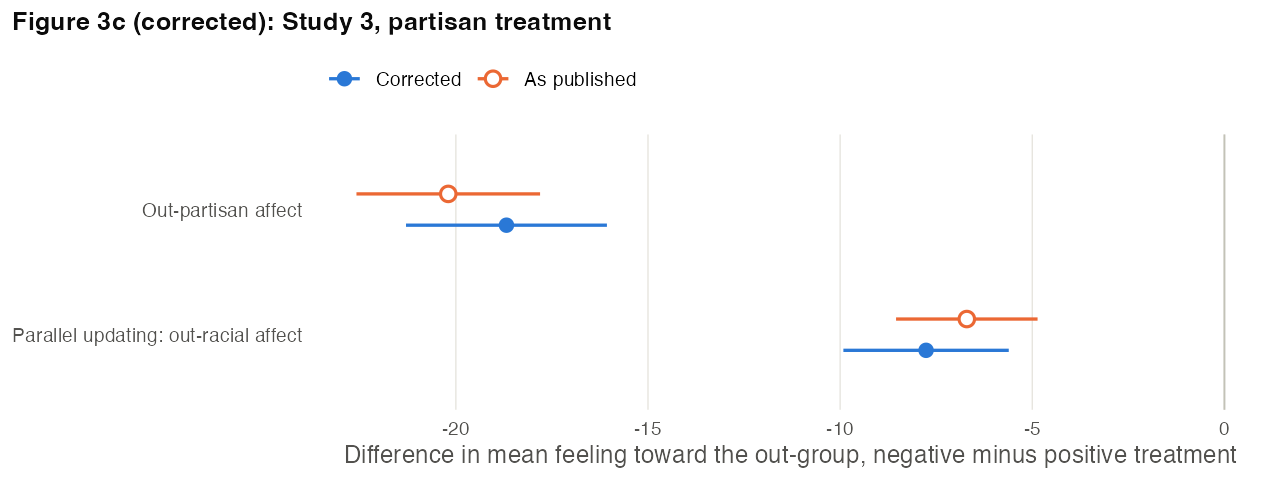
Basis Hollow points show the published estimates (N = 1,814).
p. 1138
Published
The average out-party affect among those assigned to have a negative interaction with an out-partisan was 32.01 points. Meanwhile, in the positive interaction condition, mean out-party affect crossed the midpoint of the scale and reached 52.21 points, a mean difference of −20.20 points (95% confidence interval [−22.59, −17.81]). [...] and a smaller effect on the racial outcome measure (77% of the size of the effect from race to partisanship)
Correction
The average out-party affect among those assigned to have a negative interaction with an out-partisan was 33.19 points. Meanwhile, in the positive interaction condition, mean out-party affect crossed the midpoint of the scale and reached 51.87 points, a mean difference of −18.68 points (95% confidence interval [−21.30, −16.07]). [...] and a smaller effect on the racial outcome measure (90% of the size of the effect from race to partisanship)
Basis Re-estimated on white and Black respondents. The partisan-outcome effect is 1.99 times the Study 1 effect of the racial treatment on racial affect, so “nearly twice as large” stands.
pp. 1138-1139
Published
Mean out-race affect in the negative (partisan) treatment was 55.64 points, while mean out-race affect in the positive (partisan) treatment was 62.34 points, for a difference of −6.70 points (95% confidence interval [−8.54, −4.86]).
Correction
Mean out-race affect in the negative (partisan) treatment was 56.80 points, while mean out-race affect in the positive (partisan) treatment was 64.56 points, for a difference of −7.76 points (95% confidence interval [−9.92, −5.61]).
Basis Re-estimated on white and Black respondents.
p. 1140
Published
We also find no interaction between the treatment and the randomly assigned partisanship of Player 1 for out-race affect (β = − 1.51, 95% confidence interval [−6.36, 3.33]), or out-party affect (β = − 1.11, 95% confidence interval [−5.49, 3.28]).
Correction
We also find no interaction between the treatment and the randomly assigned partisanship of Player 1 for out-race affect (β = −1.11, 95% confidence interval [−5.49, 3.28]), or out-party affect (β = −1.51, 95% confidence interval [−6.36, 3.33]).
Basis The text swapped the two estimates. In Table A7, −1.51 is the out-party interaction and −1.11 the out-race interaction.
p. 1141
Published
(β = −
− 0.06, 95% confidence interval [−0.71, $0.58)Correction
(β = −$0.06, 95% confidence interval [−$0.71, $0.58])
p. 1142
Published
the difference is not significant in an interaction model (mean difference = −4.62, 95% confidence interval [−9.39 0.14]). The positive treatment continued to increase out-race affect relative to the negative condition for those with sorted out-groups (mean difference = −8.94, 95% confidence interval [−11.92,−5.96]) and those with cross-cutting out-groups (mean difference = −4.57, 95% confidence interval [−6.77, −2.36]).
Correction
the difference is not significant in an interaction model (difference in mean differences = −2.76, 95% confidence interval [−7.10, 1.58]). The positive treatment continued to increase out-race affect relative to the negative condition for those with sorted out-groups (mean difference = −8.94, 95% confidence interval [−11.92, −5.96]) and those with cross-cutting out-groups (mean difference = −6.18, 95% confidence interval [−9.25, −3.12]).
Basis The published −4.62 is the interaction from the out-party model. The corrected estimate comes from the out-race model, on white and Black respondents, written as the sorted mean difference minus the cross-cutting mean difference. The conclusion that the difference is not significant is unchanged (p = .21).
p. 1143, Figure 4c
Published
Figure 4c, Study 3: parallel updating to out-racial affect for sorted and cross-cutting out-groups.
Correction
Figure 4c re-estimated on white and Black respondents. Sorted out-groups: −8.94 [−11.92, −5.96]. Cross-cutting out-groups: −6.18 [−9.25, −3.12].
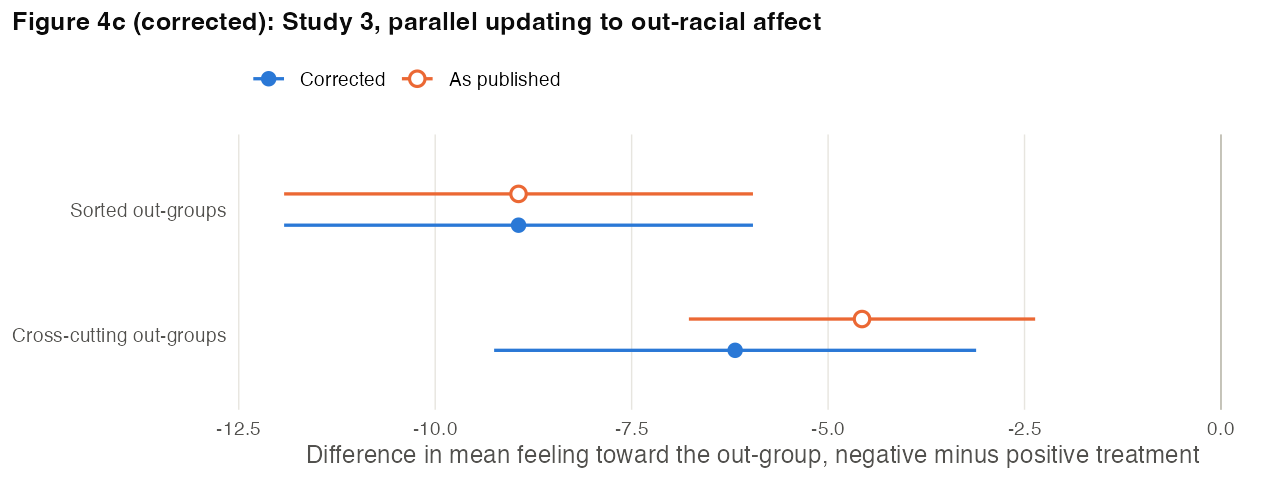
Basis Hollow points show the published estimates.
pp. 1146-1147, References
Published
Hainmueller, J, Mummolo, J, & Yiqing, X. (2019). How much should we trust estimates from multiplicative interaction models? Simple tools to improve empirical practice. Political Analysis, [...] Halpern, D., & Rodriguezm, P. (2018). Partisan representations: [...] Suhay, E., Bello-Pardo, E., & Maurer, B. (2017). The polarizing effects of online partisan criticism: Evidence from two experiments. International Journal of Press, 23(1), 95–115. Wyer, J., Robert, S., & Srull, T. K. (2014). Advances in social cognition: A dual process model of impression formation (Vol. I). Hove: Psychology Press.
Correction
Hainmueller, J., Mummolo, J., & Xu, Y. (2019). How much should we trust estimates from multiplicative interaction models? Simple tools to improve empirical practice. Political Analysis, 27(2), 163–192.
Halpern, D., & Rodriguez, P. (2018). Partisan representations: [...]
Suhay, E., Bello-Pardo, E., & Maurer, B. (2018). The polarizing effects of online partisan criticism: Evidence from two experiments. The International Journal of Press/Politics, 23(1), 95–115.
Brewer, M. B. (1988). A dual process model of impression formation. In T. K. Srull & R. S. Wyer, Jr. (Eds.), Advances in social cognition (Vol. 1, pp. 1–36). Hillsdale, NJ: Erlbaum. (Reissued 2014, Hove: Psychology Press.)
Supplementary information
SI section 1, p. 3
Published
We determined, through pre-testing, that the mean allocation amount in trust games conducted in the US (approximately $4) is perceived as a negative result among those assigned to play as Player 2. [...] A sample of 2,229 users reviewed the same instructions [...] Participants completed the task four times (giving us a total of 9,196 observations).
Correction
We determined, through pre-testing, that the mean allocation amount in trust games conducted in the US (approximately $4) falls below “probably yes” on perceived trust among those assigned to play as Player 2 (mean 3.60 at $4). [...] A sample of 1,037 users reviewed the same instructions [...] Participants completed the task four times (giving us a total of 4,148 observations).
Basis Counts are from the deposited pre-test file with the authors' filter (gc = 1). The published 2,229 and 9,196 are also inconsistent with each other: four ratings from 2,229 users would give 8,916 observations.
SI p. 3, Figure A1
Published
Figure A1: Perceived Trust by Allocation Amount (From Player 1 to Player 2)
Correction
Corrected Figure A1. The published code recoded the response labels “Probably no” and “Definitely no”, but the data use “Probably not” and “Definitely not”, so all 726 ratings in the two lowest categories were dropped. With every response coded, mean trust at $0 is 2.05 (published curve: 3.61), and the curve crosses 4 at about $5.7 (published: $5.2). The selected positive values remain above 4 (4.14 at $7 and 4.26 at $8).
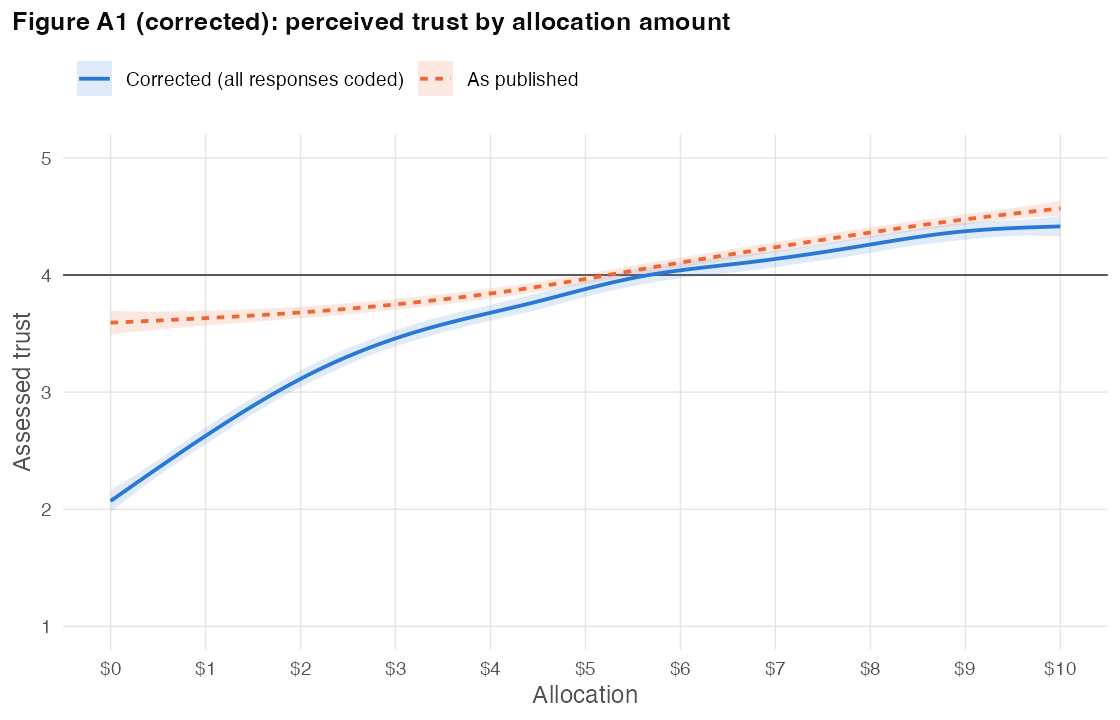
Basis Smoothed as in the published figure (a generalized additive model).
SI Tables A1-A6 (Study 1 sample demographics)
Published
Tables A1-A6, including Table A6 (“Age”): mean 37.09.
Correction
Corrected Tables A1-A6, computed on the 1,697 respondents in the Study 1 analysis.
Corrected Tables A1-A6: Study 1 analytic sample (N = 1,697). Table Category Value A1: Gender Female 0.39 A1: Gender Male 0.61 A2: Race/Ethnicity White/Caucasian 0.86 A2: Race/Ethnicity African American 0.14 A3: Partisanship Democrat 0.49 A3: Partisanship Republican 0.51 A4: Income Less than 30,000 0.27 A4: Income 30,000-39,999 0.14 A4: Income 40,000-49,999 0.10 A4: Income 50,000-59,999 0.11 A4: Income 60,000-69,999 0.06 A4: Income 70,000-79,999 0.07 A4: Income 80,000-89,999 0.04 A4: Income 90,000-99,999 0.04 A4: Income 100,000 or more 0.16 A5: Education Less than High School 0.02 A5: Education High School / GED 0.21 A5: Education Some College 0.28 A5: Education 2-year College Degree 0.12 A5: Education 4-year College Degree 0.24 A5: Education Masters Degree 0.10 A5: Education Doctoral Degree 0.01 A5: Education Professional Degree (JD, MD) 0.02 A6: Age Mean 49.91 Basis The published tables describe 4,048 respondents before the analysis filters, and the published mean age uses Q13 + 2 although the authors' own recoding is Q13 + 16 (Q13 runs from 1 to 84).
SI section 3.3, p. 11
Published
An index was created by generating a mean across the four items.
Correction
An index was created by generating a mean across the four items, coded so that higher values indicate more racial resentment (Cronbach's alpha = 0.81).
Basis The published index (study1.R) counted one item twice, left out another and mixed item directions; its alpha is 0.03. Table A9 is re-estimated below.
SI p. 12, Table A9
Published
Table A9, estimated with the published index; note: “p<0.1; *p<0.05; *p<0.01”.
Correction
Corrected Table A9. The interactions are −0.29 and −3.64 (joint p = .40), so racial resentment still does not moderate the treatment effect. Stars now use the cutoffs of the other tables.
Corrected Table A9: four-item racial resentment index. Standard errors in parentheses; * p<0.05; ** p<0.01; * p<0.001. Term Out-Party Affect Positive Treatment 10.283* (2.121) Racial Resentment Second Tercile 9.426* (2.070) Racial Resentment Third Tercile 3.039 (2.115) Positive Treatment X Racial Resentment Second Tercile −0.289 (3.002) Positive Treatment X Racial Resentment Third Tercile −3.640 (3.000) Constant 30.758* (1.471) Observations 1,693 SI p. 14, Table A16 (Study 2 age)
Published
Table A16 (“Age”): mean 31.69.
Correction
Mean age 45.69.
Basis Age is Q13 + 16, the recoding in the authors' demographic script. Tables A11-A15 are unchanged.
SI pp. 16-17, Tables A18-A23 (Study 3 sample demographics)
Published
Tables A18-A23, including Table A19 (“Race/Ethnicity”): “African American” 0.10, “White/Caucasian” 0.90; Table A23 (“Age”): mean 34.83.
Correction
Corrected Tables A18-A23, computed on the 1,522 white and Black respondents in the corrected Study 3 analysis.
Corrected Tables A18-A23: Study 3 analytic sample, white and Black respondents (N = 1,522). Table Category Value A18: Gender Female 0.43 A18: Gender Male 0.57 A19: Race/Ethnicity White/Caucasian 0.89 A19: Race/Ethnicity African American 0.11 A20: Partisanship Democrat 0.52 A20: Partisanship Republican 0.48 A21: Income Less than 30,000 0.26 A21: Income 30,000-39,999 0.12 A21: Income 40,000-49,999 0.10 A21: Income 50,000-59,999 0.13 A21: Income 60,000-69,999 0.07 A21: Income 70,000-79,999 0.07 A21: Income 80,000-89,999 0.04 A21: Income 90,000-99,999 0.04 A21: Income 100,000 or more 0.18 A22: Education Less than High School 0.02 A22: Education High School / GED 0.23 A22: Education Some College 0.26 A22: Education 2-year College Degree 0.12 A22: Education 4-year College Degree 0.23 A22: Education Masters Degree 0.10 A22: Education Doctoral Degree 0.01 A22: Education Professional Degree (JD, MD) 0.03 A23: Age Mean 49.55 Basis The published tables describe 5,126 respondents before the analysis filters, and the published mean age uses Q13 + 2.
SI p. 18, Table A24
Published
Table A24, estimated on 1,814 respondents (row “Positive Treatment X Player 1 and Participant Same Race”: −4.943 for out-race affect).
Correction
Corrected Table A24, white and Black respondents. The out-race interaction is −7.769.
Corrected Table A24: white and Black respondents. Estimates with standard errors in parentheses. Term Out-Race Affect Out-Party Affect Positive Treatment 11.484 (1.513) 19.460 (1.842) Player 1 and Participant Same Race 3.922 (1.558) 0.253 (1.897) Participant Party - Republican 2.679 (1.089) 5.171 (1.325) Positive Treatment X Player 1 and Participant Same Race −7.769 (2.178) −1.734 (2.651) (intercept) 53.611 (1.202) 30.615 (1.463) Observations 1,522 1,522 R2 0.044 0.124 SI p. 19, Table A25
Published
Table A25, columns 3 (“Democrats”, N = 1,002) and 4 (“Republicans”, N = 812).
Correction
Corrected columns 3 and 4, white and Black respondents. Columns 1 (Whites) and 2 (Blacks) are unchanged.
Corrected Table A25, columns 3 and 4: white and Black respondents. 95% confidence intervals in parentheses. Column Positive Treatment Constant Observations Democrats 7.248 (4.290, 10.206) 55.769 (53.662, 57.877) 792 Republicans 8.267 (5.154, 11.379) 57.932 (55.692, 60.171) 730