

The paper
Sean J. Westwood (2022). The Partisanship of Bipartisanship: How Representatives Use Bipartisan Assertions to Cultivate Support. Political Behavior 44(3), 1411–1435.
doi:10.1007/s11109-020-09659-6 (opens in a new tab) · Replication data: doi:10.7910/DVN/2CD3VZ (opens in a new tab)
Main text
p. 1412
Published
With a new collection of 434,266 floor speeches made between 1994 and 2018, I show that legislators do not constrain bipartisan claims to bills with meaningful support from both parties.
Correction
With a new collection of 434,266 floor speeches made between 1995 and 2018, I show that legislators do not constrain bipartisan claims to bills with meaningful support from both parties.
Basis The paper gives three start dates for the speech corpus: 1994 (p. 1412), 1992 (p. 1416 and footnote 3) and the 104th Congress (p. 1417). The deposited daily speech data (figure3.csv) run from January 4, 1995 to May 21, 2018, the 104th through 115th Congresses, as p. 1417 and the Figure 3 caption state.
p. 1414
Published
his work investigating Louis Lerner was bipartisan
Correction
his work investigating Lois Lerner was bipartisan
p. 1414, definition and valence survey
Published
To demonstrate this point, I surveyed 1,055 respondents drawn by Survey Sampling International (SSI).
Correction
To demonstrate this point, I surveyed 1,186 respondents drawn by Survey Sampling International (SSI), 1,055 of whom placed bipartisanship on the valence scale.
Basis The deposited survey file (figure1_2.csv) has 1,186 respondents. The definition shares in Fig. 2a use all 1,186 as the denominator, with blank or missing definitions counted as incorrect. The published 1,055 is the number of valid answers to the valence question in Fig. 2b.
p. 1416 and footnote 3
Published
To do this I use the full set of congressional floor speeches [...] made between 1992 and 2018 (434,266 speeches) to measure invocations of bipartisanship. [Footnote 3] Floor speeches were downloaded from the Library of Congress. I started in 1992 because of limits to digital access prior to this point.
Correction
To do this I use the full set of congressional floor speeches made between 1995 and 2018 (434,266 speeches) to measure invocations of bipartisanship.
Footnote 3: Floor speeches were downloaded from the Library of Congress. The corpus begins with the 104th Congress in January 1995.
Basis See the correction to p. 1412. The deposited speech data begin on January 4, 1995.
p. 1416
Published
Furthermore, a comprehensive analysis of how representatives discuss bipartisanship by Pew Research shows that officials use the term in 99% of communication that engages the concept (see: http://www.people-press.org/2017/02/23/partisan-language-in-congressional-outreach/).
Correction
Furthermore, a comprehensive analysis of how representatives discuss bipartisanship by Pew Research shows that members most often use the explicit term “bipartisan” when they emphasize working across party lines, though they occasionally omit it (see: https://www.pewresearch.org/politics/2017/02/23/partisan-language-in-congressional-outreach/).
Basis The cited Pew Research Center report (“Partisan language in congressional outreach,” February 23, 2017) gives no 99% figure. It states that members “most often explicitly used the term ‘bipartisan’” and that they “occasionally omitted that term, so only examining documents containing the term ‘bipartisan’ would miss important cases.”
p. 1417, Figure 3 caption
Published
Fig. 3 Discussion of bipartisanship in the US House of representatives by party (1995–2018). [...] The lines are LOESS curves fit to each Congress, and the shaded areas surrounding the curves are 95% confidence intervals.
Correction
Fig. 3 Discussion of bipartisanship in the US House of representatives by party (1995–2018). [...] The points are daily proportions of each party’s floor speeches that engage bipartisanship, computed only for days on which the party made at least one such speech; days without one are not included. The lines are LOESS curves fit to each Congress, and the shaded areas surrounding the curves are 95% confidence intervals.
Basis Each of the 4,917 party-day rows in the deposited figure3.csv contains at least 1 speech engaging bipartisanship, so the plotted proportions are conditional on at least one such speech. The deposit does not include the days without one, so the unconditional daily series cannot be rebuilt from it.
p. 1420, Figure 7
Published
Fig. 7, horizontal axis: “Proportion of Speeches on a Bill Engaging Bipartisanship (95% CIs, Congress Fixed Effects)”; vertical axis: “Proportion of Members Defecting from Their Party on a Bill”
Correction
Corrected Figure 7. The horizontal axis is the proportion of members defecting from their party on a bill, and the vertical axis is the proportion of speeches on the bill engaging bipartisanship.
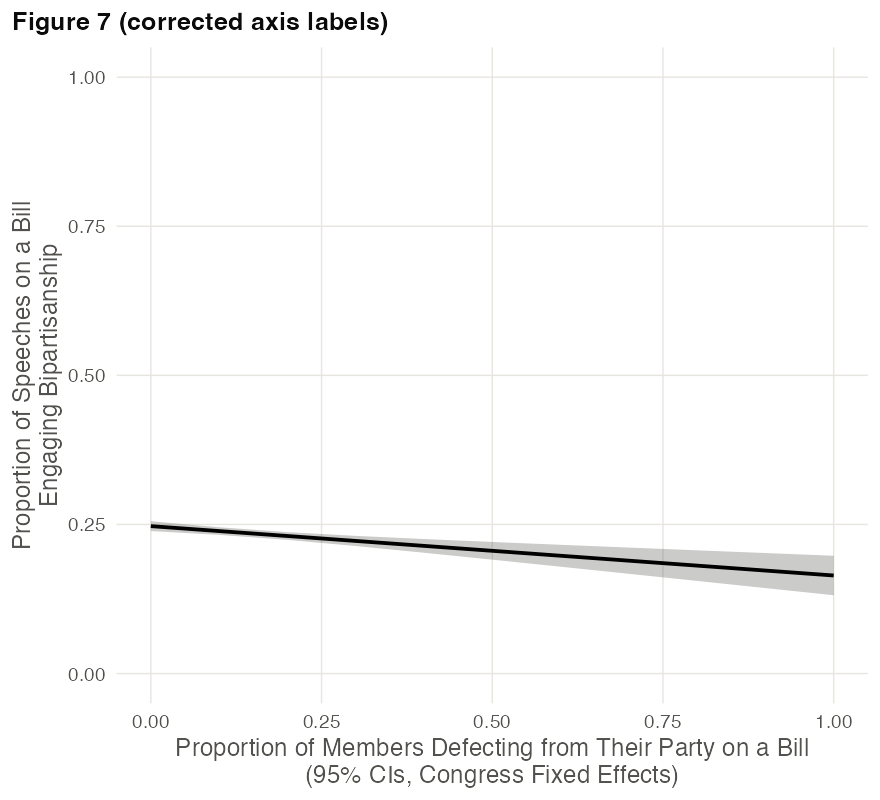
Basis figure7.R regresses the proportion of a bill’s speeches that engage bipartisanship on the proportion of members defecting (b = −0.083) and plots defection on the horizontal axis. The published labels name the two axes the other way round. The fitted line and its interval are unchanged.
p. 1421, Figure 8a
Published
Fig. 8a, panel “Bipartisan Rhetoric”, horizontal axis: “Percent of speeches engaing [sic] bipartisanship”
Correction
Corrected Figure 8a. The outcome is the number of speeches engaging bipartisanship per legislator in each 60-day period, estimated on the distinct legislator-period rows of the deposited data with standard errors clustered by legislator.
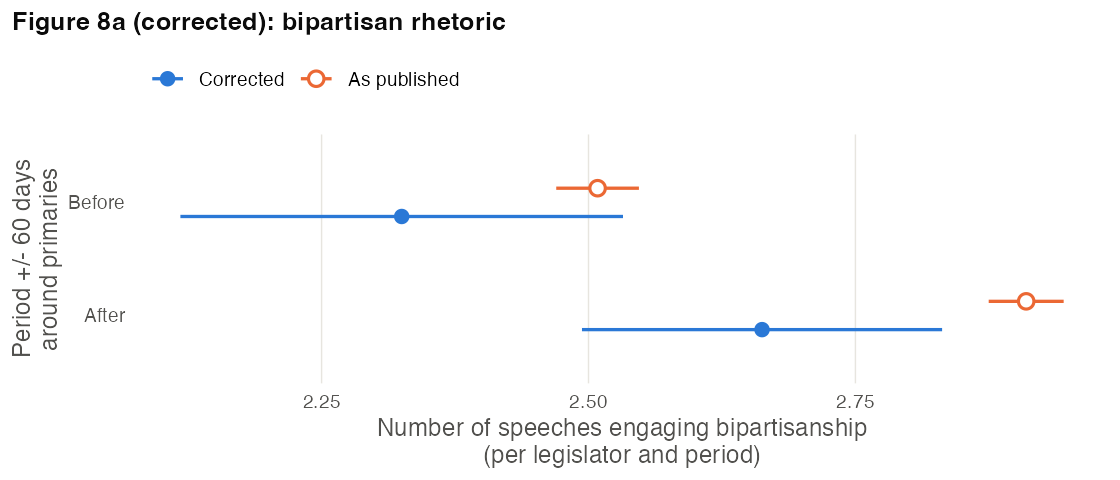
Basis The outcome in figure8a.csv is an integer count of speeches engaging bipartisanship (1 to 17); legislator-periods with no such speech are not in the file. Hollow points show the published estimates, which were fit to the duplicated rows (see the next correction). Panels b and c are unchanged.
p. 1421
Published
Using data from the 104th–114th Congress I show that measures of bipartisan action decrease after primaries (defecting on floor votes and cosponsoring legislation with a member of the opposition), but members are significantly more likely to discuss bipartisanship on the floor. [...] Figure 8a shows that bipartisan rhetoric increases by a small but significant amount after a primary (b = 0.4, 95% CI [0.45, 0.35]).
Correction
Using data from the 104th–114th Congress I show that measures of bipartisan action decrease after primaries (defecting on floor votes and cosponsoring legislation with a member of the opposition), but members give slightly more floor speeches engaging bipartisanship. [...] Figure 8a shows that the number of speeches engaging bipartisanship increases by a small amount after a primary (b = 0.34, 95% CI [−0.04, 0.71], standard errors clustered by legislator; p = .079).
Basis The deposited figure8a.csv repeats each legislator-period row up to 30 times (28,163 rows, 2,895 distinct). The published estimate comes from the duplicated file with iid standard errors. On the distinct rows, with the published weights and fixed effects, the estimate is 0.34. It is significant at the .05 level with iid (p = .0002) or heteroskedasticity-robust (p = .033) standard errors and not significant with standard errors clustered by legislator (p = .079).
p. 1422
Published
Republican Representative Todd Tiahrt (R-KA, 4th)
Correction
Republican Representative Todd Tiahrt (R-KS, 4th)
Basis Todd Tiahrt represented Kansas’s 4th district.
p. 1423, Study 1 results
Published
Results (see Fig. 9) show that overtly partisan legislation that is portrayed as bipartisan gets more support than the same policy presented with no mention of bipartisanship (mean difference = 0.35, 95% confidence interval [0.13, 0.57]). Support for legislation that is not presented as explicitly partisan is also significantly higher in the bipartisan treatment than the treatment without mention of bipartisanship (mean difference = 0.28, 95% confidence interval [0.03, 0.54]).
Correction
Results (see Fig. 9) show that overtly partisan legislation that is portrayed as bipartisan gets more support than the same policy presented with no mention of bipartisanship (mean difference = 0.28, 95% confidence interval [0.03, 0.54]). Support for legislation that is not presented as explicitly partisan is also significantly higher in the bipartisan treatment than the treatment without mention of bipartisanship (mean difference = 0.35, 95% confidence interval [0.14, 0.57]).
Basis figure9.R and the means plotted in Fig. 9 give 0.35 for legislation that is not overtly partisan and 0.28 for overtly partisan legislation. The text assigned each estimate to the other condition. Both differences are positive and significant.
p. 1424, Figure 9 caption
Published
Fig. 9 Strategic use of bipartisanship increases support. Bipartisan framing in communication increase public support and lowers perceived ideological extremity of legislation, even for overtly partisan bills.
Correction
Fig. 9 Strategic use of bipartisanship increases support. Bipartisan framing in communication increases public support, even for overtly partisan bills, and lowers the perceived ideological extremity of legislation that is not overtly partisan.
Basis For overtly partisan bills the extremity difference is −0.07 (95% confidence interval [−0.22, 0.08]), which the text on the same page describes as no longer detectable.
p. 1424
Published
These results are consistent for both Democrats and Republicans and for both liberals and conservatives responding to the bipartisan treatment (see Appendix Tables 3 and 4).
Correction
These results are consistent for Democrats and for liberals. Among Republicans and conservatives, the bipartisan treatment raises support for legislation that is not overtly partisan and lowers its perceived extremity, but its effect on support for overtly partisan legislation is close to zero (Republicans: −0.04 (SE 0.31); conservatives: 0.06 (SE 0.28); see Appendix Tables 3 and 4).
Basis Published Table 3 prints the Republican models under the Democratic labels and the reverse, and published Table 4 does not contain support models by ideology (see the corrections to SI Tables 3 and 4). The estimates in parentheses are the bipartisan effect on support for overtly partisan bills (the bipartisan coefficient plus the interaction). The same effect is 0.41 (SE 0.17) among Democrats and 0.39 (SE 0.15) among liberals.
p. 1426
Published
When 8 or fewer Democrats vote to support legislation, assertions of bipartisanship deliver a significant support bonus over assertions of importance, with the two assertions equalizing as the number of Democratic supporters increases.
Correction
When 8 or fewer Democrats vote to support legislation, assertions of bipartisanship deliver a support bonus over assertions of importance that is not statistically significant (mean difference = 0.48, 95% confidence interval [−0.05, 1.01]), with the two assertions equalizing as the number of Democratic supporters increases.
Basis Welch t-test of support in the bipartisan and important arms among the 93 respondents told that 8 or fewer Democrats voted for the bill (43 bipartisan, 50 important); p = .073.
p. 1426
Published
The majority of congressional votes gain large support from both parties, with a mean of 99.3 Democrats voting “yea” on passage votes in the 114th Congress. However, contested legislation in the 114th Congress is often only supported by a small number of Democrats. The vertical dotted lines in Fig. 10a show the percent of contested votes by number of Democrats crossing the aisle. Slightly over 51.3% of contested votes gain the support of 8 or fewer Democrats, meaning that bipartisan claims of the type explored here offer meaningful returns for the majority of contested legislation in the US House.
Correction
The majority of congressional votes gain large support from both parties, with a mean of 99.3 Democrats voting “yea” on 232 passage votes in the 113th Congress (2014). However, contested legislation in the 113th Congress (votes with fewer than 100 Democratic yeas, 113 of the 232) is often only supported by a small number of Democrats. The vertical dotted lines in Fig. 10a show the percent of contested votes by number of Democrats crossing the aisle. 54.9% of contested votes gain the support of 8 or fewer Democrats, meaning that bipartisan claims of the type explored here offer meaningful returns for the majority of contested legislation in the US House.
Basis All 232 roll calls in the deposited votes114.csv are govtrack.us votes from 2014, the second session of the 113th Congress. The deposited code (figure10-13.r) counts a vote as contested when fewer than 100 Democrats voted yea, and it computes the published 51.3% as the share with fewer than 8 Democratic yeas (51.3%). The share with 8 or fewer is 54.9%. The paper does not state how the 232 votes were selected.
p. 1427, Figure 10a
Published
Fig. 10a, annotations on the arrows from 1 to 4, 1 to 8 and 1 to 25 Democrats: “25.7% of votes”, “51.3% of votes” and “75.2% of votes”
Correction
“30.1% of votes”, “54.9% of votes” and “77.0% of votes”
Basis Fig. 10a draws dotted lines at 4, 8 and 25 Democrats, each with an arrow from 1 to the line, and p. 1426 describes the line at 8 as “8 or fewer.” The deposited code (figure10-13.r) labels the lines at 4 and 25 with the shares of contested votes with fewer than 4 (25.7%) and fewer than 25 (75.2%) Democratic yeas. Of the 113 contested votes in votes114.csv, 30.1% had 4 or fewer and 77.0% had 25 or fewer. See the correction to p. 1426.
p. 1428, Figure 11a
Published
Fig. 11a, annotations on the arrows from 1 to 4, 1 to 8 and 1 to 25 Democrats: “25.7% of votes”, “51.3% of votes” and “75.2% of votes”
Correction
“30.1% of votes”, “54.9% of votes” and “77.0% of votes”
Basis See the correction to Figure 10a (p. 1427).
p. 1428, footnote 11
Published
As with Study 1, these results are consistent for ideological and partisan groups, though in magnitude Democrats are less supportive of the policy than Republicans (see Appendix Tables 6 and 7).
Correction
The ideological placement results are consistent for ideological and partisan groups. For support, the bipartisan treatment raises support among Democrats (b = 1.54, SE 0.14) and liberals (b = 1.48, SE 0.13); among Republicans, the party of the bill’s sponsor (b = 0.13, SE 0.19), and conservatives (b = 0.26, SE 0.18) the effect is small and not statistically significant. In magnitude Democrats are less supportive of the policy than Republicans (see Appendix Tables 6 and 7).
Basis Published Table 6 prints the Republican models under the Democratic labels and the reverse, and the support columns of published Table 7 repeat its ideological placement columns (see the corrections to SI Tables 6 and 7).
p. 1430
Published
To test for a political innocence effect, the full sample of 1202 participants from study 2 answered a congressional knowledge battery before completing the experiment.
Correction
To test for a political innocence effect, the full sample of 1,324 participants from study 2 answered a congressional knowledge battery before completing the experiment.
Basis Study 2 has 1,324 participants, as stated on p. 1425 and in the deposited figure10.csv.
Supplementary information
SI p. 4, Table 3 (Study 1, party heterogeneity)
Published
Table 3, columns “Support (Democrats)” (“Bipartisan Treatment” 0.71∗∗), “Support (Republicans)” (0.33∗), “Extremity (Democrats)” and “Extremity (Republicans)”
Correction
Corrected Table 3. The estimates printed under each party label belong to the other party.
Corrected SI Table 3: Democrats are Q4.3 = 2 (N = 524) and Republicans Q4.3 = 1 (N = 200). Standard errors in parentheses; * p<0.1; ** p<0.05; * p<0.01; ** p<0.001, as in the published table. Term Support (Democrats) Support (Republicans) Extremity (Democrats) Extremity (Republicans) Intercept 5.04** (0.12) 4.21** (0.23) 0.63** (0.07) 0.87** (0.14) Bipartisan Treatment 0.33* (0.17) 0.71** (0.32) −0.27** (0.11) −0.43** (0.19) Overtly Partisan Treatment −0.38** (0.17) 0.10 (0.31) 0.17 (0.11) 0.02 (0.18) Bipartisan Treatment X Overtly Partisan Treatment 0.08 (0.24) −0.75* (0.45) 0.11 (0.15) 0.60** (0.27) R2 0.03 0.03 0.03 0.06 Basis figure9.R fits the columns labelled Democrats to respondents with Q4.3 = 1, whom the same script codes as Republican (mean ideology 5.5 on the 7-point scale, against 2.4 for Q4.3 = 2).
SI p. 4, Table 4 (Study 1, ideological heterogeneity)
Published
Table 4, columns “Support (Liberals)” and “Support (Conservatives)” (intercepts 0.69 and 0.89) and “Extremity (Liberals)” and “Extremity (Conservatives)” (identical to Table 3, columns 3 and 4)
Correction
Corrected Table 4. The published support columns are the extremity models by ideology, which now appear in columns 3 and 4; columns 1 and 2 are the support models.
Corrected SI Table 4: support (Q83) and extremity (absolute distance of Q84 from 4) for liberals (Q4.8 < 4, N = 682) and conservatives (Q4.8 > 4, N = 293). Standard errors in parentheses; * p<0.1; ** p<0.05; * p<0.01; ** p<0.001, as in the published table. Term Support (Liberals) Support (Conservatives) Extremity (Liberals) Extremity (Conservatives) Intercept 5.02** (0.10) 4.41** (0.22) 0.69** (0.06) 0.89** (0.12) Bipartisan Treatment 0.30* (0.15) 0.55* (0.28) −0.36** (0.09) −0.41* (0.16) Overtly Partisan Treatment −0.51** (0.15) −0.23 (0.29) 0.08 (0.09) 0.11 (0.16) Bipartisan Treatment X Overtly Partisan Treatment 0.09 (0.22) −0.50 (0.40) 0.22* (0.13) 0.50** (0.22) R2 0.04 0.04 0.03 0.07 Basis figure9.R overwrites the support models with extremity models before printing the table, and passes the party extremity models from Table 3 as the remaining two columns.
SI p. 6, Table 6 (Study 2, party heterogeneity)
Published
Table 6, columns “Support (Democrats)” (“Bipartisan Treatment” 0.13), “Support (Republicans)” (1.54∗∗∗), “Extremity (Democrats)” (−0.80∗∗∗) and “Extremity (Republicans)” (−1.23∗∗∗)
Correction
Corrected Table 6. The bipartisan treatment raises support among Democrats (b = 1.54, SE 0.14); among Republicans the estimate is b = 0.13, SE 0.19 (p = .506).
Corrected SI Table 6: Democrats are Q4.3 = 2 (N = 330) and Republicans Q4.3 = 1 (N = 140). Bipartisan arm compared with the partisan control. The extremity columns use the 7-point ideological placement of the bill (Q2.6), as in the published table. Standard errors in parentheses; * p<0.1; ** p<0.05; * p<0.01. Term Support (Democrats) Support (Republicans) Extremity (Democrats) Extremity (Republicans) Intercept 3.41* (0.16) 5.32* (0.22) 5.75* (0.15) 5.29* (0.20) Bipartisan Treatment 1.54* (0.14) 0.13 (0.19) −1.23* (0.13) −0.80* (0.18) Defecting Representatives −0.001 (0.002) 0.0003 (0.003) −0.004* (0.002) 0.0002 (0.003) R2 0.27 0.003 0.23 0.13 Basis figure10-13.r fits the columns labelled Democrats to respondents with Q4.3 = 1, whom it codes as Republican.
SI p. 6, Table 7 (Study 2, ideological heterogeneity)
Published
Table 7, columns “Support (Liberals)” and “Support (Conservatives)” (“Bipartisan Treatment” −1.31∗∗∗ and −0.82∗∗∗), identical to the “Extremity” columns
Correction
Corrected Table 7. With support as the outcome, the bipartisan treatment effect is b = 1.48, SE 0.13 among liberals and b = 0.26, SE 0.18 among conservatives (p = .144). The extremity columns are unchanged.
Corrected SI Table 7: the support columns use the support item (Q2.5); liberals are Q4.8 < 4 (N = 424) and conservatives Q4.8 > 4 (N = 186). The extremity columns use the 7-point ideological placement of the bill (Q2.6) and are unchanged. Standard errors in parentheses; * p<0.1; ** p<0.05; * p<0.01. Term Support (Liberals) Support (Conservatives) Extremity (Liberals) Extremity (Conservatives) Intercept 3.25* (0.15) 4.82* (0.20) 5.86* (0.13) 5.19* (0.17) Bipartisan Treatment 1.48* (0.13) 0.26 (0.18) −1.31* (0.11) −0.82* (0.15) Defecting Representatives 0.002 (0.002) 0.004 (0.003) −0.004** (0.002) 0.001 (0.003) R2 0.23 0.02 0.26 0.13 Basis figure10-13.r sets the outcome of the support models to the ideological placement item (Q2.6) in place of the support item (Q2.5).