

The paper
Jonathan Mummolo, Erik Peterson, and Sean Westwood (2021). The Limits of Partisan Loyalty. Political Behavior 43(3), 949–972.
doi:10.1007/s11109-019-09576-3 (opens in a new tab) · Replication data: doi:10.7910/DVN/J9IJGM (opens in a new tab)
Main text
p. 957, footnote 2
Published
Online Appendix B provides an example of how these profiles looked to respondents.
Correction
Online Appendix C provides an example of how candidate profiles looked to respondents in Studies 2 and 3.
Basis Appendix B describes the issue pre-test. The example profile is Figure C1 in Appendix C (“Stereotypical Candidate Pairing in Study 3”), which shows the eight-issue design of Studies 2 and 3. The appendix contains no Study 1 profile.
p. 957, footnote 5
Published
Because of our focus on choice in settings with opposing party candidates we exclude 10,778 profile pairs in which the candidates had the same party label and individuals were unable to choose between them on this factor.
Correction
Because of our focus on choice in settings with opposing party candidates we exclude 10,783 profile pairs in which the candidates had the same party label and individuals were unable to choose between them on this factor.
Basis In the archived Study 1 conjoint data, 10,783 of the 21,511 profile pairs show two candidates of the same party and 10,728 show candidates of opposing parties, the “roughly 10,728” tasks analysed in the text.
p. 959
Published
Agreeing on three issue positions produced a 33% point increase in the probability a candidate was selected, an effect of roughly the same magnitude as sharing a party label (35% points). [...] The effect of agreeing with a candidate on four issue positions, relative to not agreeing with them on any, increased the probability they were preferred by 45% points.
Correction
Agreeing on three issue positions produced a 34% point increase in the probability a candidate was selected, an effect of roughly the same magnitude as sharing a party label (35% points). [...] The effect of agreeing with a candidate on four issue positions, relative to not agreeing with them on any, increased the probability they were preferred by 45% points.
Basis The published model gives 0.4425 for four agreements, printed as 0.44 in Table D2, which does not round to the 45 points in the text. Without the panel IDs that took Study 1 more than once (see the correction to Table D2), three agreements raise the probability by 0.337 and four by 0.446. The other numbers in the paragraph are unchanged.
p. 964, Figure 4
Published
Fig. 4 Partisanship, issue agreement and candidate choice in Study 2
Correction
Figure 4 re-estimated on the corrected Study 2 sample (see the next correction). The coefficients move by at most 0.009.
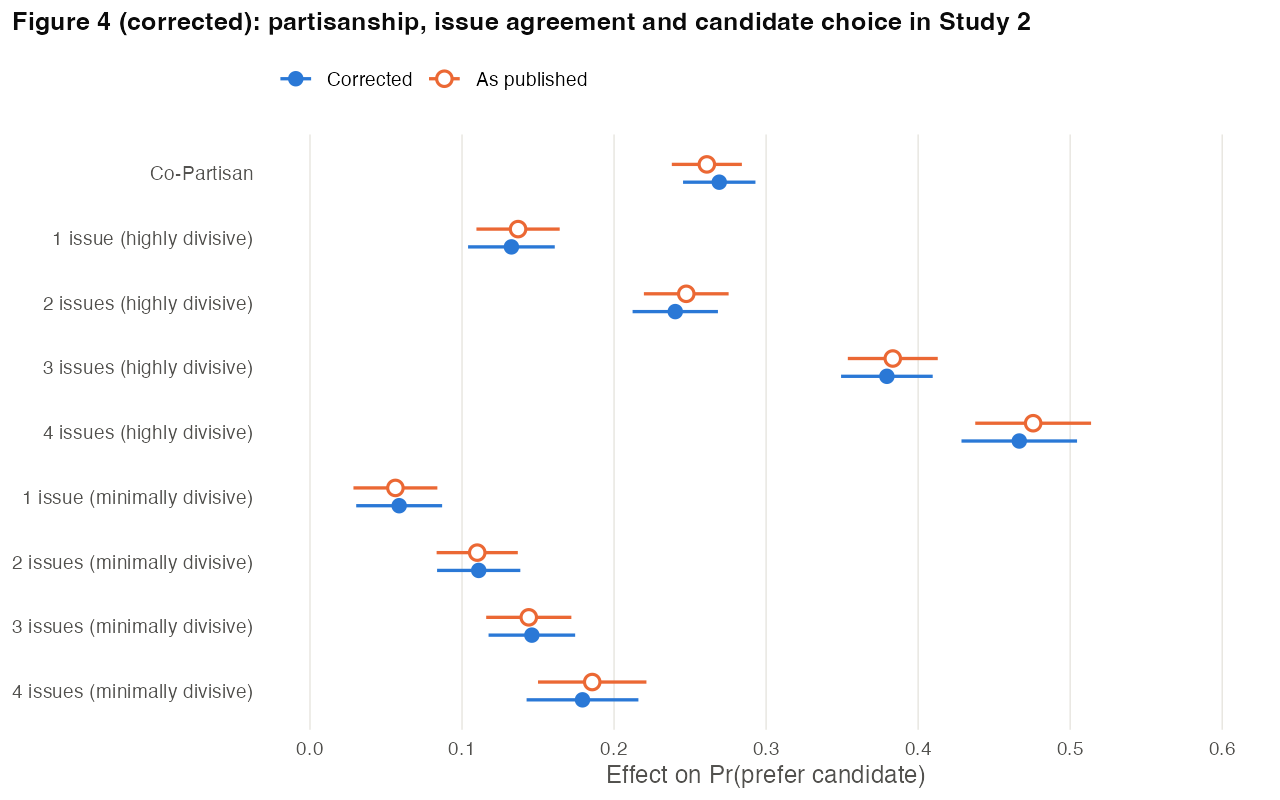
Basis Hollow points show the published estimates. Bars are ±2 standard errors, as in the original.
p. 964, Study 2 Results
Published
Study 2 was conducted in March 2018 (N = 1439 respondents from Research Now/SSI collected via Qualtrics Panels). [...] Sharing a candidate’s party label produced a 26% point increase in the probability they are preferred by a respondent. While still influential, the effect of a shared party label is 9% points smaller than in Study 1.
Correction
Study 2 was conducted in March 2018 (N = 1,431 respondents who identify as Democrats or Republicans, from Research Now/SSI collected via Qualtrics Panels). [...] Sharing a candidate’s party label produced a 27% point increase in the probability they are preferred by a respondent. While still influential, the effect of a shared party label is 8% points smaller than in Study 1.
Basis The text and Table D1 report the 1,439 respondents who identify as Democrats or Republicans, the definition used in Studies 1 and 3. The published Study 2 models used 1,510 respondents: 878 strong partisans, 558 not-strong partisans and 74 independents who lean toward a party. They also merged the data by panel ID, so panel IDs that took the study more than once enter several times; one panel ID shared by two responses contributes 224 rows. The corrected analysis keeps the 1,439 self-identified partisans and drops 5 responses from duplicated panel IDs and 3 without usable conjoint data. All Study 2 estimates below are re-estimated on these 1,431 respondents (see the correction to Table D3).
p. 965
Published
Agreement on one of these issues increased candidate support by 14% points. Relative to the same baseline, the effect of agreement on two of these high-salience issues was 25% points—roughly the same magnitude as the effect of shared partisanship, as in Study 1. Further increases in issue agreement continued to improve candidate support, with agreement on four issue positions producing a 48% point increase in the probability a candidate was preferred. [...] While the effect of agreement on one highly divisive issue was 14% points, the effect of agreement on one of the minimally divisive issues was a mere 6% point increase in candidate support. Further agreement on the minimally divisive issues only modestly increased the probability of selecting a candidate, and the effect of agreeing on all four minimally divisive issues, 19% points, failed to match the effect of sharing a candidate’s party label. [...] if they share a party label with that candidate and agree with them on the highly divisive issues, they support that candidate, on average, 74% of the time.
Correction
Agreement on one of these issues increased candidate support by 13% points. Relative to the same baseline, the effect of agreement on two of these high-salience issues was 24% points—roughly the same magnitude as the effect of shared partisanship, as in Study 1. Further increases in issue agreement continued to improve candidate support, with agreement on four issue positions producing a 47% point increase in the probability a candidate was preferred. [...] While the effect of agreement on one highly divisive issue was 13% points, the effect of agreement on one of the minimally divisive issues was a mere 6% point increase in candidate support. Further agreement on the minimally divisive issues only modestly increased the probability of selecting a candidate, and the effect of agreeing on all four minimally divisive issues, 18% points, failed to match the effect of sharing a candidate’s party label. [...] if they share a party label with that candidate and agree with them on the highly divisive issues, they support that candidate, on average, 75% of the time.
Basis Re-estimated on the corrected Study 2 sample (see the correction to p. 964). The four-issue estimate moves from 0.476 to 0.467. The comparisons drawn in the paragraph are unchanged.
p. 966, Figure 5
Published
Fig. 5 Tolerance for issue disagreement on issues in Study 2
Correction
Figure 5 re-estimated on the corrected Study 2 sample. The predicted probabilities move by at most 0.007. Support for the co-partisan candidate still falls below 0.5 only at four highly divisive disagreements (0.435; published 0.434), and full agreement still gives 92%.
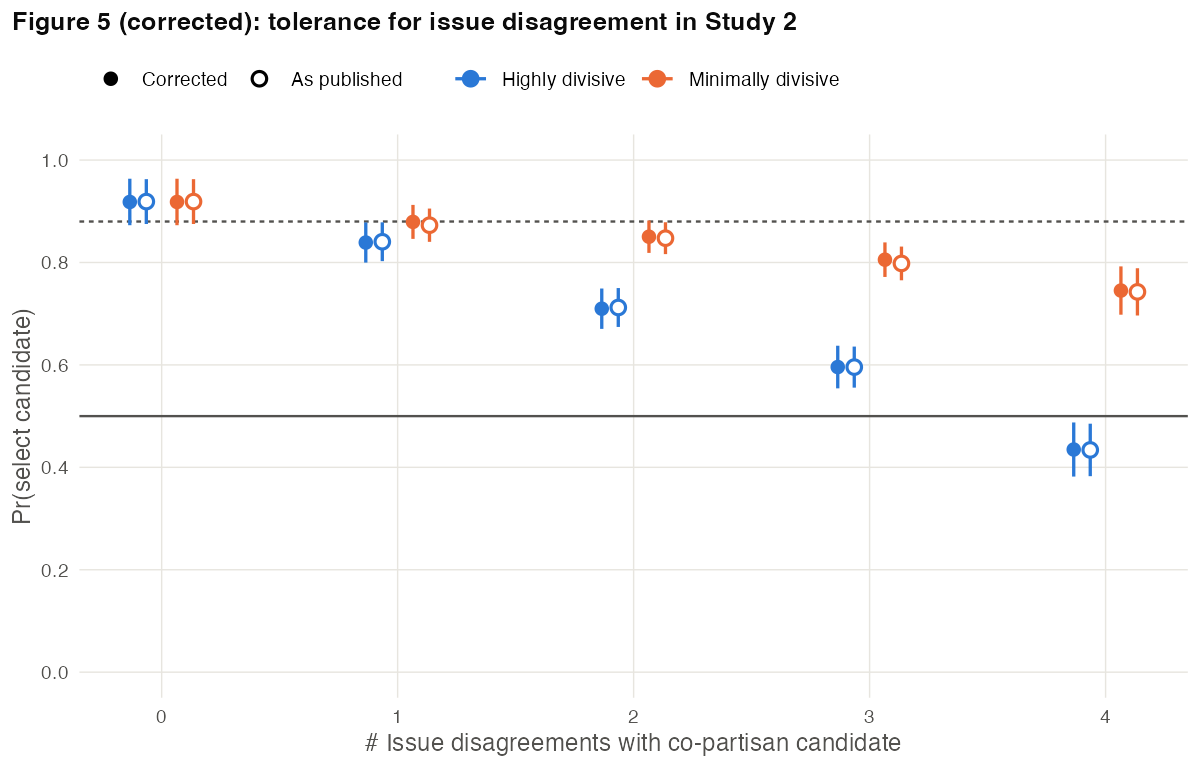
Basis Hollow points show the published estimates. The dashed line is the 2016 ANES benchmark (0.88) and the solid line marks 0.5, as in the original.
p. 967
Published
we conducted a third study in which 1,001 respondents from the same sample as Studies 1 and 2 were asked to indicate which of two candidates for office they preferred.
Correction
we conducted a third study in which 1,003 respondents from the same sample as Studies 1 and 2 were asked to indicate which of two candidates for office they preferred.
Basis In the archived Study 3 data (good completes, as in study3-analysis.R), 1,003 respondents chose between the two reputation-consistent candidates in the version without an abstain option, and 78.66% of them chose the co-partisan (see the corrections to p. 968).
p. 968, Table 2
Published
Survey 3 (reputation-consistent) 78
Correction
Survey 3 (reputation-consistent) 79
Basis 78.66% of the 1,003 Study 3 respondents preferred the co-partisan candidate.
p. 968
Published
When faced with a reputation-consistent Republican against a reputation-consistent Democrat, 78% of partisan respondents preferred their co-partisan candidate (see Table 2).
Correction
When faced with a reputation-consistent Republican against a reputation-consistent Democrat, 79% of partisan respondents preferred their co-partisan candidate (see Table 2).
Basis See the correction to Table 2.
p. 968, footnote 16
Published
As in other work, we include partisan “leaners” with the party they are closest with and exclude “pure” independents.
Correction
As in Studies 1 and 2, this analysis includes only respondents who identify as Democrats or Republicans; it excludes partisan “leaners” and “pure” independents (see footnote 14).
Basis Footnote 14 states that the Study 3 sample included only strong and not very strong partisans, and the archived Study 3 data contain only Democrats and Republicans. The archived Study 1 data also contain only Democrats and Republicans. Of the three studies, only the published Study 2 analysis assigned leaners to a party; with the correction to p. 964 all three use the same definition.
p. 970, References
Published
Bonica, A. (2014). Mapping the ideological marketplace. American Journal of Political Science, 58(2), 37–386.
Correction
Bonica, A. (2014). Mapping the ideological marketplace. American Journal of Political Science, 58(2), 367–386.
Supplementary information
Online Appendix p. 3, Table A1
Published
Table A1: Effect of Issue Agreement on Candidate Choice - Study 1 - By Issue
Row “N”: 21456.
Correction
Corrected Table A1 (N = 20,838). The coefficients and standard errors are unchanged at two decimals.
Corrected Table A1: Study 1 without panel IDs that took the study more than once. Robust standard errors clustered by respondent in parentheses; * p < 0.05. Term Model 1 (Intercept) 0.27* (0.01) Corporate Tax 0.10* (0.01) Muslim Immigration 0.11* (0.01) Obamacare 0.18* (0.01) Birth Control 0.08* (0.01) N 20,838 Basis Panel IDs that took Study 1 more than once are removed (see the correction to Table D2). The appendix text (18 points for Obamacare, 8 to 11 points for the other issues) is unchanged.
Online Appendix p. 7, Table B2
Published
Table B2: Effect of Issue Agreement on Pr(Select Candidate)
Row “Common Core”: 0.04∗; row “N”: 21712.
Correction
Corrected Table B2. Common Core is 0.05 and N = 21,418; the other coefficients and the standard errors are unchanged at two decimals, and the four high-salience issues still have the four largest effects.
Corrected Table B2: Study 2, all respondents, without duplicated panel IDs. Robust standard errors clustered by respondent in parentheses; * p < 0.05. Term Model 1 (Intercept) 0.17* (0.01) Rifle 0.14* (0.01) Abortion 0.12* (0.01) LBGT Discrimination 0.12* (0.01) Obamacare 0.09* (0.01) Birth Control 0.07* (0.01) Tariff 0.04* (0.01) Common Core 0.05* (0.01) Dept. of Interior Spending 0.03* (0.01) N 21,418 Basis Table B2 uses all Study 2 respondents, whatever their party, so only the duplicated panel IDs are removed (see the correction to p. 964).
Online Appendix p. 9, Table D1
Published
Sample Size 3075 1439
Correction
Sample Size 3,074 1439
Basis The Study 1 file used for Table D1 contains 3,074 respondents who identify as Democrats or Republicans, the N given in the text (p. 957). The Study 2 column describes the 1,439 respondents who identify as Democrats or Republicans; the corrected Study 2 analysis uses 1,431 of them (see the correction to p. 964).
Online Appendix p. 10, Table D2
Published
Table D2: Effect of Co-Partisanship and Issue Agreement on Candidate Choice - Study 1
Row “N”: 21456, 21456, 10592, 10864.
Correction
Corrected Table D2.
Corrected Table D2: Study 1 without the 29 panel IDs that took the study more than once. Robust standard errors clustered by respondent in parentheses; * p < 0.05. Column 2 applies the archived raking weights. Term All All - Reweighted Democrats Only Republican Only (Intercept) 0.11* (0.01) 0.12* (0.02) 0.13* (0.02) 0.09* (0.02) Co-Partisan 0.35* (0.01) 0.33* (0.02) 0.34* (0.02) 0.36* (0.01) High-Salience Agree - 1 Issue 0.09* (0.01) 0.09* (0.02) 0.08* (0.02) 0.11* (0.02) High-Salience Agree - 2 Issues 0.22* (0.01) 0.22* (0.02) 0.20* (0.02) 0.23* (0.02) High-Salience Agree - 3 Issues 0.34* (0.01) 0.34* (0.03) 0.32* (0.02) 0.36* (0.02) High-Salience Agree - 4 Issues 0.45* (0.02) 0.42* (0.03) 0.43* (0.03) 0.46* (0.02) N 20,838 20,838 10,126 10,712 Basis In Study 1, 29 panel IDs took the study more than once (618 analysis rows). The published models treat each take as a separate respondent (3,051 clusters for 2,993 panel IDs), and because the script keeps one survey row per panel ID, every take carries the issue positions and weight of that row. The corrected models drop these panel IDs, leaving 2,964. Coefficients change by at most 0.005, and the predicted probabilities plotted in Figures 1 and 2 by at most 0.005, which is below the resolution of those figures.
Online Appendix p. 11, Table D3
Published
Table D3: Effect of Co-Partisanship and Issue Agreement on Candidate Choice - Study 2
Row “N”: 21100, 21100, 11048, 10052.
Correction
Corrected Table D3.
Corrected Table D3: Study 2, respondents who identify as Democrats or Republicans, without duplicated panel IDs. Robust standard errors clustered by respondent in parentheses; * p < 0.05. Column 2 applies the archived raking weights, which were computed for the sample with leaners and are not re-raked. Term All All - Reweighted Democrats Only Republican Only (Intercept) 0.01 (0.02) −0.01 (0.03) −0.02 (0.02) 0.05 (0.03) Co-Partisan 0.27* (0.01) 0.29* (0.03) 0.24* (0.02) 0.30* (0.02) High-Salience Agree - 1 Issue 0.13* (0.01) 0.16* (0.03) 0.17* (0.02) 0.09* (0.02) High-Salience Agree - 2 Issues 0.24* (0.01) 0.28* (0.03) 0.29* (0.02) 0.19* (0.02) High-Salience Agree - 3 Issues 0.38* (0.02) 0.41* (0.03) 0.44* (0.02) 0.31* (0.02) High-Salience Agree - 4 Issues 0.47* (0.02) 0.46* (0.03) 0.53* (0.02) 0.40* (0.03) Low-Salience Agree - 1 Issue 0.06* (0.01) 0.06* (0.03) 0.06* (0.02) 0.06* (0.02) Low-Salience Agree - 2 Issues 0.11* (0.01) 0.08* (0.03) 0.11* (0.02) 0.11* (0.02) Low-Salience Agree - 3 Issues 0.15* (0.01) 0.13* (0.03) 0.13* (0.02) 0.16* (0.02) Low-Salience Agree - 4 Issues 0.18* (0.02) 0.16* (0.04) 0.17* (0.03) 0.19* (0.03) N 19,794 19,794 10,310 9,484 Basis Respondents who identify as Democrats or Republicans, with duplicated panel IDs removed (see the correction to p. 964). The reweighted column applies the archived raking weights, which were computed for the sample that included leaners and are not re-raked; in that column the co-partisan effect is 0.29 (0.22 as published).
Online Appendix p. 12, Figure D1 and caption
Published
The figure displays the probability of selecting the co-partisan candidate conditional on a respondents’ level of agreement with them on the issues presented. [...] For comparison, the top dashed line shows the rate of voting for candidate from the other party in the 2016 American National Election Study (ANES)
Correction
The figure displays the probability of selecting the out-party candidate conditional on a respondents’ level of agreement with them on the issues presented. [...] For comparison, the bottom dashed line shows the rate of voting for a candidate from the other party in the 2016 American National Election Study (ANES)
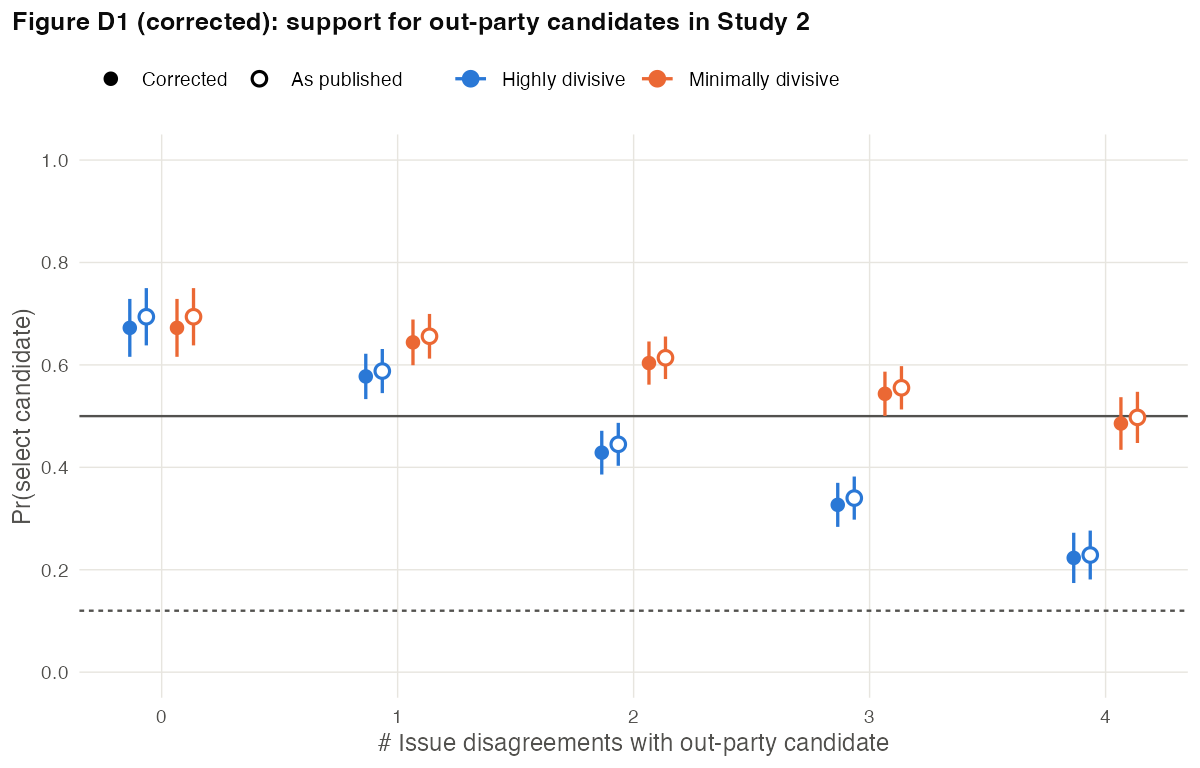
Basis Figure D1 plots support for out-party candidates (its axis reads “# Issue Disagreements With Out-Party Candidate”) and has one dashed line, at 0.12 near the bottom of the panel. The figure shown is re-estimated on the corrected Study 2 sample; hollow points show the published estimates, which move by at most 0.022.