

The paper
Derek E. Holliday, Shanto Iyengar, Yphtach Lelkes, and Sean J. Westwood (2024). Uncommon and nonpartisan: Antidemocratic attitudes in the American public. Proceedings of the National Academy of Sciences 121(13), e2313013121.
doi:10.1073/pnas.2313013121 (opens in a new tab) · Replication data: doi:10.7910/DVN/XUTJTN (opens in a new tab)
Main text
p. 1, Abstract
Published
Exploiting data from a massive repeated cross-sectional and panel survey (n = 45,095 and 5,231 respectively)
Correction
Exploiting data from a massive repeated cross-sectional and panel survey (n = 45,095 and 7,607 respectively)
Basis Section 3 reports that 5,231 respondents were interviewed twice and 2,376 were interviewed three or more times, so the panel has 7,607 respondents. The panel analyses use all 19,502 of their interviews (SI Table S11).
p. 3, Section 3 (Data)
Published
Every week, the survey fields responses from 1,000 respondents [...] we exclude respondents who failed a simple attention check. This yields a final sample of 45,095 respondents (39).
Correction
Every week, the survey fields responses from 1,000 respondents [...] we exclude respondents who failed a simple attention check. This yields a final sample of 45,095 respondents (39). The exclusion removed nearly every interview in two field weeks before the 2022 midterm election, leaving 42 interviews from September 22 to September 28, 2022, and 37 from September 30 to October 5, 2022; it also removed every interview in the field week between January 11 and January 19, 2023. Each of the other field weeks contributes between 661 and 1,403 interviews.
Basis Counts of interviews by field week in the public analysis file. The attention check is the only exclusion the article describes, and the published text does not report that it emptied these three weeks.
p. 3, Fig. 2B
Published
Note in this plot and all plots that follow, we show 95% CIs, but the span of the intervals is often so small they are hidden by the size of the points on the plot. All results are weighted to demographic survey targets.
Fig. 2B, trends in support for four norm violations by party, which the footnote to Fig. 1 quoted above covers.
Correction
Corrected Fig. 2B, with the trend lines estimated with the survey weights (solid lines and shaded 95% CIs). Dashed lines show the published curves. The weighted curves differ from the published curves by 0.8 percentage points on average and by up to 2.0 points (Democrats on “Ignore outparty court decisions”).
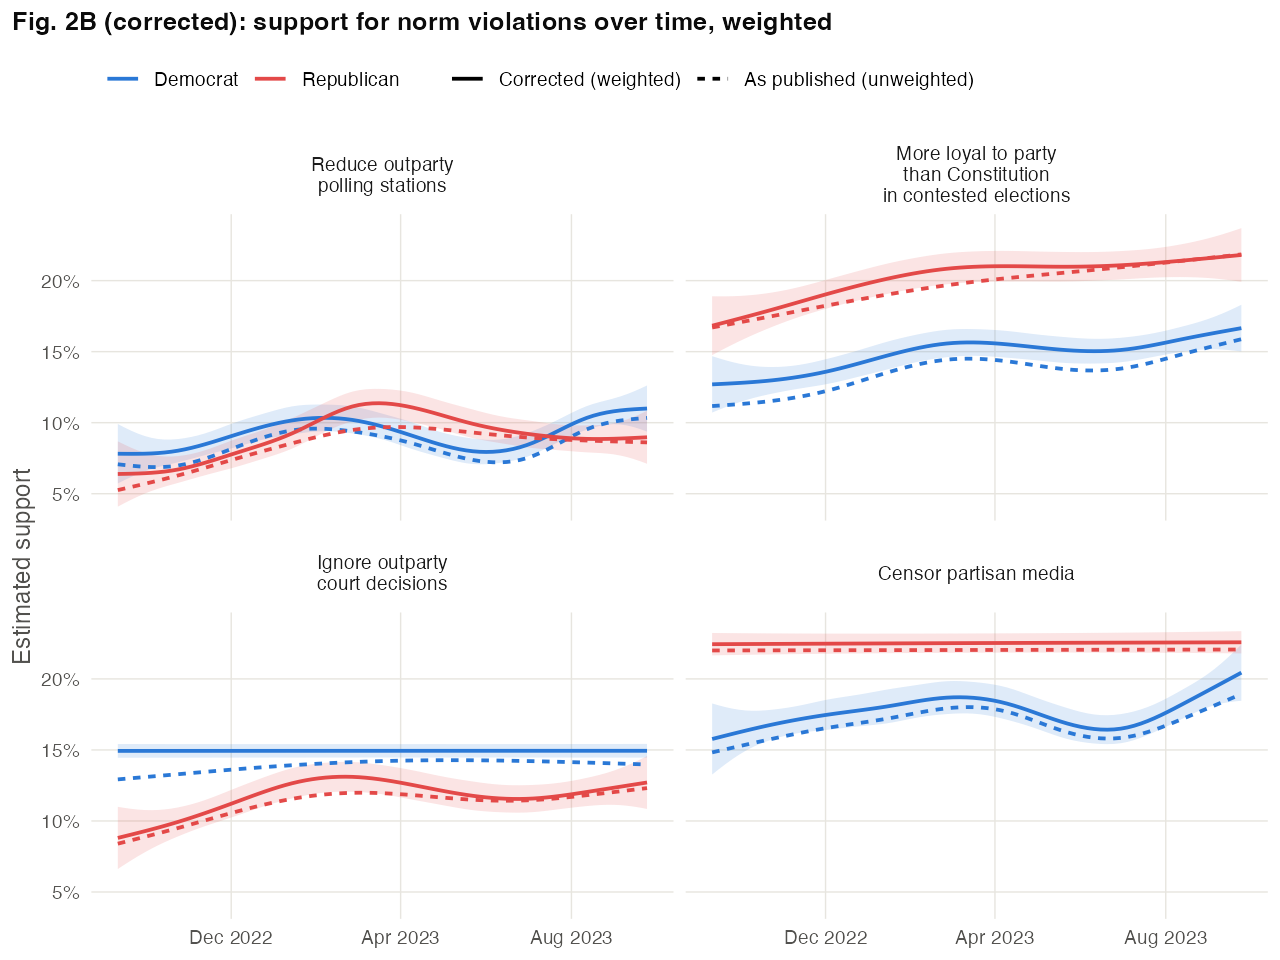
Basis The published code (gen_fig2.R) passes the weight to geom_smooth outside the aesthetic mapping, where ggplot ignores it, so the published curves are identical to an unweighted fit. The corrected curves use the same smoother and the weights that script constructs for this panel.
Supplementary information
SI p. 5, Figure S3
Published
Figure S3, Strong Republicans: “Censor partisan media” 60.8%; “Reduce outparty polling stations” 56%.
Correction
Strong Republicans: Censor partisan media 60.7%; Reduce outparty polling stations 55.9%. All other labels in Figure S3 are unchanged.
Basis The public data contain four values above 100 (from 251 to 995) on the 0–100 perception items, two of them from strong Republicans. Setting these values to missing changes the two labels above. No label in Fig. 4 of the article changes.
SI p. 8, Figure S6B
Published
Figure S6B, trends in average support (1–5) for five norm violations by party.
Correction
Corrected Figure S6B, with the trend lines estimated with the survey weights (solid lines and shaded 95% CIs). Dashed lines show the published curves. The weighted curves differ from the published curves by 0.03 points on the 1–5 scale on average and by up to 0.08 points (Democrats on “More loyal to party than Constitution”).
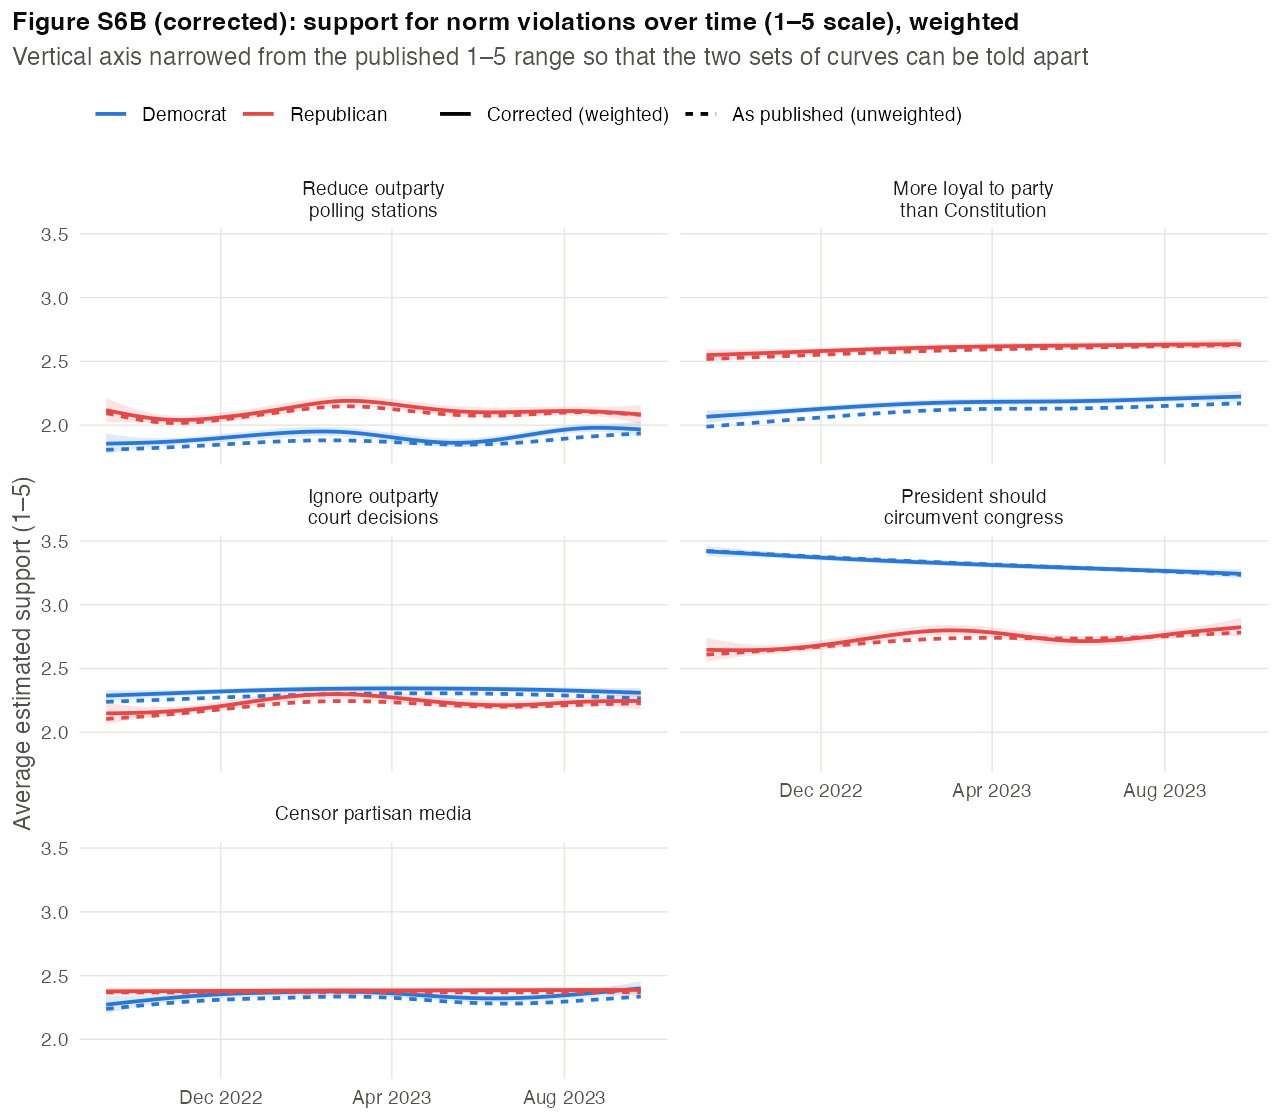
Basis The published code for this figure (gen_fig6s.R) constructs the weekly survey weight and makes the same geom_smooth call as gen_fig2.R, with the weight outside the aesthetic mapping, so the published curves are identical to an unweighted fit (see the correction to p. 3, Fig. 2B). The corrected curves use the same smoother and the weights that script constructs for this panel. The vertical axis of the corrected figure is narrower than the published 1–5 range so that the two sets of curves can be told apart.
SI section 4, p. 29, footnote 2
Published
We split out data into 80% training data and 20% testing data, stratified by party, and keeping only observations with non-missing data for each of our variables. This yields a training set of 25,802 respondents and a testing set of 6,452 respondents.
Correction
We split our data into 80% training data and 20% testing data by respondent, so that all interviews with a respondent fall in the same set, stratified by party, and keeping only observations with non-missing data for each of our variables. This yields a training set of 25,803 interviews with 19,593 respondents and a testing set of 6,451 interviews with 4,945 respondents.
Basis The published split was drawn by interview: 2,192 of the 6,452 test interviews (34.0%) came from respondents who also appear in the training data, so the test set was not held out. The corrected split uses the same seed and proportion and stratifies by the respondent's party at first interview. Figures S15 and S16 are re-estimated on it below.
SI section 5.2, p. 35
Published
applying our fitted models to the held-out testing data of 6,452 respondents, using both demographic and demographic and attitudinal predictors (respectively). [...] Across all models and all partisan groupings, our predictions perform significantly better than the null model of random guessing (accuracy = 50%). This suggests our models, in which the components of affective polarization were strong predictors, are overall good predictors of support for norm violations.
Correction
applying our fitted models to the held-out testing data of 6,451 interviews with 4,945 respondents who do not appear in the training data, using both demographic and demographic and attitudinal predictors (respectively). [...] The relevant null model predicts the most common response for every case; its accuracy is 54.2% to 91.5% for the norm items and 96.9% to 98.8% for the violence items. The norm models improve on it by 0.0 to 1.8 percentage points (0.2 to 7.0 points for the president circumventing Congress), and the violence models do no better than it. Accuracy therefore adds little beyond the base rates, and ROC AUC is the more informative measure of how well the models separate supporters from opponents. It ranges from 54.7% to 81.8% for the norm models and from 73.5% to 87.0% for the violence models.
Basis A model that classifies every respondent as opposed already reaches 96.9% to 98.8% accuracy on the violence items, so a 50% benchmark does not measure predictive power. Values are from the corrected Figures S15 and S16.
SI p. 36, Figure S15
Published
Figure S15, “Model performance: Demographic Predictors” (accuracy and ROC AUC on the 6,452-interview test set).
Correction
Corrected Figure S15, estimated with the respondent-level split. Black ticks mark the accuracy of predicting the most common response for everyone; hollow points show the published values.
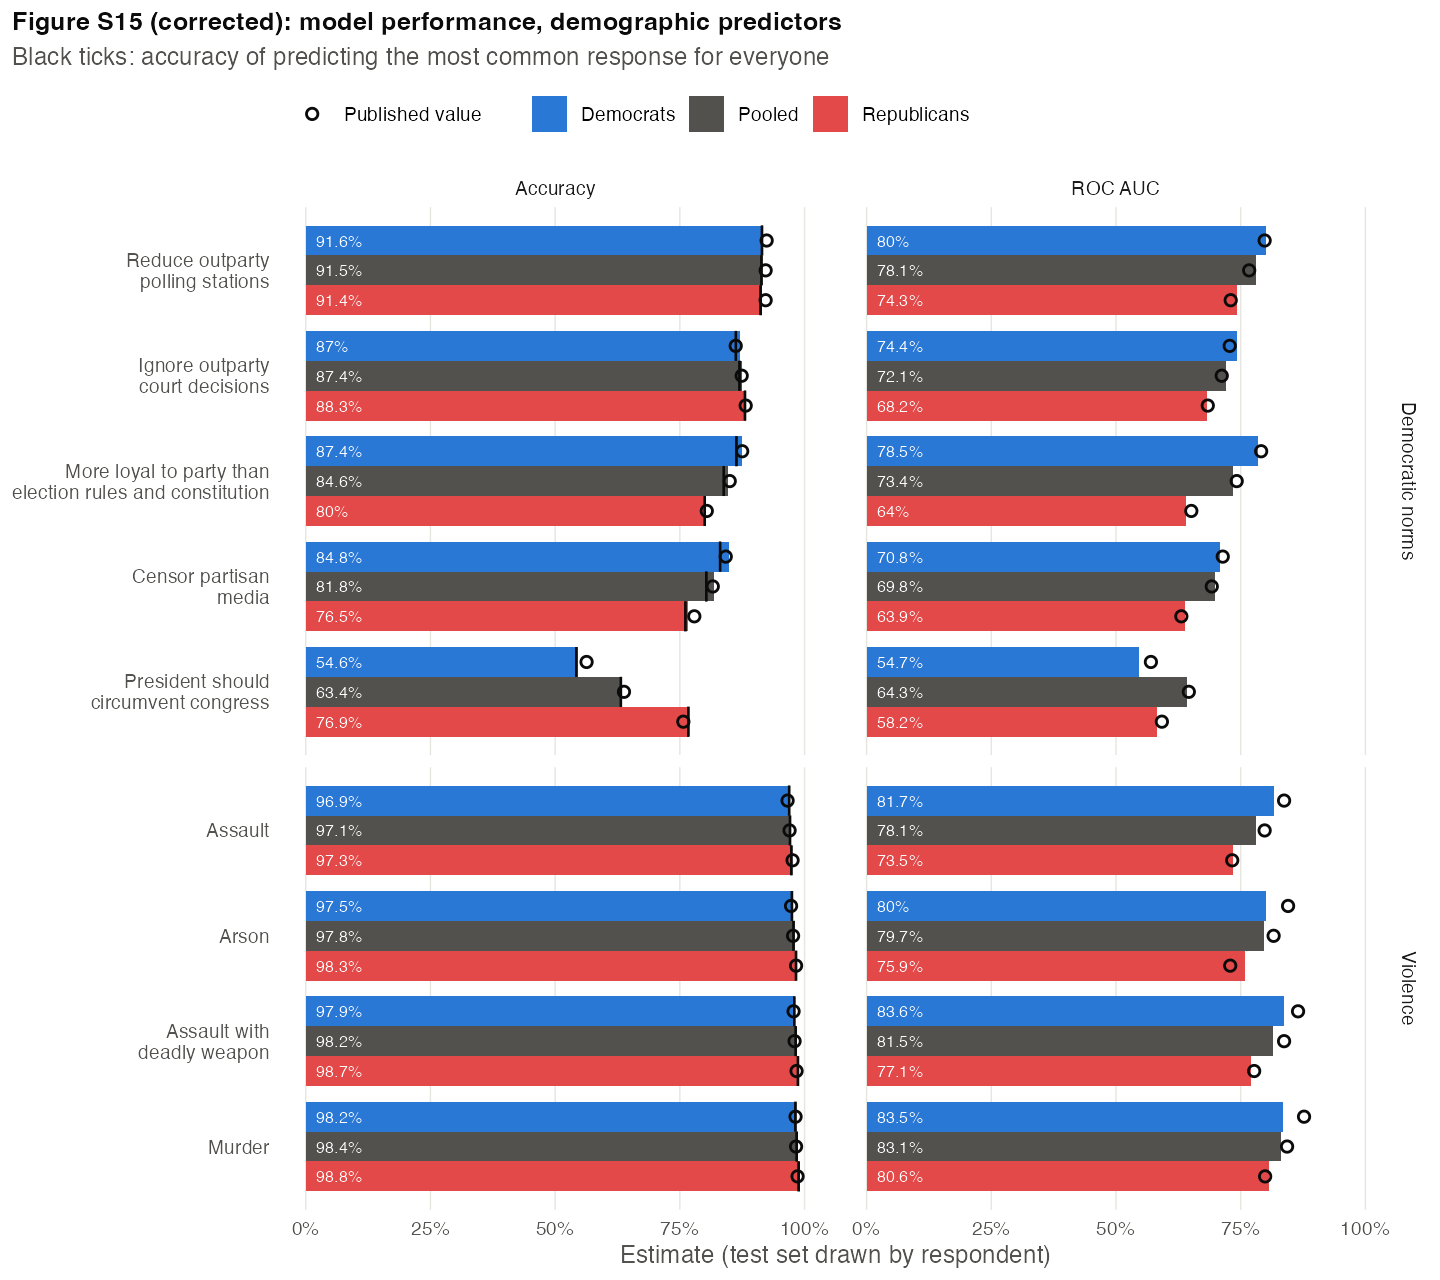
Values plotted in the corrected Figure S15 (respondent-level split), with the accuracy of predicting the most common training-set response for every test case and the published values. Item Sample Test interviews Accuracy Most common response ROC AUC Published accuracy Published ROC AUC Reduce outparty polling stations Democrats 3,880 91.6% 91.5% 80.0% 92.4% 79.8% Reduce outparty polling stations Pooled 6,451 91.5% 91.4% 78.1% 92.2% 76.7% Reduce outparty polling stations Republicans 2,571 91.4% 91.2% 74.3% 92.2% 73.0% Ignore outparty court decisions Democrats 3,880 87.0% 86.2% 74.4% 86.2% 72.8% Ignore outparty court decisions Pooled 6,451 87.4% 87.0% 72.1% 87.4% 71.2% Ignore outparty court decisions Republicans 2,571 88.3% 88.1% 68.2% 88.2% 68.4% Loyalty to party over the Constitution Democrats 3,880 87.4% 86.3% 78.5% 87.5% 79.1% Loyalty to party over the Constitution Pooled 6,451 84.6% 83.8% 73.4% 85.0% 74.2% Loyalty to party over the Constitution Republicans 2,571 80.0% 80.0% 64.0% 80.4% 65.1% Censor partisan media Democrats 3,880 84.8% 83.1% 70.8% 84.2% 71.4% Censor partisan media Pooled 6,451 81.8% 80.3% 69.8% 81.6% 69.2% Censor partisan media Republicans 2,571 76.5% 76.1% 63.9% 77.9% 63.1% President should circumvent Congress Democrats 3,880 54.6% 54.2% 54.7% 56.3% 57.0% President should circumvent Congress Pooled 6,451 63.4% 63.2% 64.3% 63.8% 64.6% President should circumvent Congress Republicans 2,571 76.9% 76.7% 58.2% 75.7% 59.2% Assault Democrats 3,880 96.9% 96.9% 81.7% 96.6% 83.7% Assault Pooled 6,451 97.1% 97.1% 78.1% 97.0% 79.8% Assault Republicans 2,571 97.3% 97.4% 73.5% 97.6% 73.3% Arson Democrats 3,880 97.5% 97.5% 80.0% 97.3% 84.5% Arson Pooled 6,451 97.8% 97.8% 79.7% 97.7% 81.6% Arson Republicans 2,571 98.3% 98.3% 75.9% 98.3% 72.9% Assault with a deadly weapon Democrats 3,880 97.9% 97.9% 83.6% 97.8% 86.5% Assault with a deadly weapon Pooled 6,451 98.2% 98.2% 81.5% 98.0% 83.7% Assault with a deadly weapon Republicans 2,571 98.7% 98.7% 77.1% 98.4% 77.7% Murder Democrats 3,880 98.2% 98.2% 83.5% 98.2% 87.7% Murder Pooled 6,451 98.4% 98.4% 83.1% 98.3% 84.3% Murder Republicans 2,571 98.8% 98.8% 80.6% 98.6% 79.9% Basis Refitting the published specification on the published split with current software reproduces the printed accuracies to within 0.9 points and the printed AUCs to within 3.6 points (median 0.3); these differences come from the random-forest draws. Against that refit, the respondent-level split changes accuracy by −1.4 to 1.0 points and AUC by −5.8 to 2.2 points.
SI p. 36
Published
Since support for political violence is exceptionally rare, it is unsurprising that in all political violence models the random forest models predicted 0 respondents supported violence.
Correction
Since support for political violence is exceptionally rare, it is unsurprising that the political violence models predicted almost no respondents supported violence (2 predicted supporters across the 24 violence models).
Basis With the respondent-level split, 23 of the 24 violence models predict no supporters, and every violence model's accuracy equals or falls below that of predicting the most common response.
SI p. 37, Figure S16
Published
Figure S16, “Model performance: All Predictors” (accuracy and ROC AUC on the 6,452-interview test set).
Correction
Corrected Figure S16, estimated with the respondent-level split. Black ticks mark the accuracy of predicting the most common response for everyone; hollow points show the published values.
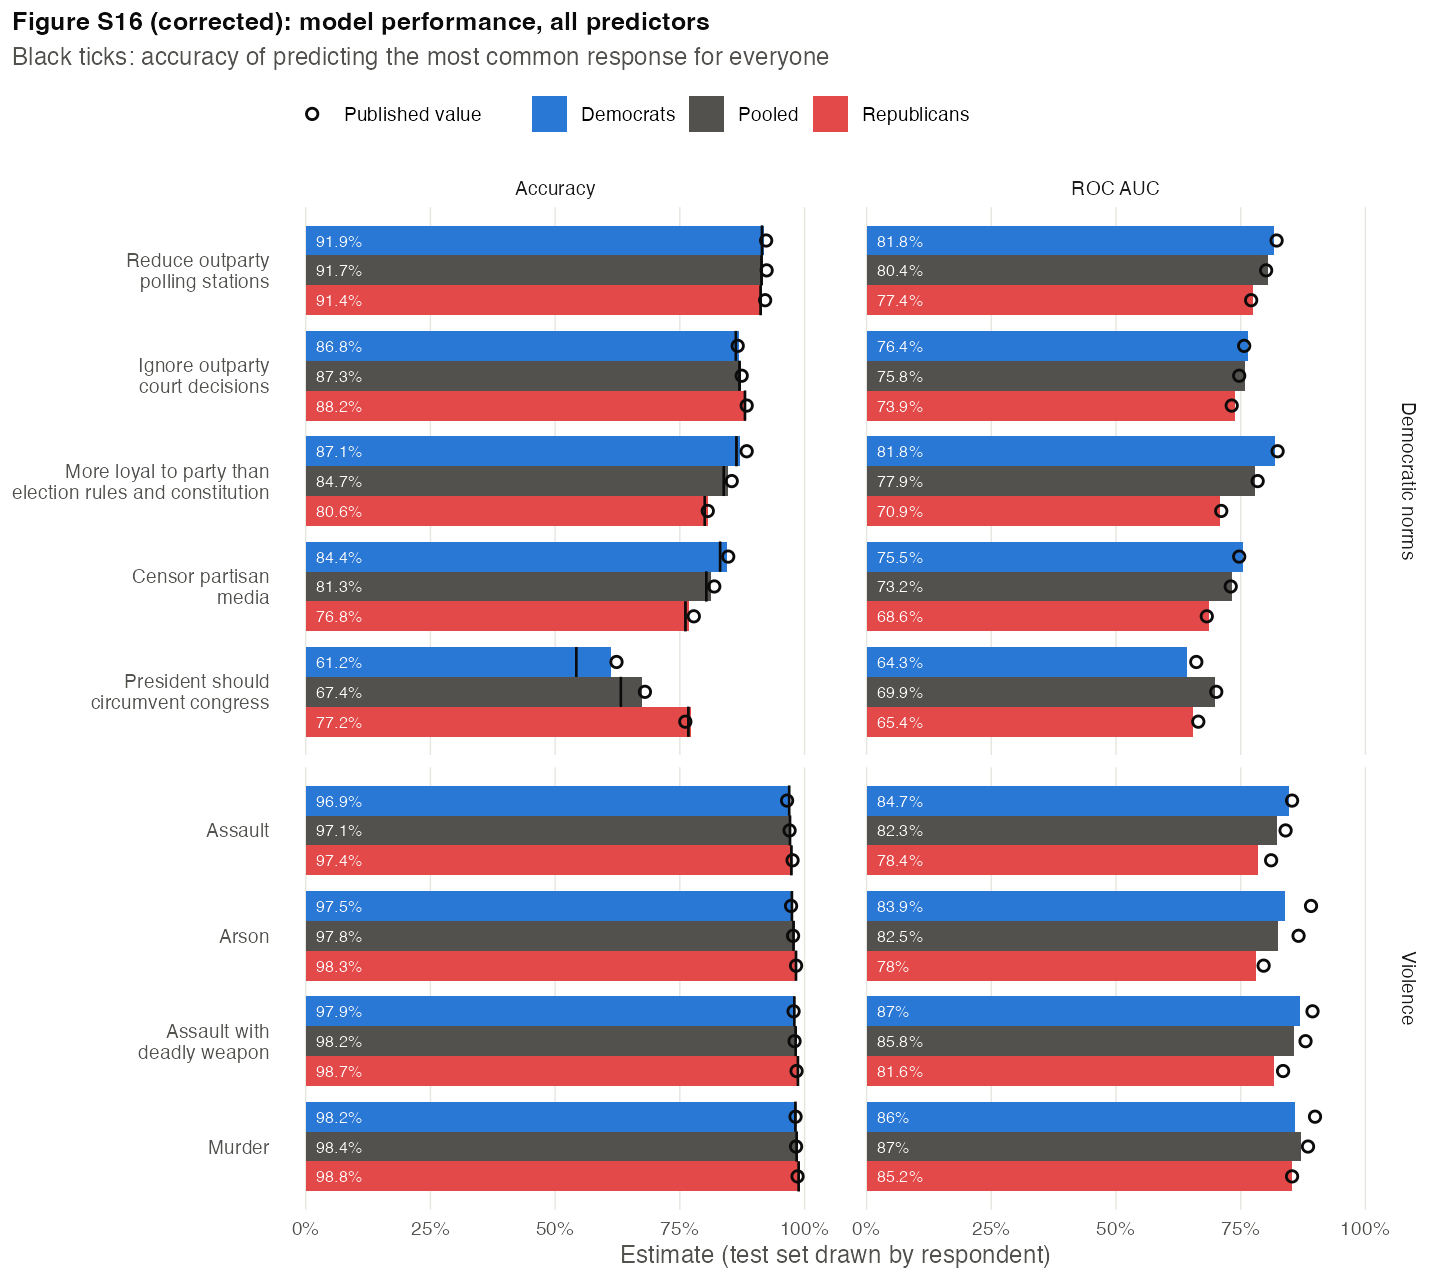
Values plotted in the corrected Figure S16 (respondent-level split), with the accuracy of predicting the most common training-set response for every test case and the published values. Item Sample Test interviews Accuracy Most common response ROC AUC Published accuracy Published ROC AUC Reduce outparty polling stations Democrats 3,880 91.9% 91.5% 81.8% 92.3% 82.2% Reduce outparty polling stations Pooled 6,451 91.7% 91.4% 80.4% 92.4% 80.1% Reduce outparty polling stations Republicans 2,571 91.4% 91.2% 77.4% 92.1% 77.1% Ignore outparty court decisions Democrats 3,880 86.8% 86.2% 76.4% 86.6% 75.7% Ignore outparty court decisions Pooled 6,451 87.3% 87.0% 75.8% 87.4% 74.7% Ignore outparty court decisions Republicans 2,571 88.2% 88.1% 73.9% 88.4% 73.2% Loyalty to party over the Constitution Democrats 3,880 87.1% 86.3% 81.8% 88.4% 82.4% Loyalty to party over the Constitution Pooled 6,451 84.7% 83.8% 77.9% 85.4% 78.4% Loyalty to party over the Constitution Republicans 2,571 80.6% 80.0% 70.9% 80.6% 71.1% Censor partisan media Democrats 3,880 84.4% 83.1% 75.5% 84.7% 74.7% Censor partisan media Pooled 6,451 81.3% 80.3% 73.2% 81.9% 73.0% Censor partisan media Republicans 2,571 76.8% 76.1% 68.6% 77.8% 68.2% President should circumvent Congress Democrats 3,880 61.2% 54.2% 64.3% 62.3% 66.1% President should circumvent Congress Pooled 6,451 67.4% 63.2% 69.9% 68.0% 70.1% President should circumvent Congress Republicans 2,571 77.2% 76.7% 65.4% 76.1% 66.5% Assault Democrats 3,880 96.9% 96.9% 84.7% 96.5% 85.3% Assault Pooled 6,451 97.1% 97.1% 82.3% 97.0% 84.0% Assault Republicans 2,571 97.4% 97.4% 78.4% 97.6% 81.1% Arson Democrats 3,880 97.5% 97.5% 83.9% 97.3% 89.1% Arson Pooled 6,451 97.8% 97.8% 82.5% 97.7% 86.6% Arson Republicans 2,571 98.3% 98.3% 78.0% 98.3% 79.6% Assault with a deadly weapon Democrats 3,880 97.9% 97.9% 87.0% 97.8% 89.4% Assault with a deadly weapon Pooled 6,451 98.2% 98.2% 85.8% 98.0% 88.0% Assault with a deadly weapon Republicans 2,571 98.7% 98.7% 81.6% 98.4% 83.5% Murder Democrats 3,880 98.2% 98.2% 86.0% 98.2% 89.9% Murder Pooled 6,451 98.4% 98.4% 87.0% 98.3% 88.5% Murder Republicans 2,571 98.8% 98.8% 85.2% 98.6% 85.3% Basis Against a refit of the published split (see the correction to p. 36), the respondent-level split changes accuracy by −1.1 to 0.9 points and AUC by −4.7 to 1.2 points. The Democratic models still outperform the Republican models on ROC AUC, by 5.2 points on average across both figures.