

The paper
David E. Broockman, Joshua L. Kalla, and Sean J. Westwood (2023). Does Affective Polarization Undermine Democratic Norms or Accountability? Maybe Not. American Journal of Political Science 67(3), 808–828.
doi:10.1111/ajps.12719 (opens in a new tab) · Replication data: doi:10.7910/DVN/3AOBP2 (opens in a new tab)
Main text
p. 810, Table 1 (Electoral accountability)
Published
“. . . heightened polarization has made it almost impossible for partisans to abandon their party’s candidates, no matter their limitations” (Iyengar and Krupenkin 2018, 215)
Correction
“. . . heightened polarization has made it almost impossible for partisans to abandon their party’s candidates, no matter their limitations” (Iyengar and Krupenkin 2018, 41)
Basis The reference list cites Iyengar and Krupenkin (2018), The Forum 16(1): 23–45. The quoted sentence is on p. 41 of that article.
p. 813, Figure 2, panel title
Published
DV = Treated fairly in trust game (1–7 Likert Scale)
Correction
DV = Treated fairly in trust game (1–4 scale)
Basis In the Survey 1–4 data, the item takes the values 1 to 4.
p. 814, Electoral Accountability
Published
concern that affective polarization “has made it almost impossible for partisans to abandon their party’s candidates, no matter their limitations” (Iyengar and Krupenkin 2018, 215).
Correction
concern that affective polarization “has made it almost impossible for partisans to abandon their party’s candidates, no matter their limitations” (Iyengar and Krupenkin 2018, 41).
Basis See the correction to Table 1, p. 810.
p. 819, Adopting One’s Party’s Positions
Published
(This comparison corresponds with comparing issue preferences for those in Cells 2, 4, and 6 versus Cells 1, 3, and 5 of Table 2).
Correction
(This comparison corresponds with comparing issue preferences for those in Cells 2 and 4 versus Cells 1 and 3 of Table 2, the respondents who were shown their MC’s votes. Footnote 11 reports the Survey 3 respondents in Cells 5 and 6, who were shown no votes.)
Basis Survey 1 has no Cells 5 and 6. For Survey 3, the archived code (Survey 3 Analysis.do) estimates the Figure 6 effect on the 2,341 respondents who were shown votes (−0.021 standard deviations). Pooling all six cells (3,519 respondents) gives 0.010 standard deviations (p = 0.64), also null.
p. 820, Support for Legislative Bipartisanship
Published
The difference in these effects is not significant (d = −0.11, p = 0.17) but, if anything, indicates that respondents assigned to have decreased affective polarization rewarded bipartisan behavior less.
Correction
The difference in these effects is significant (d = −0.165, p = 0.040) and runs opposite to the literature’s prediction: respondents assigned to have decreased affective polarization rewarded bipartisan behavior less.
Basis The archived Survey 2 model (Study 2 Analyses.do: approval on the trust game, the bipartisan treatment, their interaction, pid_strength and pid7, robust standard errors) gives a difference of −0.154 on the 1–5 approval scale (SE 0.075, 95% CI [−0.300, −0.007]), which is −0.165 standard deviations of the outcome. Figure 7 plots this estimate, with a confidence interval that excludes zero.
p. 820, Figure 7, y-axis
Published
Effect on Approval of MC, in Standard Deviations
Correction
Effect on Approval of MC (1–5 approval scale). The plotted estimates are 0.082 (high affective polarization condition), −0.072 (low affective polarization condition) and −0.154 (difference), in approval-scale points.
Basis The plotting script (2_make_graphs_surveys_1_2_3_4.R) divides each estimate by the standard deviation of the outcome and then multiplies it back by the same standard deviation (0.933) before drawing Figure 7, so the axis is in raw units.
p. 821, footnote 12
Published
Following Kingzette et al. (2021), we examine the effects on the norms scale by party and find nulls for both parties.
Correction
Following Kingzette et al. (2021), we examine the effects on the norms scale by party. In Surveys 2 and 4 we find nulls for both parties. In Survey 1 we find a null for Democrats (0.034 standard deviations, p = 0.63) and a decrease in opposition to democratic norms among Republicans (−0.156 standard deviations, p = 0.020), the direction the literature predicts. One of the six party-specific estimates is significant.
Basis The archive runs the by-party model only for Survey 2 (Study 2 Analyses.do: the norms scale on the trust game, pid_strength and pid7 among Democrats or among Republicans, robust standard errors). The same model applied to Surveys 1 and 4 gives the estimates above, in standard deviations of the norms scale within party, as the effect of the positive trust game. The four Survey 2 and Survey 4 estimates all have p ≥ 0.12.
p. 822, footnote 13
Published
The result that Democrats in the high affective polarization condition say they perceive higher levels of unemployment just meets the conventional threshold for statistical significance (p = 0.03) and does not survive adjusting for multiple comparisons.
Correction
The result that Democrats in the high affective polarization condition say they perceive higher levels of unemployment just meets the conventional threshold for statistical significance (p = 0.049) and does not survive adjusting for multiple comparisons.
Basis Survey 4 Analysis.do, Democrats, robust standard errors: −0.113 standard deviations, the Democrats’ unemployment row of Figure 9. Classical and HC3 standard errors, and a model without covariates, give p between 0.048 and 0.054.
p. 822, Figure 9
Published
Figure 9, Republicans: “Perception of *lower* unemployment” (plotted at about 0.00) and “Perception of *fewer* COVID deaths” (plotted at about +0.06).
Correction
Corrected Figure 9. With the Republican outcomes reversed as their labels state, the effect of reducing affective polarization on perceptions of lower unemployment is −0.002 standard deviations (published 0.002) and on perceptions of fewer COVID deaths is −0.064 (published 0.064). Neither is significant (p = 0.98 and 0.34). The Democrats’ rows are unchanged.
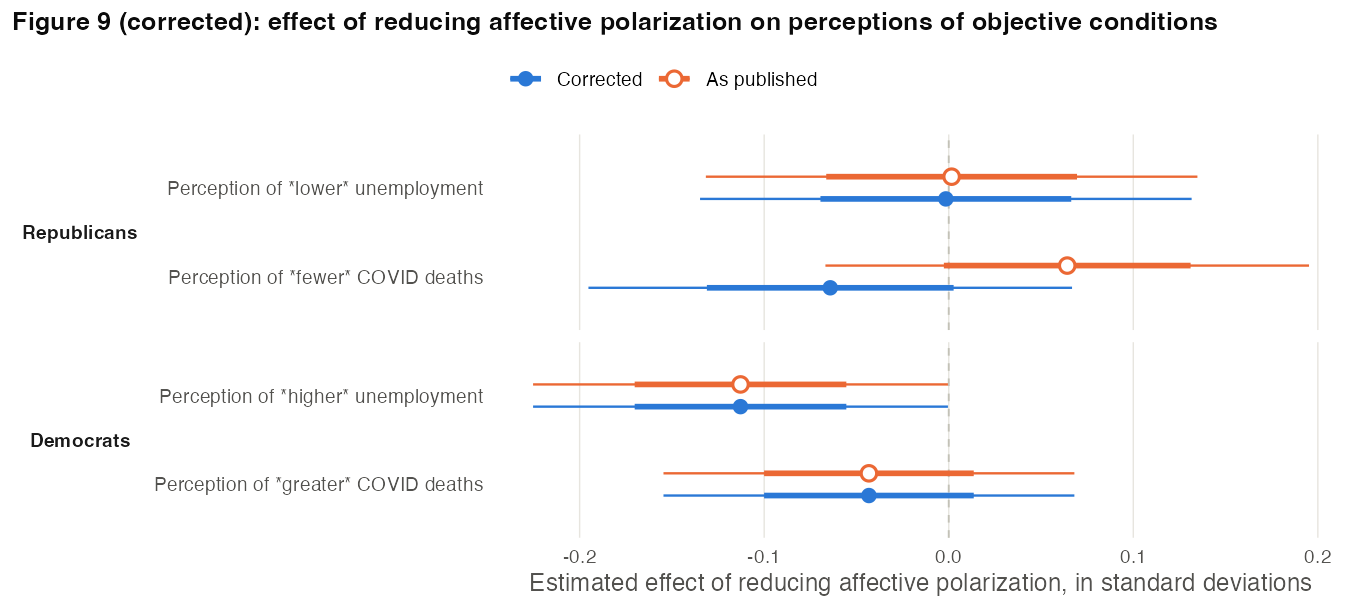
Basis Survey 4 Analysis.do (lines 20–22) applies 11 − x and then 7 − x to Republicans’ unemployment perception, which nets to x − 4 and leaves the scale unreversed, and it never reverses the COVID item (1–6 scale). Hollow points show the published estimates. The two Republican t-statistics in Figure A9 and the two Republican points in Figure A10 change sign in the same way; see the correction to Appendix H.
p. 825, Survey 5
Published
Finally, consistent with Survey 5’s evidence, recent articles by Voelkel (2021) and Santoro and Broockman (2021)
Correction
Finally, consistent with Survey 5’s evidence, recent articles by Voelkel et al. (2021) and Santoro and Broockman (2021)
Basis The cited preprint has nine authors (Voelkel, Chu, Stagnaro, Mernyk, Redekopp, Pink, Druckman, Rand and Willer), as the reference list and footnote 14 show.
Supplementary information
SI p. 2, Appendix B (Pre-Analysis Plans)
Published
Across these PAPs we pre-registered 26 primary hypotheses, all of which we report in the main text or appendix of this article.
Correction
Across these PAPs we pre-registered 26 primary hypotheses, all of which we report in the main text or appendix of this article. Three analyses depart from the plans. First, the Survey 5 plan commits to analyzing an item asking whether respondents think the outparty agrees with them on issues, as a test of the exclusion restriction, and says a treatment that fails the test may be dropped or analyzed separately. Survey 5 asked this item (Q139 in the questionnaire), but it is not in the deposited data and the test is not reported. Second, the Survey 1 plan specifies the norms regressions with pid_strength as the only covariate, and the reported models add voter_republican. With the planned covariate, the effect of the positive trust game on the norms index is −0.065 standard deviations (p = 0.18; reported model: −0.067), and none of the four vignette effects is significant. Third, the Survey 1 plan tests party following separately for respondents with copartisan and with outpartisan MCs, on the share of issues on which the respondent agrees with the MC; Figure 6 pools the two groups on the party-consistent share and controls for the interaction of MC party and the pretreatment share. The planned tests give changes of 0.008 (p = 0.56) and 0.000 (p = 0.98) in that share.
Basis Survey 1 plan (osf.io/kde27, sections 4.4–4.5) and Survey 5 plan (osf.io/v3qc8, section 4.1), both linked in Appendix B; the Survey 5 questionnaire and data are in the replication archive. None of these departures changes a result.
SI p. 3, Table A1, column headers
Published
DV = Outparty - Inparty
Correction
DV = Inparty - Outparty
Basis Table A1.do (Survey 4) defines the outcomes as therm_inparty − therm_outparty and therm_inpartyelites − therm_outpartyelites. With that outcome, the Strong Democrat × Positive Game Experience coefficient is −15.7, as printed: the positive game narrows the in-party minus out-party gap.
SI p. 13, Table A5, Survey 1, Positive vs. Negative
Published
[-0.530, -0.285]
Correction
[−0.544, −0.185]
Basis The published interval is what the archived do-file (5_bounds_Table A5.do) returns with the SSC leebounds package. The package copies each trimming cutoff into a local macro and tests for ties against that copy. For Survey 1 the copy differs from the stored value in its last digit, so no ties are found and the respondents at the cutoffs stay in the trimmed sample (bounds −0.448 to −0.376). Trimming exactly the 5.0% share that Lee’s method requires gives bounds of −0.462 to −0.275 and the Imbens-Manski interval above. The published upper limit, −0.285, lies inside the identified set. The corrected interval still excludes zero.
SI p. 23, Appendix G
Published
Finally, when applying a False Discovery Rate adjustment to all the p-values across all the t-statistics, all the manipulation check and general social distance items remain significant at the conventional threshold, but none of the formerly significant outcomes in the other areas do.
Correction
Finally, when applying a Benjamini-Hochberg False Discovery Rate adjustment to all the p-values across all the t-statistics, all the manipulation check items and 4 of the 6 general social distance items remain significant at the conventional threshold, and none of the formerly significant outcomes in the other areas do. The two exceptions among the general social distance items are the Survey 4 item on a child marrying an outpartisan (q = 0.057) and the Survey 5 item on outparty neighbors (q = 0.115).
Basis The archive contains no code for this adjustment. The q-values apply the Benjamini-Hochberg adjustment to two-sided p-values for the 92 t-statistics in Figure A9, selected and oriented as in 2_make_graphs_surveys_1_2_3_4.R. With one-sided p-values in the predicted direction, the child-marries item is significant (q = 0.028) and the neighbor item is not (q = 0.061). The smallest q among the political outcomes is 0.08.
SI p. 24, Figure A10, notes
Published
The x-axis value corresponds with the experimental estimate presented in the article on standardized versions of each outcome. The y-axis value is a non-causal endogenous estimate of the same effect
Correction
The x-axis value is a non-causal endogenous estimate of the same effect [...]. The y-axis value corresponds with the experimental estimate presented in the article on standardized versions of each outcome.
Basis The caption (“Comparing Endogenous Estimates (x-axes) with Experimental Estimates (y-axes)”) and the plotting script, which puts the rescaled endogenous estimate on the x-axis, agree with the corrected notes.
SI p. 24, Appendix H
Published
Approximately 79% of the endogenous estimates are positive, meaning that a version of this article which followed existing literature in examining the observational relationship between affective polarization and these political outcomes would have reported nearly all positive results. However, only 46% of the experimental estimates are positive, essentially a coin flip. Moreover, 63% of the endogenous estimates are larger than the experimental estimates
Correction
Approximately 83% of the endogenous estimates are positive, meaning that a version of this article which followed existing literature in examining the observational relationship between affective polarization and these political outcomes would have reported nearly all positive results. For the same outcomes, 65% of the experimental estimates are positive (34 of 52). Moreover, 63% of the endogenous estimates are larger than the experimental estimates
Basis The archived script (2_make_graphs_surveys_1_2_3_4.R, lines 626–629) averages each share over the rows where it is defined. The endogenous shares therefore cover the 52 outcomes with an endogenous estimate, while the 46% covers every reduced-form row, including manipulation checks and feeling thermometers (rebuilt from the archive: 47% of 123 rows). The corrected shares use the 52 matched outcomes and the corrected orientation of the two Republican perception outcomes (see the correction to Figure 9). With the archived orientation the three shares are 79%, 62% (32 of 52) and 63%.