

The paper
Derek E. Holliday, Yphtach Lelkes, and Sean J. Westwood (2025). Why depolarization is hard: Evaluating attempts to decrease partisan animosity in America. Proceedings of the National Academy of Sciences 122(39), e2508827122.
doi:10.1073/pnas.2508827122 (opens in a new tab) · Replication data: osf.io/6yzsm (opens in a new tab)
Main text
p. 1, Abstract
Published
This study comprehensively evaluates existing interventions through a meta-analysis of 77 treatments from 25 published studies and two large-scale experiments.
Correction
This study comprehensively evaluates existing interventions through a meta-analysis of 80 treatment effects from 25 published studies and two large-scale experiments.
Basis SI Table S1 and the random-effects model in the replication code (Code/figure_1.R) both use 80 effects. The figure 77 counts distinct author-treatment labels, and 3 labels each cover two separate effects. The Fig. 1 caption gives a third count, 73 (see the correction to p. 2).
p. 2, Do Existing Interventions Work?
Published
Our analysis identified 25 studies encompassing 77 distinct interventions.
Correction
Our analysis identified 25 studies encompassing 80 treatment effects.
Basis See the correction to the Abstract.
p. 2, Do Existing Interventions Work?
Published
After 125 d, 25% of panelists had at some point increased their warm evaluations of out-partisans by 5.4 points or more.
Correction
After 125 d, 24% of panelists had at some point increased their warm evaluations of out-partisans by 5.4 points or more.
Basis Counting only pairs of survey waves no more than 125 days apart gives 23.7%. The posted code gives 25.0% because it also counts increases measured across longer gaps (see the correction to Fig. 2B, p. 3).
p. 2, Fig. 1 caption
Published
Fig. 1. Depolarization initiatives have relatively small effects, according to a meta-analysis (n = 73). [...] Panel (C) shows depolarization effects typically decay within 2 wk (n = 20, grouped by treatment).
Correction
Fig. 1. Depolarization initiatives have relatively small effects, according to a meta-analysis (n = 80). [...] Panel (C) shows depolarization effects typically decay within 2 wk (n = 34 follow-up estimates of 22 treatment effects from 10 studies, grouped into 19 treatments).
Basis Panels A and B plot the 80 effects listed in SI Table S1. The follow-up rows of the meta-analysis data hold 34 estimates of 22 treatment effects, which Code/figure_1.R averages within 19 treatment groups before averaging across them.
p. 2, Fig. 1C
Published
Fig. 1C bar labels: “11 Studies (4 Treatments), Mean ATE = 7.5”; “12 Studies (12 Treatments), Mean ATE = 2.3”; “11 Studies (5 Treatments), Mean ATE = 1.7”.
Correction
Corrected Fig. 1C. The bar labels count follow-up estimates. One week or less: 11 estimates from 4 studies (4 treatments), mean ATE 6.7. One to two weeks: 12 estimates from 3 studies (12 treatments), mean ATE 2.3. More than two weeks: 11 estimates from 5 studies (5 treatments), mean ATE 1.7. With the Landry et al. follow-up corrected (see the correction to SI Table S2), the first bar retains 74% of the original effect (published: 73%) and its mean follow-up ATE is 6.7 (published: 7.5).
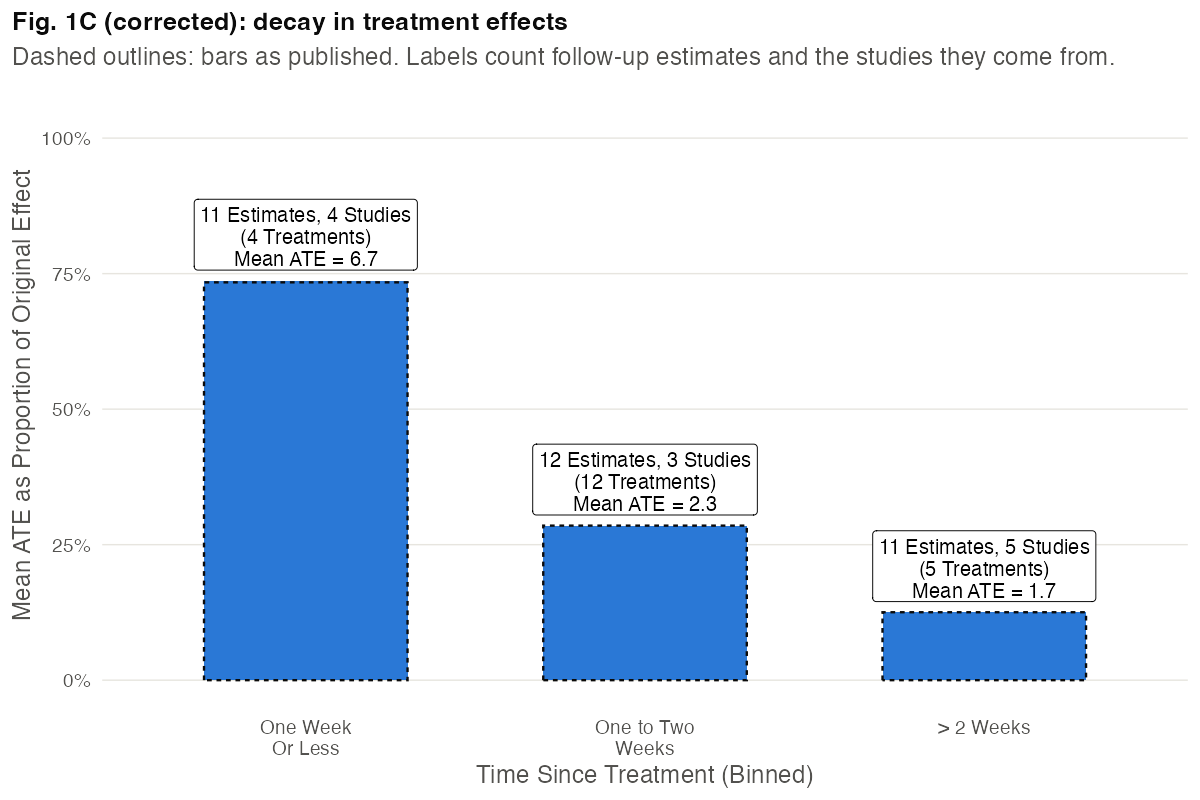
Basis Code/figure_1.R builds each label from n, the number of follow-up estimates in the bin, and n2, the number of treatment groups, and prints n as “Studies”. Dashed outlines show the published bars.
p. 3, Fig. 2B
Published
Fig. 2B, y axis “Proportion Panelists Moving > Meta-Analysis ATE (5.4)”, by days passed.
Correction
Corrected Fig. 2B. Counting only pairs of waves no more than x days apart, the share of panelists whose out-party warmth rose by at least 5.4 points is 2.6% at 21 days (published curve: 4.1%), 6.6% at 30 days (published: 8.8%) and 23.7% at 125 days (published: 25.0%). Over the same 125 days, 23.1% of panelists fell by at least 5.4 points.
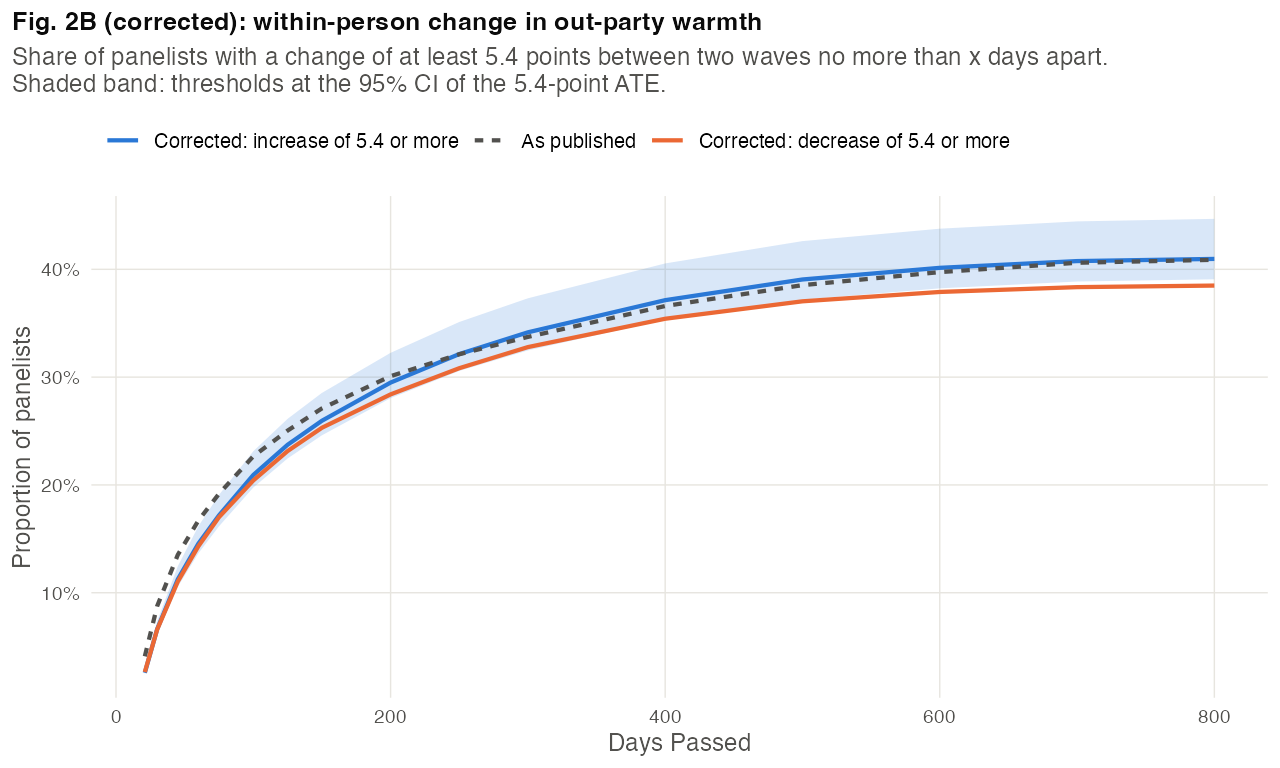
Basis Code/figure_2.R flags a panelist with a running count over pairs of waves ordered by wave, so an increase measured across a long gap also counts at every shorter horizon that follows it in that order. Its slice_max() step also keeps ties (11,264 rows for 11,203 panelists at 125 days). The denominator is all 17,871 panelists, as in the published figure. The dashed line is the published curve.
p. 3, Do Existing Interventions Work?
Published
Of the 77 interventions, 20 included recontact data, with follow-up periods ranging from less than a week to more than two weeks.
Correction
Of the 80 treatment effects, 22 included recontact data, with follow-up periods ranging from less than a week to more than two weeks.
Basis The follow-up rows of the meta-analysis data cover 22 treatment effects from 10 studies. See also the corrections to the Abstract and to Fig. 1 (p. 2).
p. 5, Fig. 5
Published
Fig. 5. Depolarization interventions only modestly increase out-party warmth, but do not affect other attitudes and do not increase in effectiveness with repetition. [...] n = 2,284 respondents.
Correction
Fig. 5. Depolarization interventions only modestly increase out-party warmth, do not significantly change affective polarization, affect other attitudes in only two comparisons with control (political violence at one dose and trust at three doses), and do not increase in effectiveness with repetition. [...] n = 2,284 completions by 2,182 respondents.
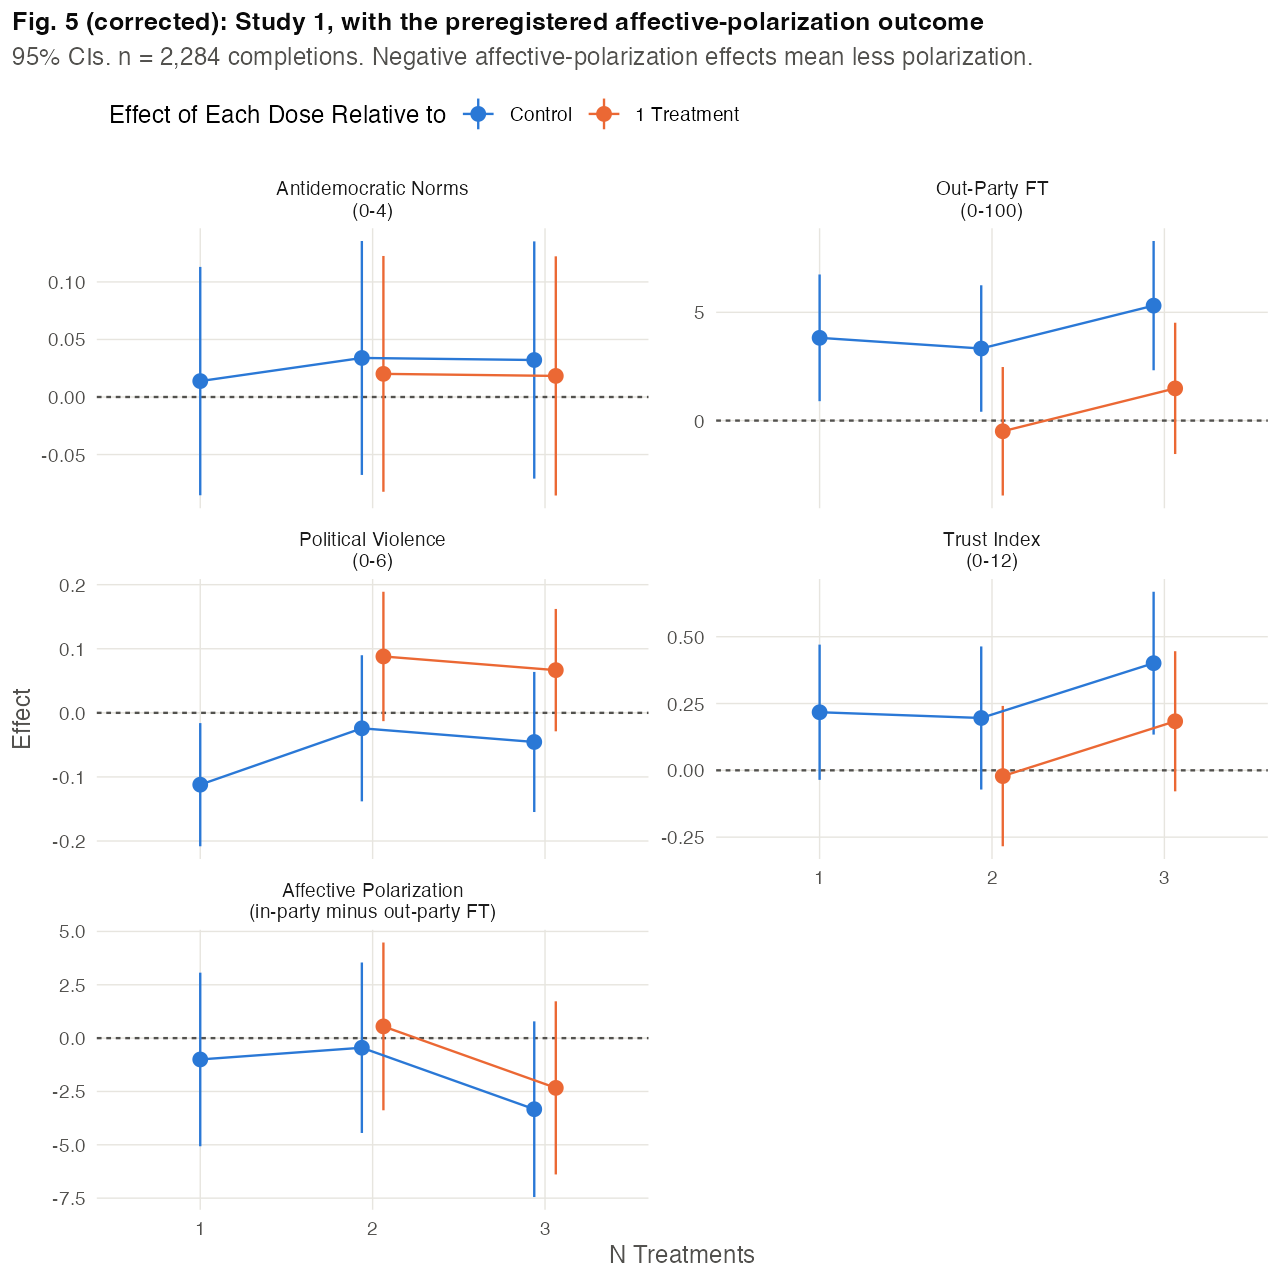
Basis In the published figure the 95% CIs for trust at three doses and for political violence at one dose exclude zero. The corrected figure adds the preregistered affective-polarization outcome; the four published panels are unchanged. On the sample count, see the next correction.
p. 5, Study 1
Published
2,284 respondents completed the entirety of the study.
Correction
2,284 responses, from 2,182 distinct respondents, completed the entirety of the study. 73 respondents completed the study between 2 and 6 times (175 completions). Each attempt was randomized anew: 60 of these respondents were assigned to different conditions across attempts, and 30 saw both the control vignette and a treatment. Keeping only each respondent's first randomized attempt (2,163 completions), the effects on out-party warmth are 3.44, 3.23 and 5.15 for one, two and three doses. Dropping the 92 respondents randomized more than once (2,091 completions remain), they are 3.53, 3.34 and 5.25.
Basis Counts use the vendor respondent ID in the posted Study 1 file (dta_s1.rds); the 4 completions without an ID are counted as distinct respondents. The published estimates on all 2,284 completions are 3.82, 3.33 and 5.31.
p. 5, Study 1
Published
While we do observe an increase in out-party warmth for all dosage amounts relative to the control condition (1 dose ATE = 3.82, SE 1.49; 2 dose ATE = 3.33, SE 1.49; 3 dose ATE = 5.31, SE 1.52), the effects are smaller in magnitude than those reported in the original MegaStudy, and we find no effects for any other outcome of interest.
Correction
While we do observe an increase in out-party warmth for all dosage amounts relative to the control condition (1 dose ATE = 3.82, SE 1.49; 2 dose ATE = 3.33, SE 1.49; 3 dose ATE = 5.31, SE 1.52), the effects are smaller in magnitude than those reported in the original MegaStudy. No dose significantly changes affective polarization, the first outcome in our preanalysis plan (in-party minus out-party feeling thermometer; 1 dose ATE = −1.00, SE 2.08; 2 dose ATE = −0.45, SE 2.04; 3 dose ATE = −3.33, SE 2.10). Of the other outcomes, three doses raise the trust index by 0.40 points (SE 0.14, P = .003; P = .047 after Holm adjustment across the 15 dose-by-outcome comparisons with control), one dose lowers the political violence count by 0.11 (SE 0.05, P = .022; P = .269 after adjustment), and no dose affects support for antidemocratic norms.
Basis Both preregistrations (AsPredicted #183,206 and #189,171) list affective polarization as the first key dependent variable; out-party warmth on its own is not listed. Estimates use calc_ate in the posted Code/functions.R. In-party warmth also rose (2.91, 2.94 and 2.01 points), so the in-party minus out-party gap narrowed by less than out-party warmth rose. Negative affective-polarization effects mean less polarization.
p. 5, Study 2
Published
Fig. 6A presents the results for out-party affect, our primary outcome of interest. [...] To ensure transparency and adhere to our preanalysis plan (PAP), we also report the full set of outcomes collected, including support for antidemocratic norms, political violence, and political trust.
Correction
Fig. 6A presents the results for out-party affect, the outcome measured in the meta-analysis. [...] To ensure transparency, we also report the other outcomes collected: affective polarization (in-party minus out-party feeling thermometer), which our preanalysis plan (PAP) lists first, and support for antidemocratic norms, political violence, and political trust. On affective polarization the pooled T0 effect is −2.51 (SE 1.57, P = .11). Of the six comparisons of a treatment arm with control at T0, T1 and T2, only the New Treatment arm at T2 differs significantly (−4.07, SE 1.87, P = .030).
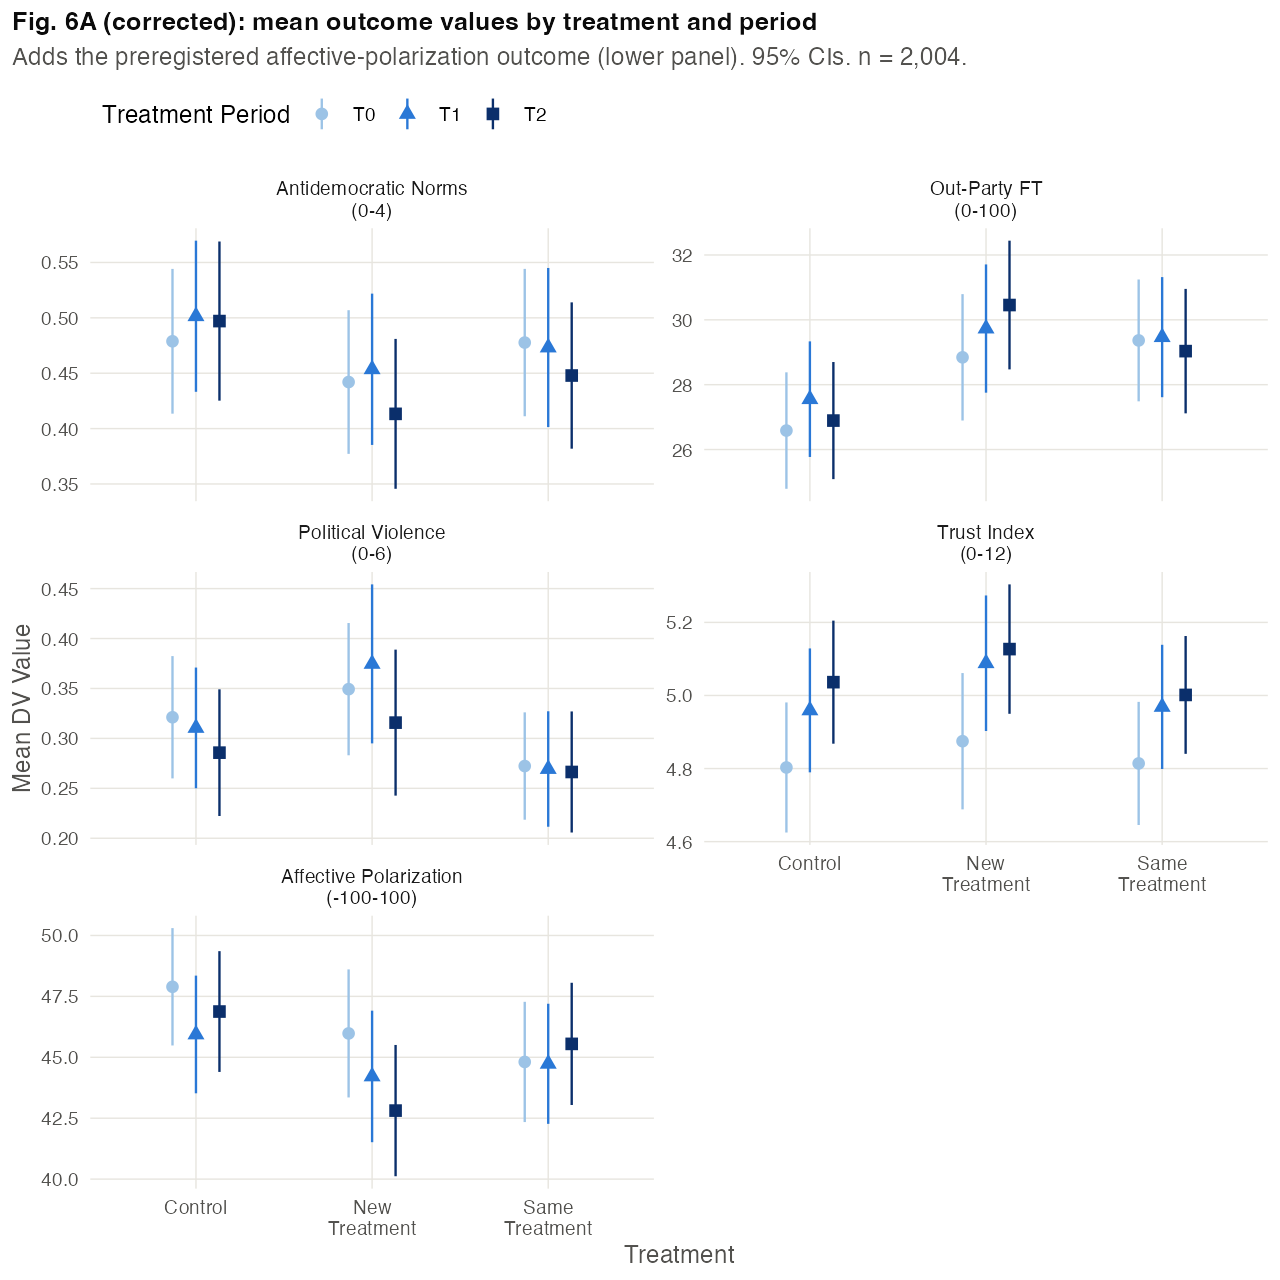
Basis The posted Code/figure_6.R computes the affective-polarization means and removes them before plotting; the corrected Fig. 6A restores that panel. Estimates are OLS on the three-wave sample (n = 2,004), as in SI Table S7. Negative values mean less polarization.
pp. 6-7, Materials and Methods, Study Details
Published
Respondents in Study 2 were initially randomized to one of 3 treatment groups (Control, Same Treatment, and Different Treatments). [...] Respondents in the “Different Treatment” group saw Pro-Democracy Bipartisan Elite Cues in T1 and Sympathetic Personal Narratives in T2.
Correction
Respondents in Study 2 were initially randomized to one of 3 treatment groups (Control, Same Treatment, and Different Treatments). Respondents who restarted the T0 survey were randomized again: 122 of the 2,004 respondents in the three-wave sample started T0 more than once, 97 of them were assigned to different groups across attempts, and for 83 the analysis uses a group other than the one first assigned. One further respondent carries a different group label at T0 than at T1 and T2. [...] Respondents in the “Different Treatment” group saw Pro-Democracy Bipartisan Elite Cues in T1 and Sympathetic Personal Narratives in T2, except 39 who saw Sympathetic Personal Narratives in T1 (27 of them in the three-wave sample). Excluding the 97 respondents with conflicting assignments, the pooled T0 effect on out-party warmth is 2.66 (SE 1.20); the published estimate is 2.5 (SE 1.2).
Basis From the posted T0 file (Data/SI/dta_s2_t0.rds), the T1 and T2 file (Data/SI/dta_s2_t1-2.rds) and the analysis file (Data/dta_s2.rds). Of the 804 Different Treatment respondents at T1, 39 are recorded as receiving Sympathetic Personal Narratives.
Supplementary information
SI p. 3, Table S1
Published
Landry et al. 2022 0 1 cold metadehumanization (3) 21.00 6.00
Correction
Landry et al. 2022 0 100 cold metadehumanization (3) 11.33 1.16
Basis Landry et al. (2022), Study 3, report the Wave 1 effect on negative affect (the out-party feeling thermometer, 0–100, reversed) as b = −.21, d = .43, SE = 1.16, t = −9.77. The coefficient is standardized; in thermometer points the effect is 9.77 × 1.16 = 11.33. The meta-analysis data code −0.21 on a 0–1 scale, which Code/figure_1.R converts to 21 points. With the corrected row the pooled ATE is 5.39 (SE 0.39); the posted model gives 5.36 (SE 0.39). The printed 5.4 (SE 0.4) is unchanged, and the largest effect in the table becomes America in One Room (14.19), the effect behind the “best possible” shift in Fig. 2A.
SI p. 4, Table S2
Published
Landry et al. 2022 0 1 cold metadehumanization (3) 6.42 8.00
Correction
Landry et al. 2022 0 100 cold metadehumanization (3) 6.42 4.45
Basis The same row codes the Wave 2 follow-up the same way. The source reports b = −.08, d = .16, SE = 1.21, t = −3.68, or 3.68 × 1.21 = 4.45 thermometer points. Fig. 1C is corrected accordingly (see p. 2).
SI p. 9, section 2.5 (Pre-Registration)
Published
We observe no deviations from our pre-analysis plans.
Correction
Our analyses deviate from the pre-analysis plans in three ways. First, both plans list affective polarization (in-party minus out-party feeling thermometer) as the first key dependent variable; the main text reports out-party warmth, the outcome measured in the meta-analysis. The table below reports the preregistered outcome. Second, both plans call for Manski bounds; Fig. S1 reports them for Study 1, and section 3.2 reports them for Study 2 (see the correction to p. 11). Third, both registrations state that no data had been collected, but 10 Study 1 responses (5 of them analyzed) were recorded before the Study 1 registration (July 16, 2024, 10:16 PT), and 153 Study 2 T0 responses (102 passing the attention check, 60 in the three-wave sample) before the Study 2 registration (September 6, 2024, 17:58 PT). Excluding these responses, the Study 1 effects on out-party warmth are 3.87, 3.38 and 5.36, and the Study 2 pooled T0 effect is 2.68 (SE 1.19). Both registrations were filed anonymously for peer review and still do not name the authors.
Preregistered first outcome, affective polarization (in-party minus out-party feeling thermometer; negative values mean less polarization), with out-party warmth for comparison. OLS of each outcome on a treatment indicator, as in calc_ate (Code/functions.R). Standard errors in parentheses; * p<0.05; ** p<0.01; * p<0.001. Study Contrast Affective polarization Out-party FT (published) N Study 1 1 dose vs. control −1.00 (2.08) 3.82 (1.49)* 1,184 Study 1 2 doses vs. control −0.45 (2.04) 3.33 (1.49)* 1,152 Study 1 3 doses vs. control −3.33 (2.10) 5.31 (1.52)* 1,154 Study 2 New Treatment vs. control, T0 −1.91 (1.83) 2.26 (1.36) 1,332 Study 2 Same Treatment vs. control, T0 −3.08 (1.81) 2.78 (1.34)* 1,357 Study 2 New Treatment vs. control, T1 −1.72 (1.85) 2.18 (1.37) 1,332 Study 2 Same Treatment vs. control, T1 −1.20 (1.83) 1.91 (1.33) 1,358 Study 2 New Treatment vs. control, T2 −4.07 (1.87)* 3.56 (1.38)* 1,332 Study 2 Same Treatment vs. control, T2 −1.33 (1.86) 2.14 (1.36) 1,358 Basis Registrations AsPredicted #183,206 (Study 1) and #189,171 (Study 2), linked in the article; registration times as printed on them. Response times are the StartDate values in the posted Study 1 and Study 2 T0 files (Pacific time). The Methods give the field dates as July 15 and September 5, also before the registrations.
SI p. 11, section 3.2 (Study 2: Over-Time Treatments)
Published
Table S4: Attrition by Treatment Group (Over-Time)
Correction
Manski bounds for the Study 2 treatment effects, as preregistered and constructed as in Fig. S1, for the 3,359 respondents randomized at T0 who passed the attention check. The bounds are wide: at T2, where 41% of outcomes are missing, the bounds on the out-party warmth effects run from −39.32 to 45.00 points.
Manski bounds for the Study 2 treatment effects relative to control, constructed as in Fig. S1 (calc_manksi in Code/SI/figure_s1.R). Respondents randomized at T0 who passed the attention check; missing T1 or T2 outcomes are set to the observed minimum or maximum. The 95% CI runs from the lower CI of the lower bound to the upper CI of the upper bound. Outcome Wave Arm N Missing (%) Bounds on ATE 95% CI Out-Party FT (0-100) T1 New Treatment vs. Control 2,247 29.7 [−28.26, 31.16] [−30.93, 33.83] Affective Polarization (-100-100) T1 New Treatment vs. Control 2,247 30.0 [−54.70, 52.47] [−59.05, 56.76] Antidemocratic Norms (0-4) T1 New Treatment vs. Control 2,247 28.0 [−1.11, 1.13] [−1.22, 1.24] Political Violence (0-6) T1 New Treatment vs. Control 2,247 28.0 [−1.58, 1.78] [−1.74, 1.95] Trust Index (0-12) T1 New Treatment vs. Control 2,247 28.0 [−3.25, 3.48] [−3.53, 3.76] Out-Party FT (0-100) T1 Same Treatment vs. Control 2,220 28.9 [−27.55, 30.20] [−30.22, 32.83] Affective Polarization (-100-100) T1 Same Treatment vs. Control 2,220 29.1 [−52.90, 51.11] [−57.18, 55.40] Antidemocratic Norms (0-4) T1 Same Treatment vs. Control 2,220 27.2 [−1.08, 1.10] [−1.19, 1.21] Political Violence (0-6) T1 Same Treatment vs. Control 2,220 27.2 [−1.62, 1.64] [−1.78, 1.80] Trust Index (0-12) T1 Same Treatment vs. Control 2,220 27.2 [−3.27, 3.24] [−3.55, 3.52] Out-Party FT (0-100) T2 New Treatment vs. Control 2,247 42.2 [−39.32, 45.00] [−42.07, 47.69] Affective Polarization (-100-100) T2 New Treatment vs. Control 2,247 42.3 [−87.32, 79.14] [−92.18, 84.05] Antidemocratic Norms (0-4) T2 New Treatment vs. Control 2,247 40.7 [−1.59, 1.66] [−1.71, 1.78] Political Violence (0-6) T2 New Treatment vs. Control 2,247 40.7 [−2.28, 2.60] [−2.45, 2.77] Trust Index (0-12) T2 New Treatment vs. Control 2,247 40.7 [−4.77, 4.98] [−5.06, 5.27] Out-Party FT (0-100) T2 Same Treatment vs. Control 2,220 40.5 [−39.13, 41.95] [−41.89, 44.66] Affective Polarization (-100-100) T2 Same Treatment vs. Control 2,220 40.6 [−73.83, 71.62] [−78.30, 76.11] Antidemocratic Norms (0-4) T2 Same Treatment vs. Control 2,220 38.8 [−1.56, 1.55] [−1.67, 1.67] Political Violence (0-6) T2 Same Treatment vs. Control 2,220 38.8 [−2.30, 2.36] [−2.47, 2.53] Trust Index (0-12) T2 Same Treatment vs. Control 2,220 38.8 [−4.66, 4.65] [−4.94, 4.93] Basis Both registrations promise Manski bounds; the published SI reports them only for Study 1 (Fig. S1). Each respondent enters once, in the group of the last completed T0 attempt, which is the attempt the posted analysis file uses for all but 2 of the 2,004 three-wave respondents.