

The paper
Derek E. Holliday, Yphtach Lelkes, and Sean J. Westwood (2024). Affective polarization is uniformly distributed across American States. PNAS Nexus 3(10), pgae310.
doi:10.1093/pnasnexus/pgae310 (opens in a new tab) · Replication data: doi:10.7910/DVN/MFELBL (opens in a new tab)
Main text
p. 2, Data
Published
To that end, we use a nationally representative survey of 99,000 respondents (recruited from the YouGov panel) between 2022 September 15 and 2024 May 30 (54). [...] This yields a final sample of 84,354 respondents.
Correction
To that end, we use a nationally representative survey of 99,000 interviews (recruited from the YouGov panel) between 2022 September 15 and 2024 May 30 (54). [...] This yields a final sample of 84,354 interviews with 55,058 unique respondents, 16,383 of whom were interviewed more than once.
Basis The replication file has one row per interview, and some respondents appear up to 22 times. The Introduction (p. 1) already counts the starting sample as 99,000 interviews. The archive contains only the sample after exclusions, so the 99,000 starting count cannot be checked against it.
p. 3, Table 1
Published
Biden 2020 state voteshare | Biden 2020 2-party voteshare by state [...] State per capita GDP | State GDP per capita income (2022)
Correction
Biden 2020 state voteshare | Biden 2020 share of all votes cast, by state [...] State per capita income | State real per capita personal income (2022)
Basis The state vote-share variable is Biden's share of all votes cast: 36.6% in Alabama and 92.1% in the District of Columbia, where his two-party shares were 37.1% and 94.5%. The income variable is described in the replication file as “Real per capita personal income”; its values run from $45,818 to $73,383 (the District of Columbia). The county vote-share variable is a two-party share, as labeled. The summary statistics in the table are unchanged.
p. 4
Published
Including all geographic and demographic predictors improves RMSE by only 11% over the null model.
Correction
Including all geographic and demographic predictors improves RMSE by only 3.8% over the null model, no more than individual demographic characteristics alone (3.9%).
Basis The published random forests split the interviews into training and test data by row, so respondents interviewed in several waves appear in both: 5,960 of the 12,654 test interviews (47%) come from respondents who are also in the training data. The corrected models split by respondent (50,614 training and 12,654 test interviews) and are tuned by cross-validation grouped by respondent. See the corrected Figure 3.
p. 4, Figure 2
Published
Figure 2, State Characteristics panel, row label “State per capita GDP”.
Correction
State per capita income
Basis See the correction to Table 1. The plotted estimates are unchanged.
p. 4, Figure 3
Published
Figure 3, RMSE by predictor set: Null 32.5, State Only 32.4, All Geographic 31.9, Individual Only 30.9, Individual + State 30.6, Everything (Non-Psych) 28.9, Psychological 28.
Correction
Figure 3 re-estimated with training and test data split by respondent: Null 32.0, State Only 31.9, All Geographic 32.0, Individual Only 30.7, Everything (Non-Psych) 30.8, Psychological 27.7.
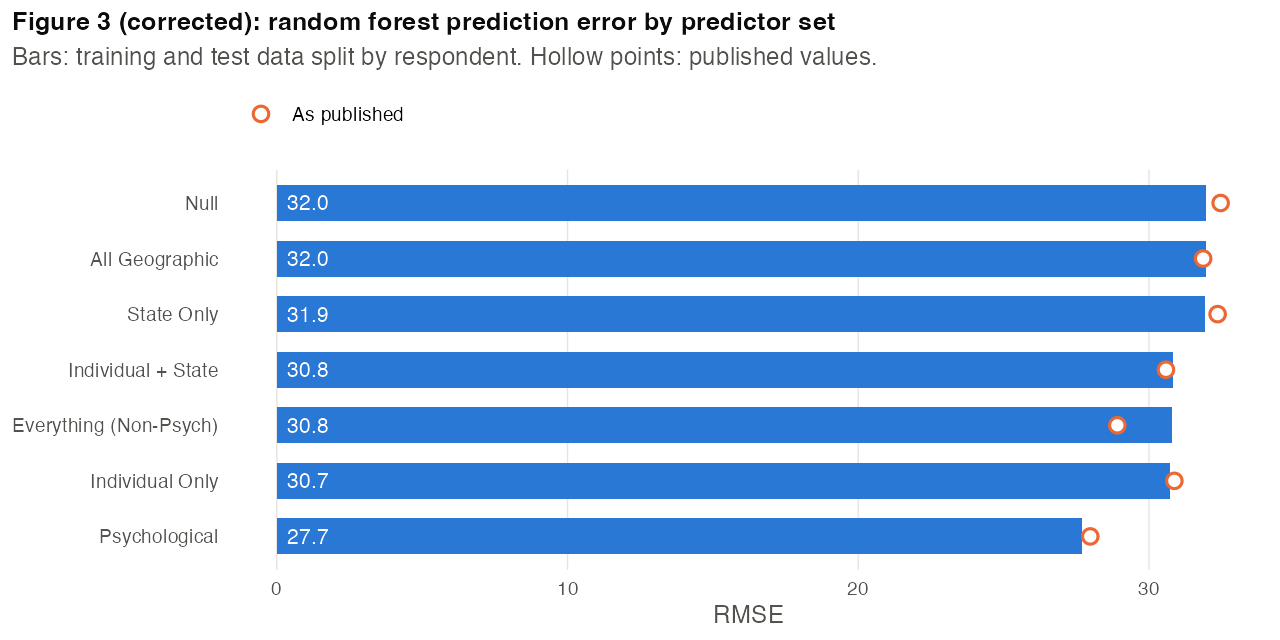
Basis Hollow points show the published values. The models use the published predictor sets, 1,000 trees and a search over the same two tuning parameters (minimum node size and number of predictors sampled at each split), here a six-point grid with five-fold cross-validation grouped by respondent.
p. 5
Published
As is shown in the bottom bar of Figure 3, this model outperforms the fully saturated geography and demographics model (by 3.1%) and the null model (by 13.8%).
Correction
As is shown in the bottom bar of Figure 3, this model outperforms the fully saturated geography and demographics model (by 10.0%) and the null model (by 13.4%).
Basis Re-estimated with training and test data split by respondent (see the correction to p. 4).
p. 5
Published
The geography model has a predictive accuracy of 36.6% compared with 32.7% from the null model, while the individual model is only slightly better at 39.8%. Alternatively, the psychological model has the greatest accuracy, at 46.1%.
Correction
The geography model has a predictive accuracy of 33.6% compared with 32.7% from the null model, while the individual model is only slightly better at 39.2%. Alternatively, the psychological model has the greatest accuracy, at 45.2%.
Basis Re-estimated with training and test data split by respondent, with models selected by ROC AUC as in the published analysis. The combined geography and demographics model, which the text does not quote, falls from 45.0% to 38.3% (see the correction to Figure S3).
p. 5, Conclusion
Published
While it may be tempting for researchers to focus on “battleground” states, where the partisan stakes are greater, our analysis suggests such states are no more affectively polarized than solidly single-party states.
Correction
While it may be tempting for researchers to focus on “battleground” states, where the partisan stakes are greater, such states are only slightly more affectively polarized than other states: the seven 2024 battleground states average 51.1 on the state estimates in Figure 1, compared with 49.2 in the other states.
Basis The published analysis does not compare battleground and other states. The seven states are Arizona, Georgia, Michigan, Nevada, North Carolina, Pennsylvania and Wisconsin. Whether the 1.9-point difference is distinguishable from zero depends on the test: reassigning the battleground label at random among the 51 state estimates gives p = .13, while a regression on all respondents with national weights and standard errors clustered by state gives a gap of 3.2 points (SE 0.9, p = .001).
p. 6, References 3 and 12
Published
3 Keith Chen M, Rohla R. 2018. The effect of partisanship and political advertising on close family ties. Science. 360(6392):1020–1024. 12 Kelly Garrett R, Long JA, Jeong MS. 2019. From partisan media to misperception: affective polarization as mediator. J Commun. [...]
Correction
3 Chen MK, Rohla R. 2018. The effect of partisanship and political advertising on close family ties. Science. 360(6392):1020–1024.
12 Garrett RK, Long JA, Jeong MS. 2019. From partisan media to misperception: affective polarization as mediator. J Commun. [...]
Basis The first authors are M. Keith Chen and R. Kelly Garrett.
p. 7, Reference 66
Published
66 Park DK, Gelman A, Bafumi J. 2017. Bayesian multilevel estimation with poststratification: state-level estimates from national polls. Polit Anal. 12(4):375–385.
Correction
66 Park DK, Gelman A, Bafumi J. 2004. Bayesian multilevel estimation with poststratification: state-level estimates from national polls. Polit Anal. 12(4):375–385.
Basis Political Analysis volume 12 was published in 2004.
Supplementary information
SI p. 6, section 3 (Random Forest Robustness), Figure S3
Published
Figure S3, random forest accuracy (multi-class classification): Psychological 0.461, Everything (Non−Psych) 0.45, Individual + State 0.407, Individual Only 0.398, All Geographic 0.366, State Only 0.336, Null 0.327.
Correction
Figure S3 re-estimated with training and test data split by respondent: Null 32.7%, All Geographic 33.6%, Individual Only 39.2%, Everything (Non-Psych) 38.3%, Psychological 45.2%.
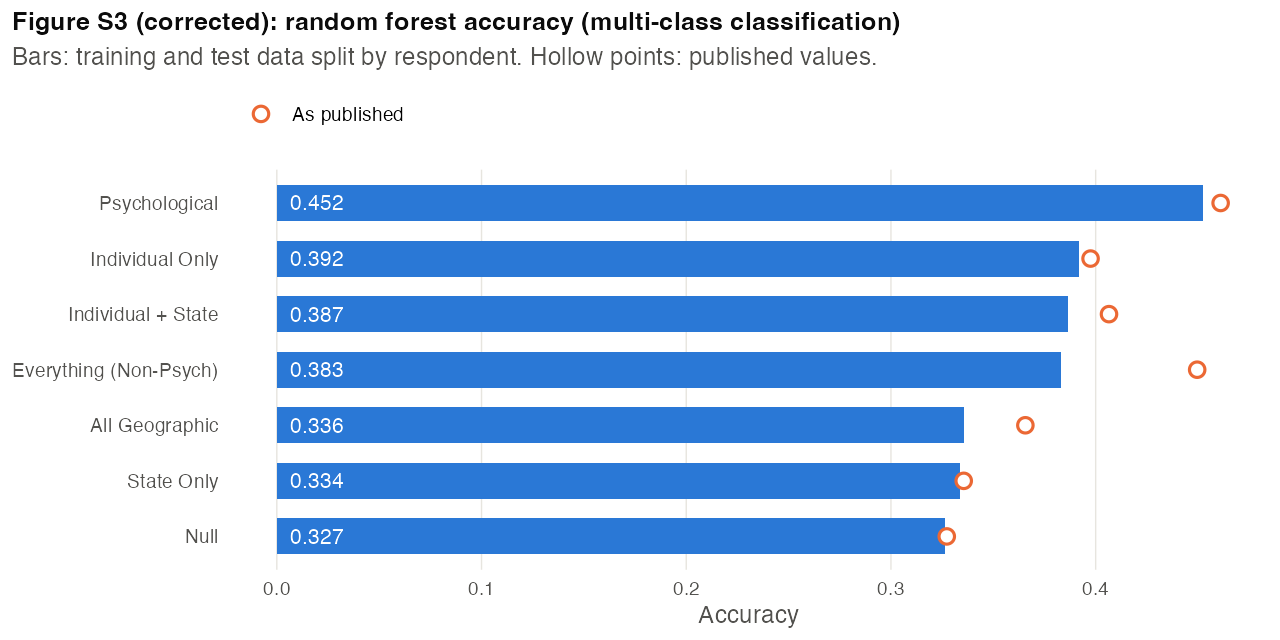
Basis Hollow points show the published values. Tuned as in the corrected Figure 3, with models selected by ROC AUC as in the published analysis.