

The paper
Nicholas C. Dias, Laurits F. Aarslew, Kristian Vrede Skaaning Frederiksen, Yphtach Lelkes, Lea Pradella, and Sean J. Westwood (2024). Correcting misperceptions of partisan opponents is not effective at treating democratic ills. PNAS Nexus 3(8), pgae304.
doi:10.1093/pnasnexus/pgae304 (opens in a new tab) · Replication data: doi:10.7910/DVN/TCNVOC (opens in a new tab)
Main text
p. 1, Introduction
Published
If citizens believe that Democrats and Republicans cannot see eye-to-eye, policy compromise may seem impossible (4). [...] growing partisan animosity, support for partisan violence, and support for undemocratic practices (5, 7–10).
Correction
If citizens believe that Democrats and Republicans cannot see eye-to-eye, policy compromise may seem impossible. [...] growing partisan animosity, support for partisan violence, and support for undemocratic practices (5–8, 10).
Basis Reference 4 (Shi, Zhuang and Wang 2010) concerns cooperation in spatial public-goods games and does not address partisan compromise. Reference 9 is the same Mernyk et al. (2022) article as reference 6. See the correction to the reference list (pp. 8–9).
p. 3, Fig. 1 label
Published
Perceived Out-Party Support for In-Partisan Who Stabbed Prominent Out-Partisan
Correction
Perceived Out-Party Support for Out-Partisan Who Stabbed Prominent In-Partisan
Basis The Methods (p. 6) say participants indicated what percentage of out-partisans would support an out-partisan who committed this crime against the participant's in-party, and the parallel label in Fig. 1 reads “Perceived Out-Party Support for Out-Partisan Who Threw Rocks at In-Partisans”.
p. 3, Meta-analysis
Published
Second, the weighted overall average effects of corrections are not large. On average, corrections moved partisan animosity by about 2.6 percentage points, support for partisan violence (SPV) by 2.1 percentage points, and support for undemocratic practices (SUP) by 2.0 percentage points.
Correction
Second, the weighted overall average effects of corrections are not large. On average, corrections moved partisan animosity by about 3.1 percentage points, support for partisan violence (SPV) by 1.7 percentage points, and support for undemocratic practices (SUP) by 1.7 percentage points.
Basis The archived analysis.R passes the weights to weighted.mean() as y = 1/standard_se. R ignores an argument named y, so the published 2.6, 2.1 and 2.0 are unweighted means of the 67 standardized effects. With the weights the code names (1/SE), the averages are 3.06, 1.73 and 1.66. With inverse-variance weights (1/SE²) they are 3.35, 1.49 and 1.45. Fig. 3 is redrawn around the 1/SE-weighted averages (see the correction to p. 5).
p. 4, Meta-analysis
Published
Indeed, the average effect of corrections on “matching” downstream attitudes was 6.8 percentage points, whereas the average effect on nonmatching attitudes was 1.9 percentage points (SEDifference = 1.23, P < 0.001).
Correction
Indeed, the average effect of corrections on “matching” downstream attitudes was 7.3 percentage points, whereas the average effect on nonmatching attitudes was 1.8 percentage points (SEDifference = 1.09, P < 0.001).
Basis Druckman (2023) showed respondents the out-party's actual support for partisan violence and its actual support for undemocratic practices, each just before the matching question about their own support. The effect on support for undemocratic practices (9.87, SE 1.58) is therefore a matching correction of perceived support for undemocratic practices. The archived existing_tests file codes it as a violence correction on a nonmatching outcome. With that test recoded, 7 of the 67 tests are matching (published: 6) and the difference is 5.45. See the corrected Table S10.
p. 4, Experiment 1
Published
perceptions of what percentage of out-partisans two various undemocratic practices.
Correction
perceptions of what percentage of out-partisans would support two undemocratic practices.
p. 4, Fig. 2 caption
Published
After 30 days, over-time change in perceived out-party support for democratic practices often exceeds the immediate effect of corrections.
Correction
After 30 days, over-time change in perceived out-party support for undemocratic practices often exceeds the immediate effect of corrections.
p. 5, Fig. 3
Published
Fig. 3: funnel plots whose dotted lines and white regions are centered on the “weighted overall average effect” of each outcome; the Druckman (2023) test on support for undemocratic practices is colored as a violence correction.
Correction
Corrected Fig. 3. The dotted lines and funnels are centered on the 1/SE-weighted averages (3.06 for partisan animosity, 1.73 for support for partisan violence and 1.66 for support for undemocratic practices). The Druckman (2023) test on support for undemocratic practices (9.87, SE 1.58) is colored as a correction of perceived support for undemocratic practices.
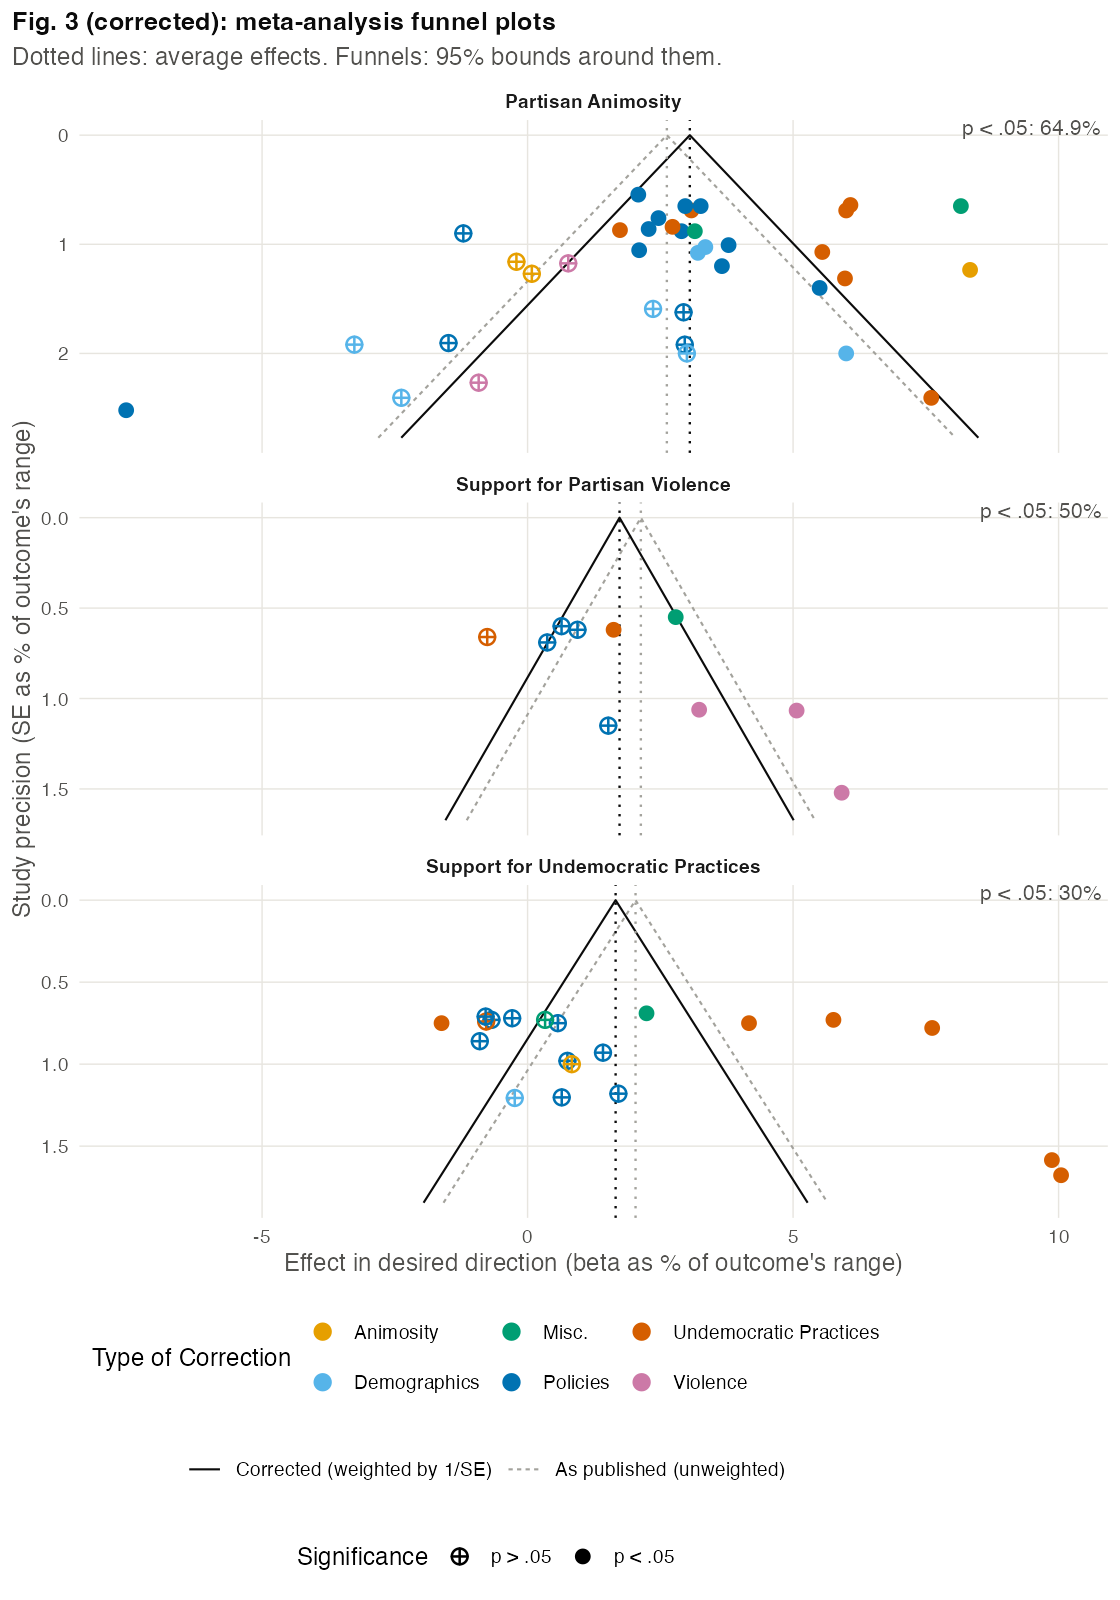
Basis Gray dashed lines show the published funnels, which are centered on unweighted means (see the correction to p. 3). The shares of significant tests are unchanged.
p. 6, Discussion
Published
it could cost as much as $5 billion each year to continuously treat partisan animosity in the adult population—for a net improvement of just 3.7 points on a 201-point scale (see page 14 of our Supplementary Material).
Correction
it could cost as much as $5 billion each year to continuously treat partisan animosity in the adult population—for an improvement of just 5 points on a 201-point scale (see page 14 of our Supplementary Material).
Basis The 3.7 subtracts a 1.3-point growth in partisan animosity that the Supplementary Material attributes to the panel data. No archived script computes that figure, and the archived panel shows animosity (in-party minus out-party thermometer) declining by 3.5 points per year (pooled −3.51, SE 0.60; within-person −3.54, SE 0.40). There is no growth to offset the assumed 5-point effect. See the corrections to SI pp. 14–15.
p. 7, Materials and methods, Panel analysis
Published
To generate Fig. 2, we averaged all items asking whether out-partisans would support an undemocratic practice, generating a scale of perceived out-party support for undemocratic practices (Cronbach’s alpha = 0.85).
Correction
To generate Fig. 2, we averaged the two items asking what percentage of out-partisans would support issuing executive orders to circumvent Congress and censoring media sources that attack in-partisans more than out-partisans, generating a scale of perceived out-party support for these two undemocratic practices (Cronbach’s alpha = 0.70).
Basis The archived change scores equal the mean of these two items in every case and the mean of all six perception items in 4% of cases. The published 0.85 is the alpha of the six items. The Fig. 2 caption and note b describe the same two items.
p. 7, Materials and methods, Experiment 1
Published
The pre-registration for Experiment 1 can be found here: https://osf.io/dqr2s?view_only=f072df56b3004f15bfc1a8b01318d84f.
Correction
The pre-registration for Experiment 1 can be found here: https://osf.io/dqr2s?view_only=f072df56b3004f15bfc1a8b01318d84f. It registered tests of in-party conformity, models that interact the correction with each participant's misperception, and a sample of 2,000. The analyses reported here depart from it (see Supplementary Material, section 7).
Basis See the correction to SI p. 16.
pp. 8–9, References
Published
2 Hye-Yon Lee A. 2022. Social trust in polarized times: how perceptions of political polarization affect Americans’ trust in each other. Polit Behav. 44(3):1533–1554. 4 Shi D-M, Zhuang Y, Wang B-H. 2010. Group diversity promotes cooperation in the spatial public goods game. Europhys Lett. 90(5):58003. 8 Landry AP, Schooler JW, Willer R, Seli P. 2022. Reducing explicit blatant dehumanization by correcting exaggerated meta-perceptions. Soc Psychol Personal Sci. 14:19485506221099146. 9 Mernyk JS, Pink SL, Druckman JN, Willer R. 2022. Correcting inaccurate metaperceptions reduces Americans’ support for partisan violence. Proc Natl Acad Sci U S A. 119(16):e2116851119.
Correction
2 Lee AH-Y. 2022. Social trust in polarized times: how perceptions of political polarization affect Americans’ trust in each other. Polit Behav. 44(3):1533–1554.
4 Deleted (see the correction to p. 1).
8 Landry AP, Schooler JW, Willer R, Seli P. 2022. Reducing explicit blatant dehumanization by correcting exaggerated meta-perceptions. Soc Psychol Personal Sci. 14(4):407–418.
9 Deleted (duplicate of reference 6).
Basis Reference 2 is by Amber Hye-Yon Lee. Reference 8's volume and page field printed the article's DOI suffix.
Supplementary information
SI p. 10, Table S2
Published
Druckman (2023) NA Support for Undemocratic Practices Violence 9.87 1.58 [...] Landry, Schooler, and Seli (2023)
Correction
Druckman (2023) NA Support for Undemocratic Practices Undemocratic Practices 9.87 1.58 [...] Landry, Schooler, Willer, and Seli (2023)
Basis Druckman (2023): see the correction to p. 4. The Landry et al. author list follows reference 8 and applies to every Landry row.
SI p. 14, section 6
Published
Accounting for growth in partisan animosity over the past year—roughly 1.3 points, according to our panel data—these massive expenditures would translate into a net 3.7 point reduction in partisan animosity (on a 201-point scale).
Correction
Our panel data show no growth in partisan animosity to offset: between September 2022 and November 2023, animosity declined by about 3.5 points per year. These massive expenditures would therefore translate into the assumed 5-point reduction in partisan animosity (on a 201-point scale).
Basis Animosity is the in-party minus the out-party thermometer in the archived panel (pooled trend −3.51 per year, SE 0.60; within-person −3.54, SE 0.40; standard errors clustered by panelist). No archived script produces the 1.3-point figure.
SI p. 15, Table S6
Published
% change in partisan animosity 1.3% 1.3%; Cost per percentage-point reduction in partisan animosity $170,091,409 $1,353,994,981
Correction
Corrected Table S6.
Corrected Table S6: Costs and Effects of Correcting Misperceptions at Scale. Rows 1-5 are unchanged; the last two rows use the 5-point reduction. Correction = Engagement Correction = Click American adults on Facebook 239,000,000 239,000,000 Cost per user (as of 12/7/2023) $0.101 $0.804 Cost of one correction $24,139,000 $192,156,000 Yearly cost of correcting every 14 days $629,338,214 $5,009,781,429 Society-wide reduction in partisan animosity (on a 201-point scale) 5 5 % change in partisan animosity 2.5% 2.5% Cost per percentage-point reduction in partisan animosity $125,867,643 $1,001,956,286 Basis The published cost per point divides the yearly cost by the 3.7-point net figure (see the correction to SI p. 14). A 5-point reduction on a 201-point scale is a 2.5% change.
SI p. 16, section 7 (Deviations from Pre-Registration)
Published
In Experiments 2 and 3, we pre-registered to pool across the Poll Subject’s Role and Poll Party conditions. As shown in Table S7 below, pooling does not substantively change our null results.
Correction
In Experiments 2 and 3, we pre-registered to pool across the Poll Subject’s Role and Poll Party conditions. As shown in Table S7 below, pooling does not substantively change our null results. Experiment 1 also departs from its registration (https://osf.io/dqr2s, “Does In-Party Conformity Undermine Democratic Norms?”). The registration states three hypotheses: partisans’ willingness to subvert democracy follows the in-party (H1); this relationship increases with need for belonging (H1a); and it is more sensitive to misperceptions of the in-party than of the out-party (H2). It specifies models that interact the correction with the gap between each participant’s perception and the correct figure, and a sample of 2,000. The main text reports the effect of the out-party correction on participants’ own support for undemocratic practices, and Table S3 reports the in-party correction. The registered gap-interaction and need-for-belonging models are not reported, and the archived Experiment 1 data do not contain the pre-treatment perception or need-for-belonging measures they require. The achieved sample was 1,641 (845 in the out-party condition and 796 in the in-party condition).
Basis The registration is public at the view-only link printed in the Methods (p. 7). The archived Experiment 1 file contains the treatment indicators, the post-treatment perception and the outcome.
SI p. 16, Table S7 note
Published
n3 = 1,642; n4 = 2,484.
Correction
n2 = 1,642; n3 = 2,484.
SI p. 19, Table S10
Published
Table S10: “(Intercept)” 1.937* (0.369); “Correction and Hostile Attitude are Near-Identical” 4.881* (1.233); “R2” 0.194.
Correction
Corrected Table S10.
Corrected Table S10, with the Druckman (2023) support-for-undemocratic-practices test coded as a matching correction. + p < 0.1, * p < 0.05, ** p < 0.01, * p < 0.001. (1) (Intercept) 1.804* (0.352) Correction and Hostile Attitude are Near-Identical 5.450* (1.090) Num.Obs. 67 R2 0.278 R2 Adj. 0.267 AIC 328.6 BIC 335.2 Log.Lik. −161.289 RMSE 2.69 Basis See the correction to p. 4.
Replication archive
Replication archive, Data/exp_2/data.rds and Data/exp_3/data.rds (fact_dose, fact_stereo_dose)
Correction
The text (pp. 6–8) says the poll percentage was generated by adding a random −20 to 20 points to the participant’s prior. In the archived data for Experiments 2 and 3, the recorded dose never takes the values −8 or −9, and dose 0 occurs 594 times in Experiment 2 and 176 times in Experiment 3, against medians of 199 and 62 for the other values. Among priors between 23 and 77, perceptions at recorded dose 0 changed by −2.1 (Experiment 2) and −2.8 (Experiment 3) points on average, where the other doses predict 0.2 and 0.3. Rows drawn at −8 or −9 appear to be recorded as 0. No cleaning code is archived, so the source cannot be traced. Dropping every row recorded at dose 0 leaves the results unchanged: the manipulation-check slopes are 0.39 and 0.54, and 1 of the 48 out-party effects in Fig. 4 is significant.