

Executive Summary
This report presents findings from 14 questions on AI and politics fielded as part of a survey of 1,000 U.S. adults conducted by YouGov on behalf of the Polarization Research Lab. All results are weighted to be nationally representative.
AI adoption for news and politics remains limited but non-trivial. Nearly half of Americans (46%) report using AI to get news at least occasionally, though most of these are infrequent users. When it comes to using AI specifically to understand politics, 39% say they do so at least rarely — with Republicans (42%) slightly more likely than Democrats (39%) or Independents (35%).
Among those who use AI for politics, fact-checking is the top use case. A majority (51%) of AI-for-politics users say they use it to fact-check claims from news or social media, followed by explaining policies (43%) and understanding issue backgrounds (42%).
Very few Americans have turned to AI for recent major news events. Only 7% used an AI tool to understand U.S. military action in Iran, and 8% used one for the Epstein documents release — suggesting AI is not yet a primary news source even for high-profile stories.
Concern about AI in elections is widespread and bipartisan. Majorities are very or extremely concerned about AI providing inaccurate information about candidates (57%), AI-generated misinformation (56%), AI being politically biased (54%), AI discouraging voting or spreading wrong voting information (48%), and AI replacing journalism (47%).
Most Americans do not plan to use AI for the next election. Over half (54%) say they will definitely not use AI for election information, and another 21% say probably not. Just 10% say they probably or definitely will. Democrats (12%) and Republicans (11%) are somewhat more open than Independents (5%).
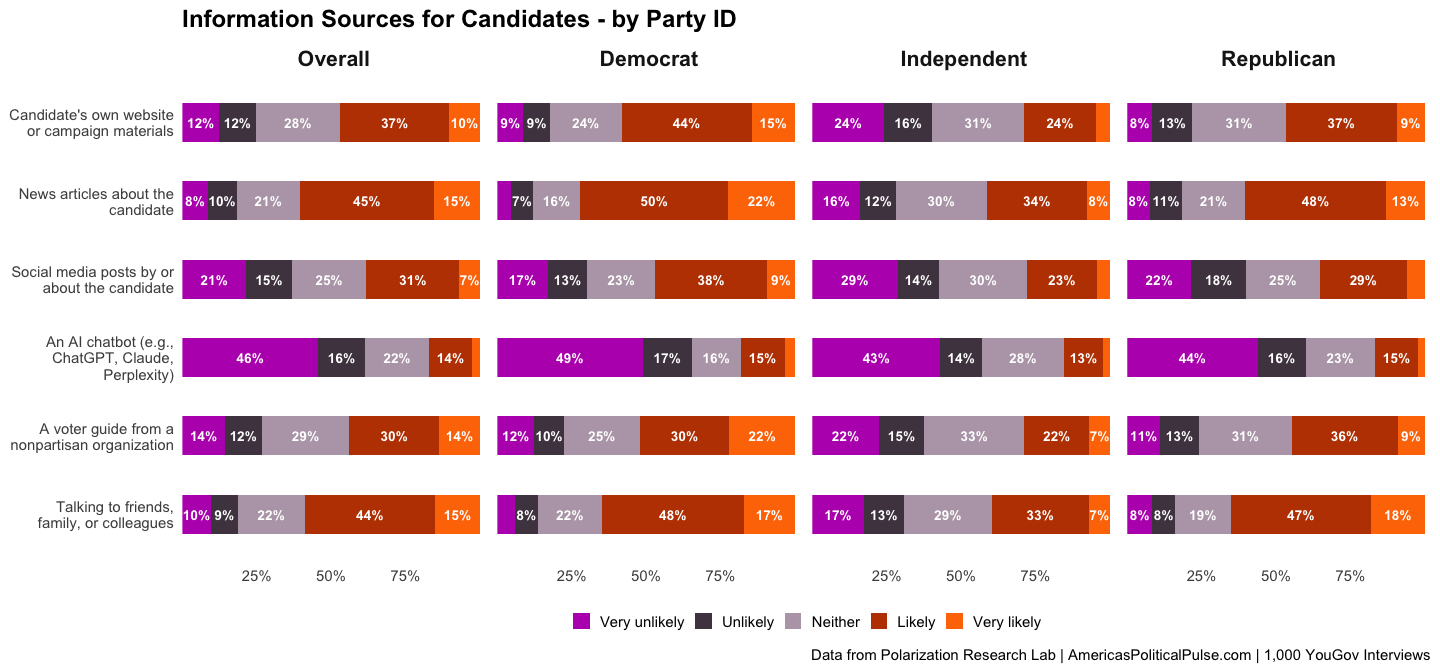
Traditional sources still dominate candidate research. When learning about candidates, the most popular sources are news articles (% likely/very likely: 62%), candidates’ own websites (48%), and talking to friends and family (59%). Only 17% say they are likely to use an AI chatbot — ranking last among the six sources tested.
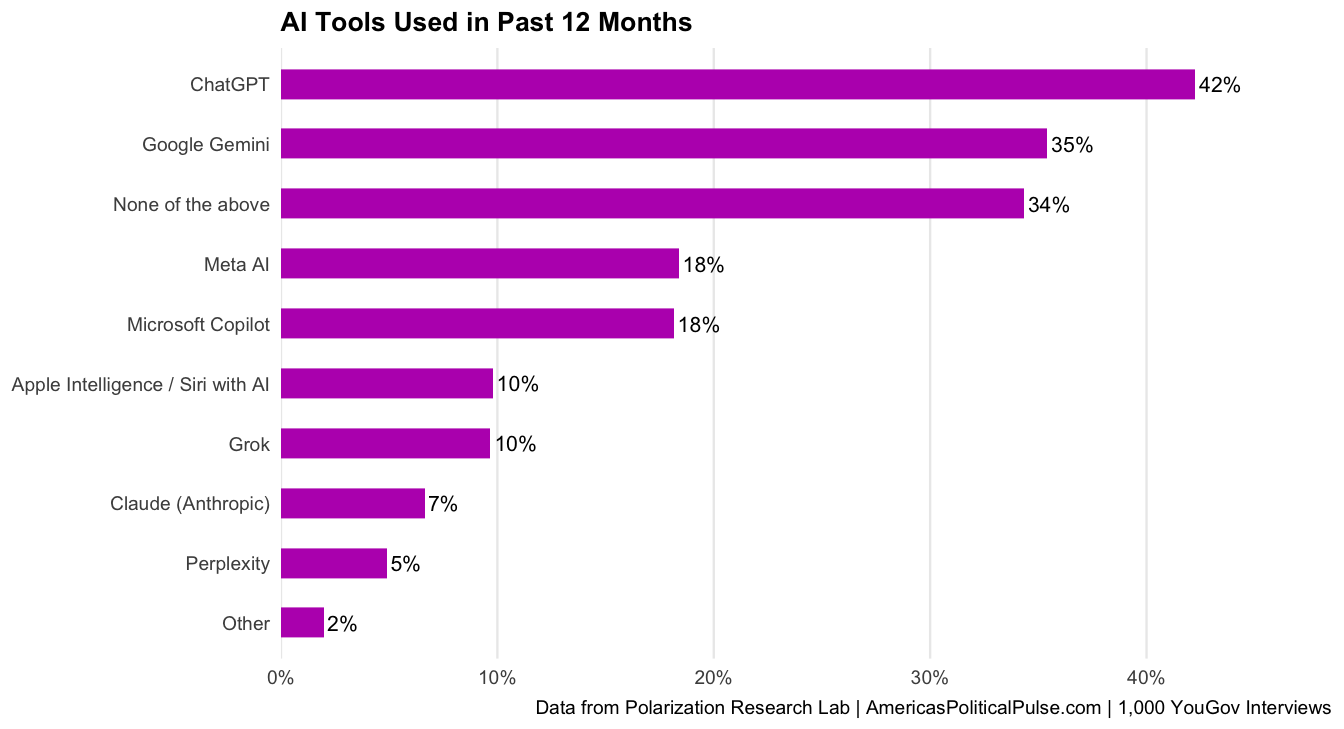
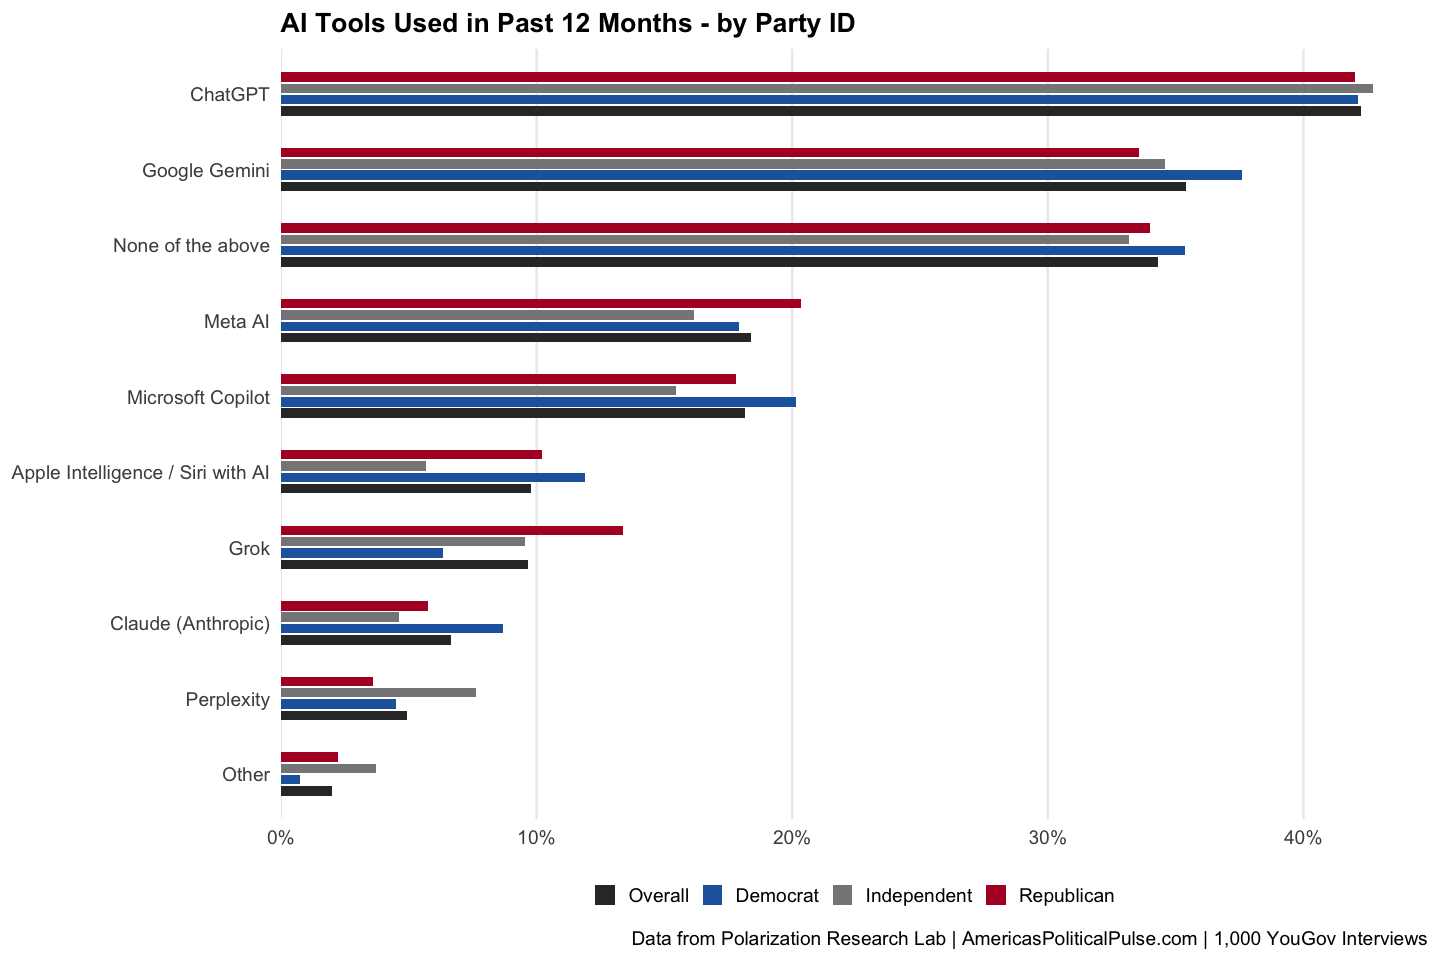
ChatGPT is the most widely used AI tool, but a third have used none. Among all adults, 42% have used ChatGPT in the past year, followed by Google Gemini (35%), Meta AI (18%), and Microsoft Copilot (18%). A third (34%) have not used any AI tool.
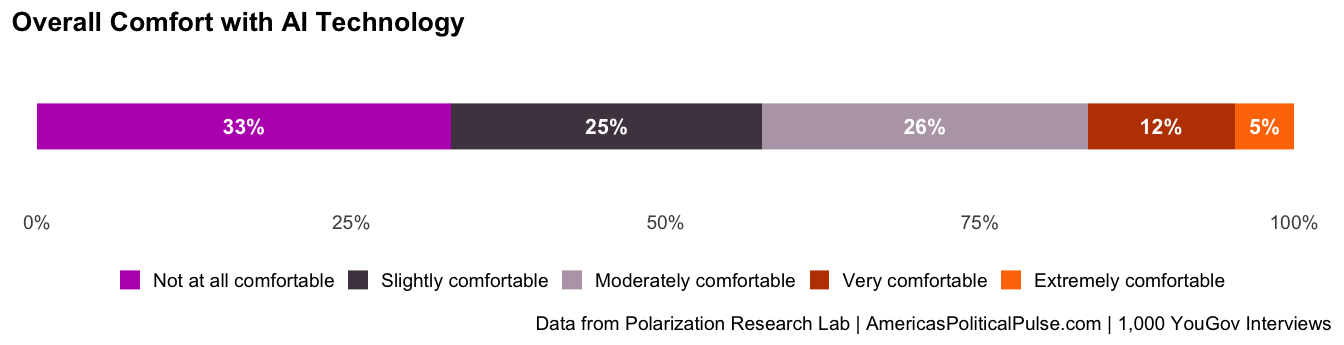
Comfort with AI technology is low overall. Only 17% of Americans rate themselves as very or extremely comfortable with AI, while a third (33%) say they are not at all comfortable. Comfort varies sharply by demographic — men, higher-income, and more educated respondents report greater comfort.
AI1: AI News Usage Frequency
“In a typical week, how often do you use an AI to get news?”
Base: All respondents (n = 1,000)
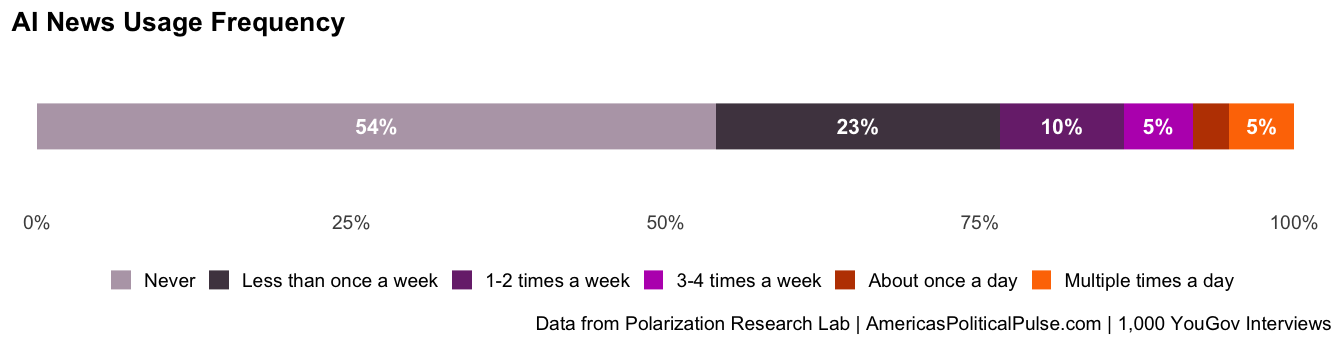
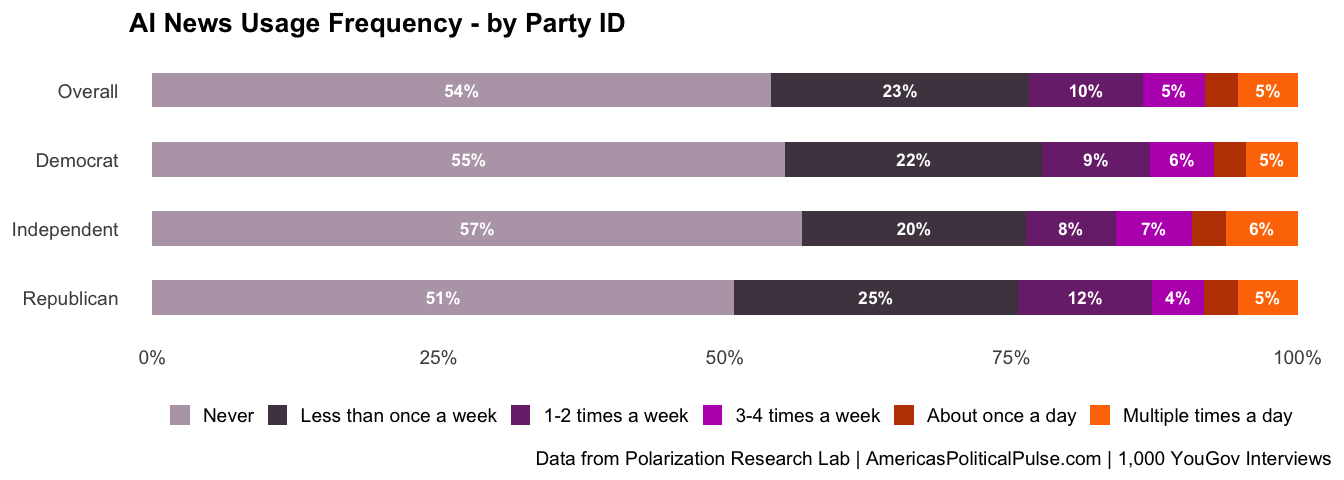
A majority of Americans (54%) say they never use AI to get news. Among those who do, most are infrequent users — just 14% report using AI for news three or more times a week. Partisan differences are modest, though Republicans are slightly more likely than Democrats to report daily AI news use.
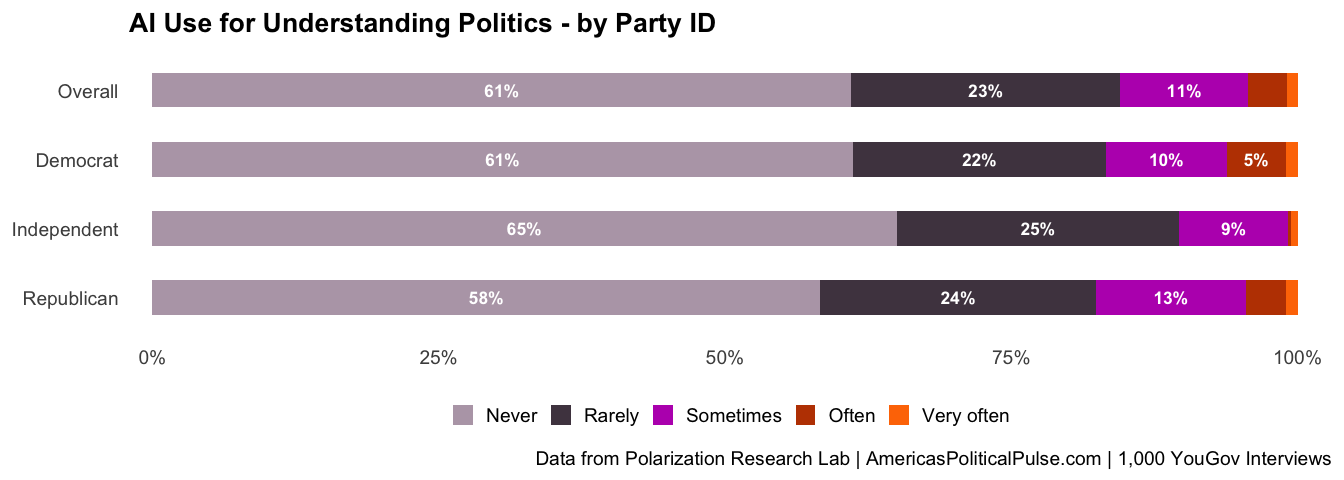
AI3: AI for Understanding Politics
“How often do you use AI tools to help you understand politics?”
Base: All respondents (n = 1,000)
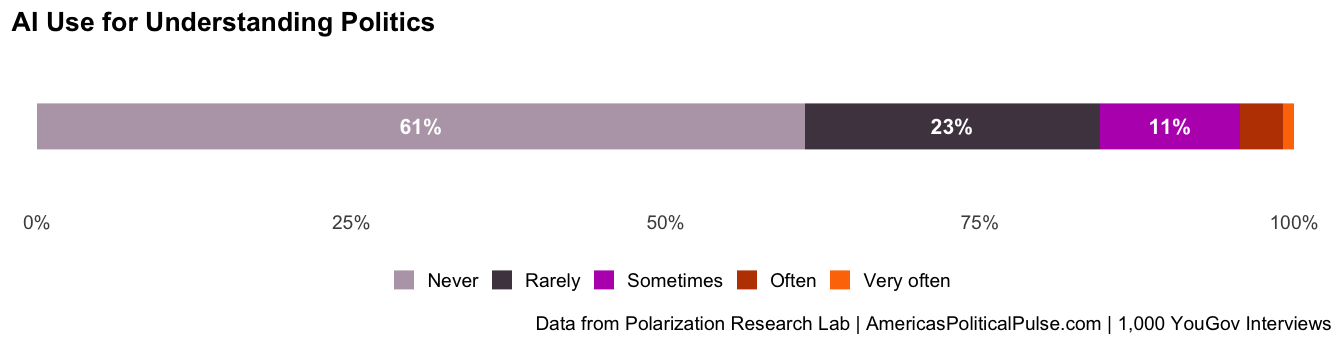
About four in ten Americans (39%) report using AI tools to understand politics at least rarely, though frequent use remains uncommon. Republicans (42%) are slightly more likely than Democrats (39%) or Independents (35%) to report any use. The majority (61%) say they never use AI for this purpose.
AI4: What Do You Ask AI About Politics?
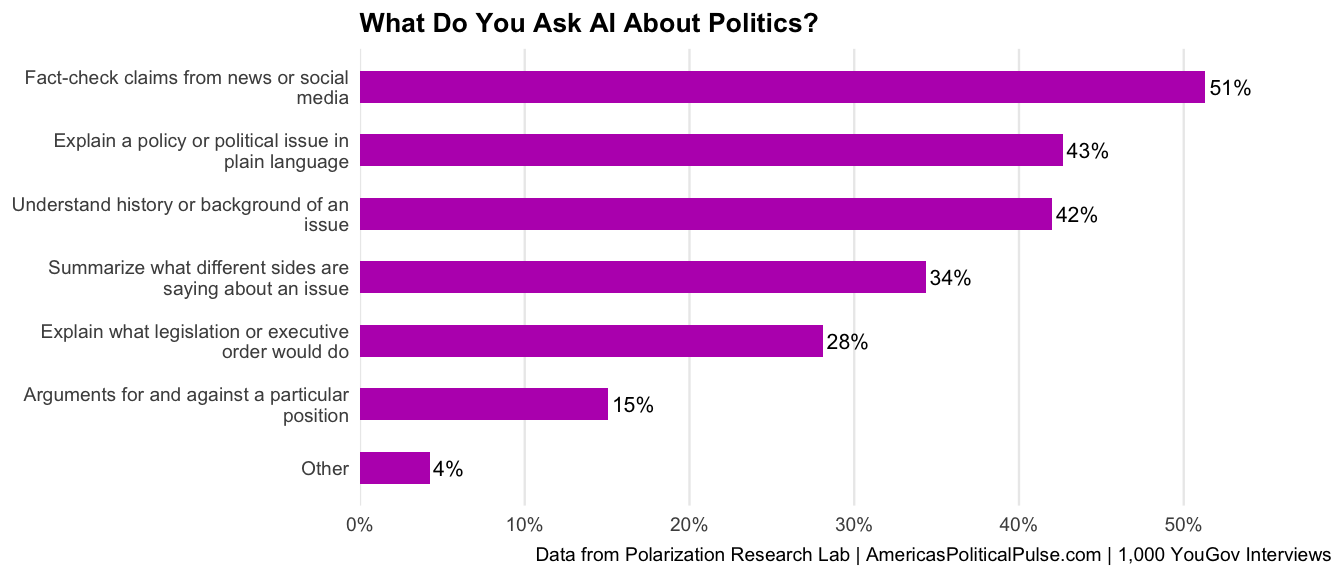
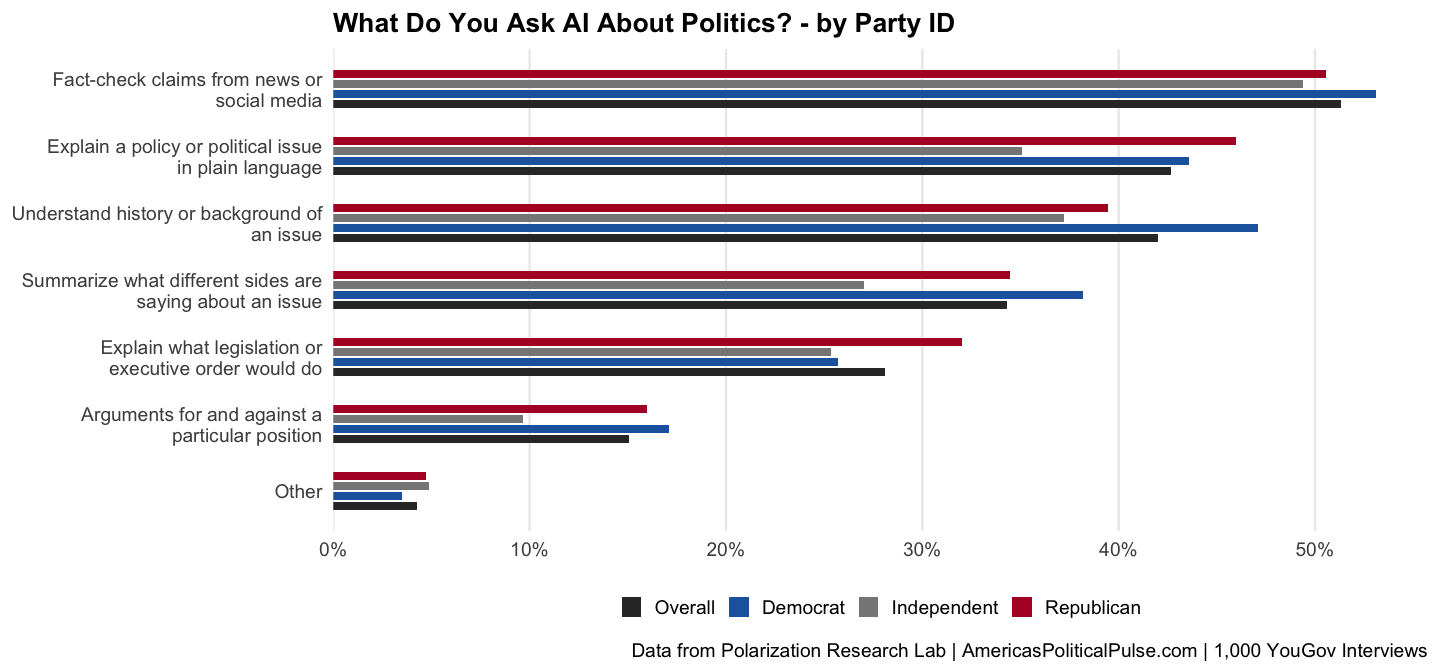
“When you use AI to learn about politics, what do you typically ask it to do?”
Base: Respondents who use AI for politics (AI3 ≠ “Never”; n ≈ 371)
Among those who use AI for politics, fact-checking claims from news or social media is the most common use case (51%), followed by explaining a policy or political issue in plain language (43%) and understanding the history or background of an issue (42%). These results suggest users primarily turn to AI for informational and verification tasks rather than opinion formation.
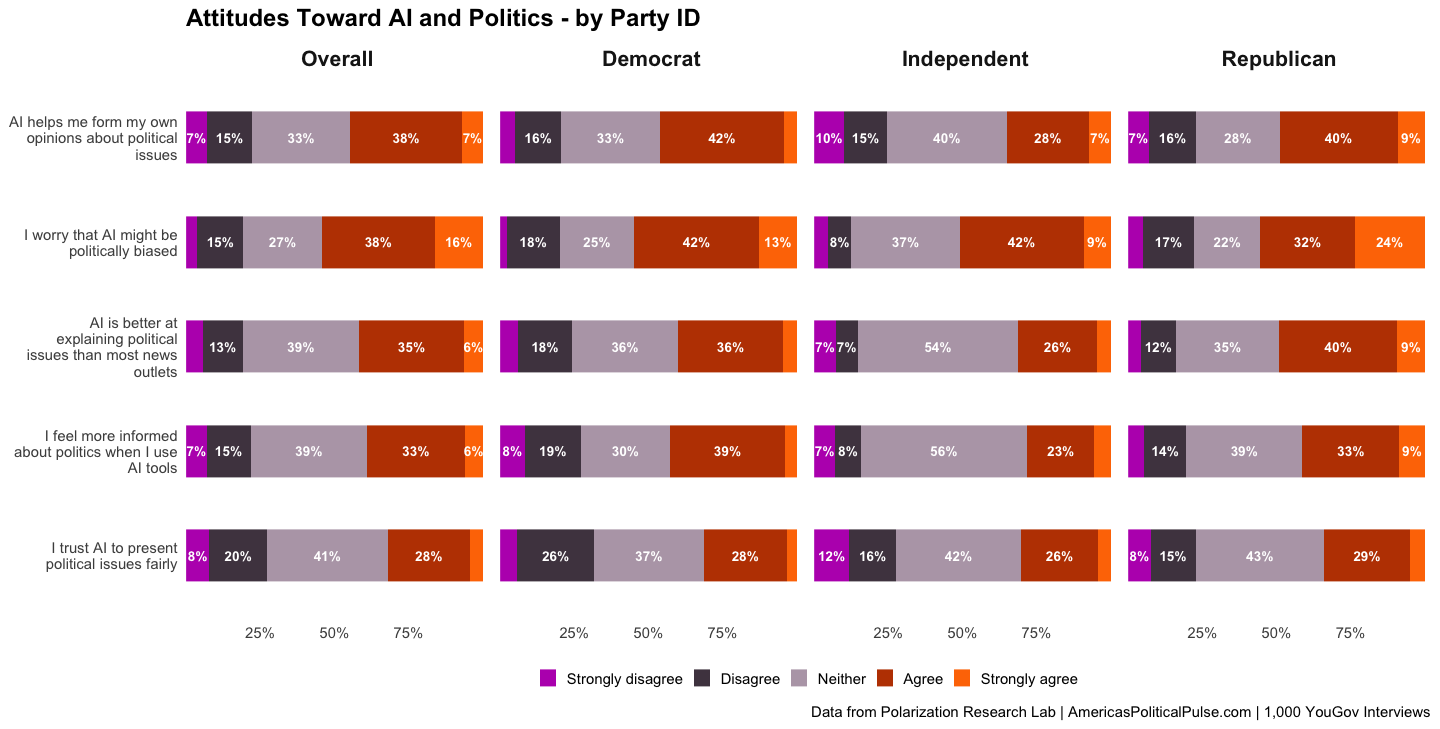
AI5: Attitudes Toward AI and Politics
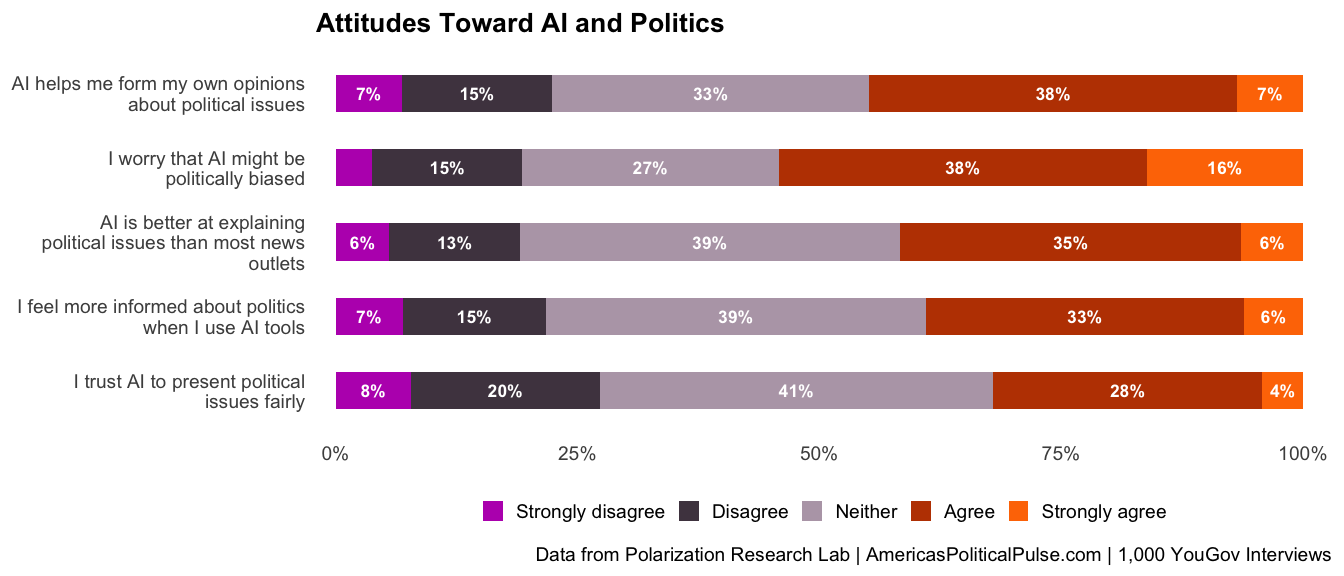
“To what extent do you agree or disagree with the following?”
Base: Respondents who use AI for politics (AI3 ≠ “Never”; n ≈ 371)
AI-for-politics users hold mixed attitudes. Many report feeling more informed when using AI tools, but concern about political bias is also widespread among this group. Trust in AI to present political issues fairly remains low, even among those who actively use these tools. Partisan gaps are evident: Republicans express greater concern about bias, while Democrats are somewhat more likely to see AI as a useful informational supplement.
AI6: AI Use for U.S. Military Action in Iran
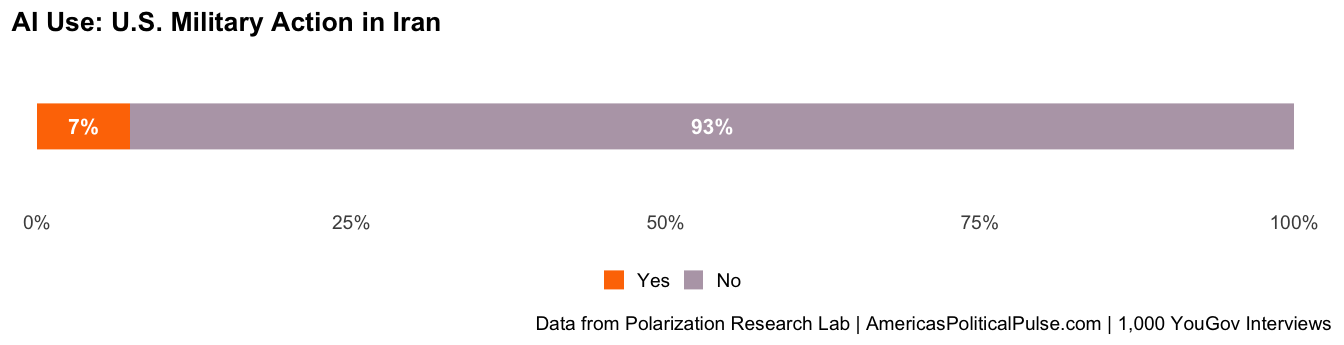
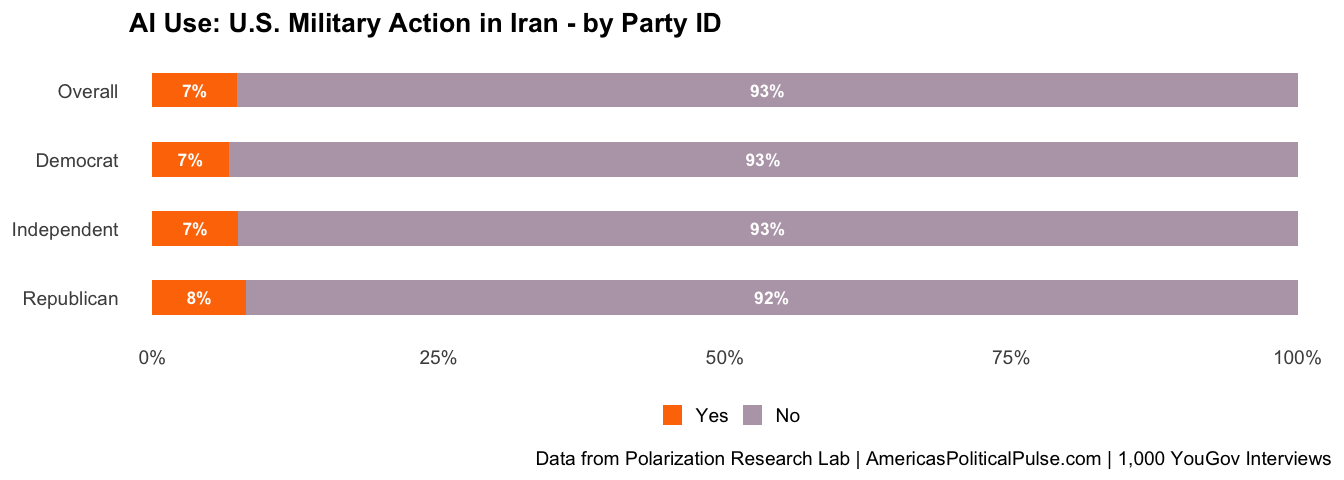
“Have you used an AI tool to help you understand U.S. military action in Iran?”
Base: All respondents (n = 1,000)
Only 7% of Americans report using an AI tool to help them understand U.S. military action in Iran, indicating that AI has not yet become a go-to source for breaking news or major geopolitical events. Usage is low across all partisan groups.
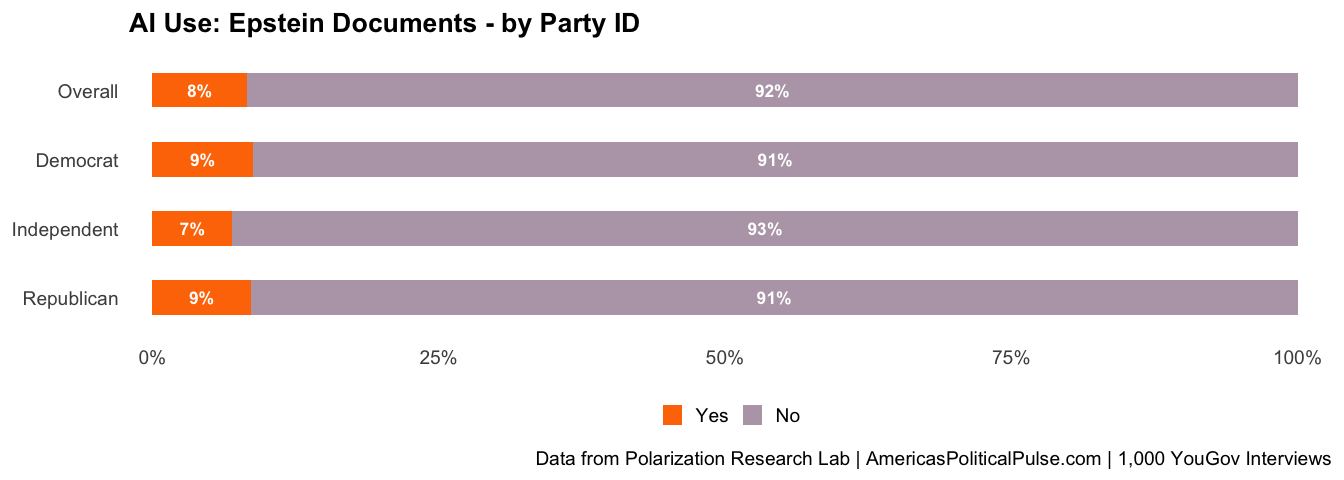
AI7: AI Use for Epstein Documents
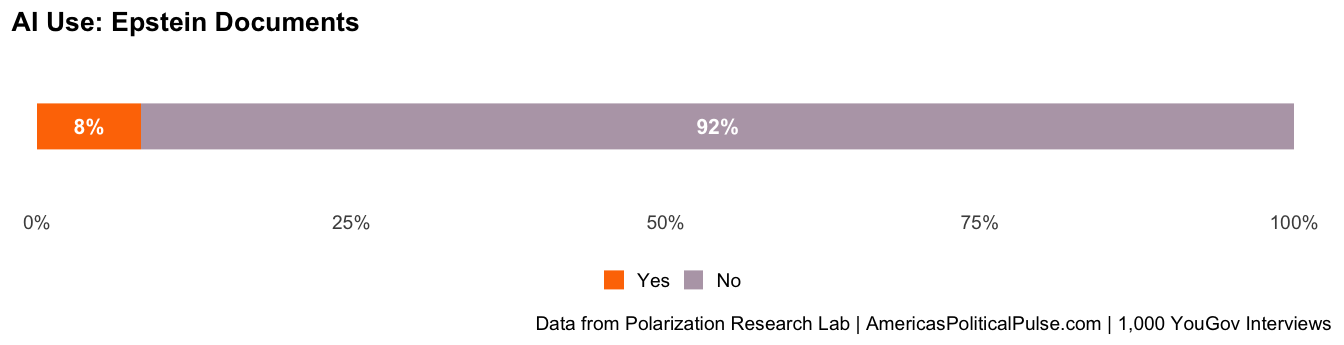
“Have you used an AI tool to help you understand the release of documents related to Jeffrey Epstein?”
Base: All respondents (n = 1,000)
Similarly, just 8% of respondents used an AI tool to learn about the release of documents related to Jeffrey Epstein. Together with the Iran question, these results suggest that even for high-profile, widely covered news stories, the vast majority of Americans are not yet turning to AI as a primary information source.
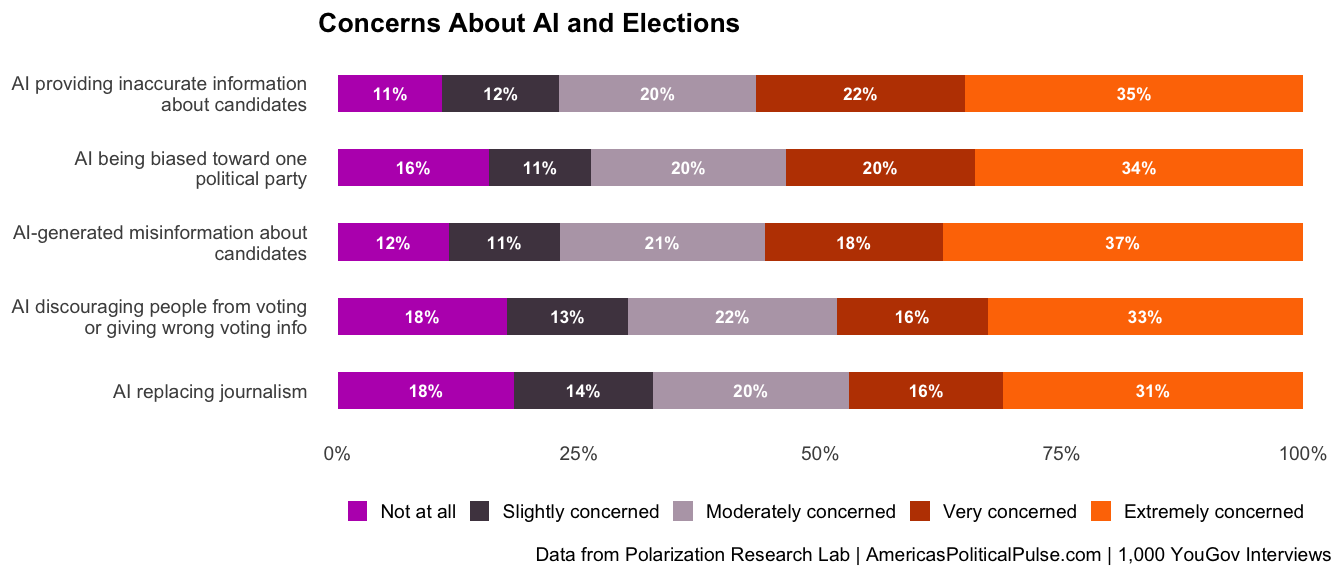
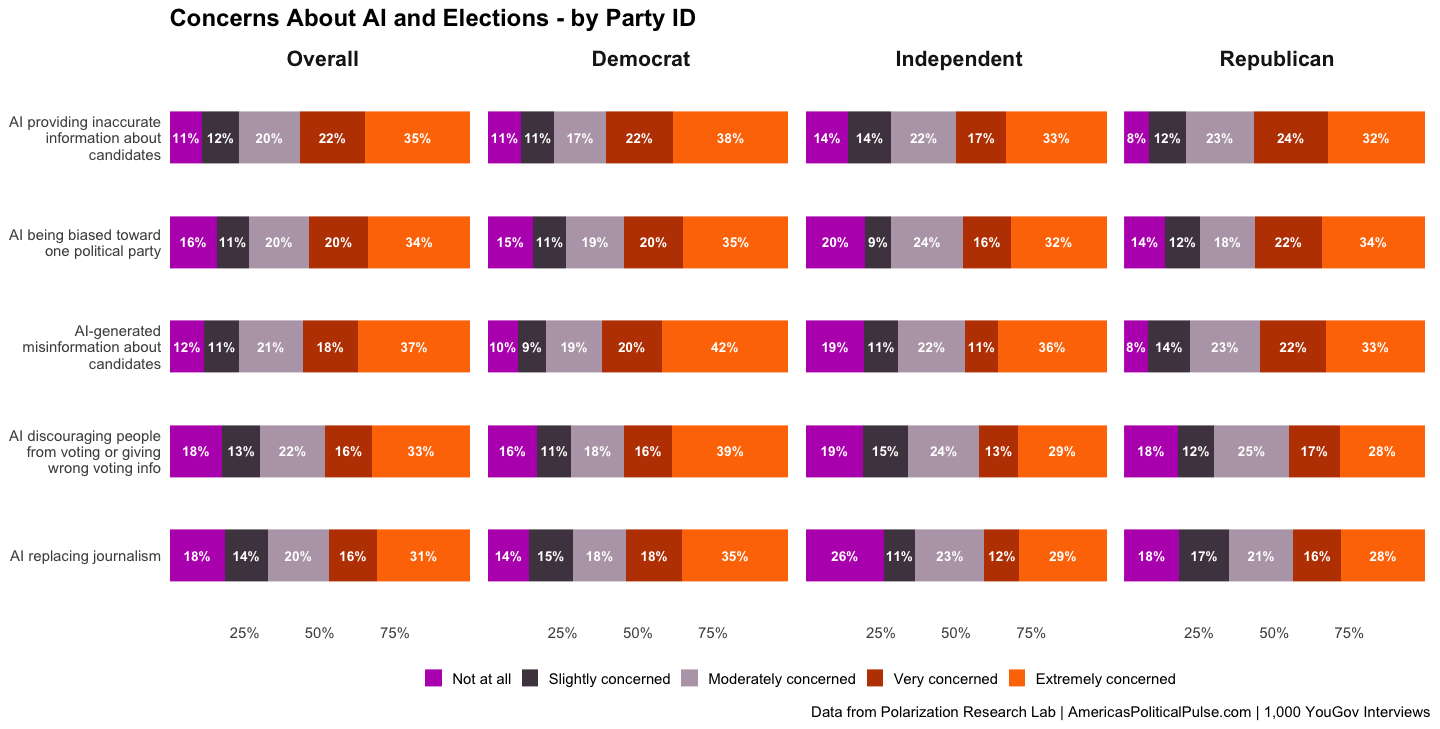
AI8: Concerns About AI and Elections
“How concerned are you about each of the following when it comes to AI and elections?”
Base: All respondents (n = 1,000)
Concern about AI’s role in elections is widespread and largely bipartisan. Majorities are very or extremely concerned about AI providing inaccurate information about candidates (57%), AI-generated misinformation (56%), and AI being biased toward one political party (54%). Nearly half express high concern about AI discouraging people from voting or giving wrong voting information (48%) and about AI replacing journalism (47%).
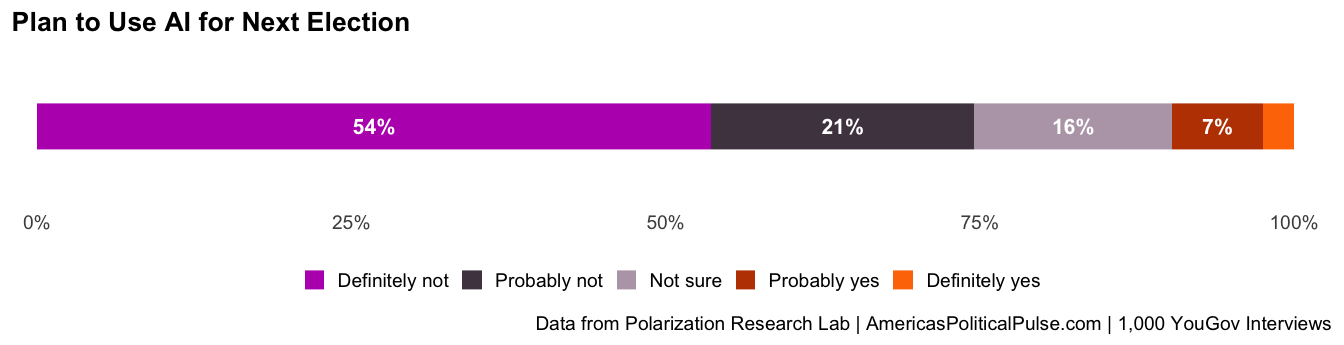
AI9: Plan to Use AI for Next Election
“Do you plan to use an AI tool to help you with election-related information in the next election?”
Base: All respondents (n = 1,000)
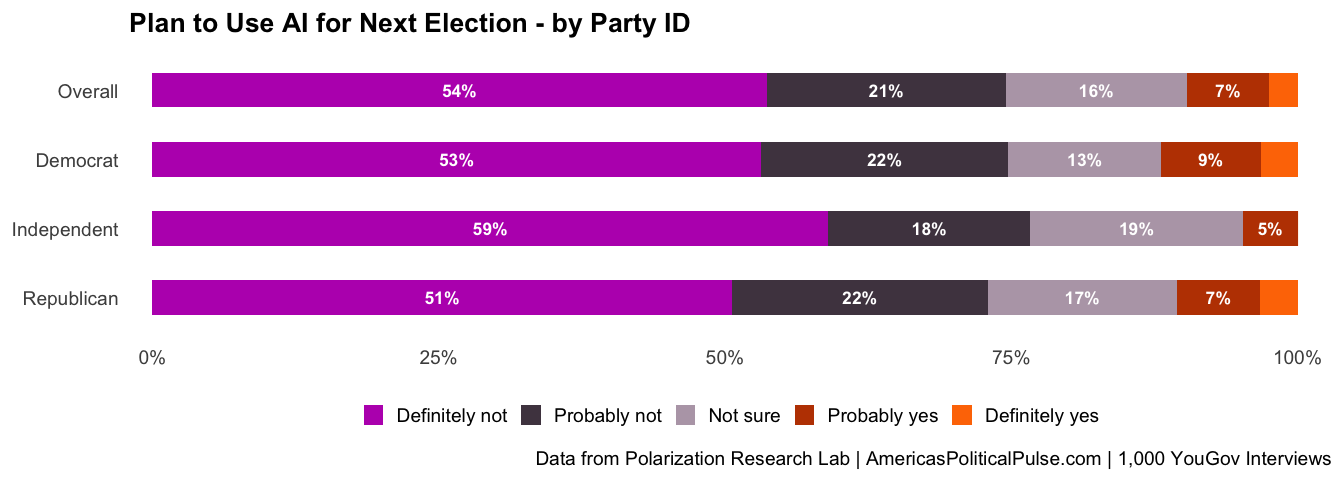
Most Americans do not plan to use AI for election-related information. Over half (54%) say they will definitely not use AI tools for the next election, and another 21% say probably not. Just 10% say they probably or definitely will. Democrats (12%) and Republicans (11%) are somewhat more open to the idea than Independents (5%).
AI10: Likely AI Uses for Next Election
“Thinking about the next election, how likely are you to use AI tools for each of the following purposes?”
Base: Respondents open to using AI for elections (AI9 ≠ “Definitely not”; n ≈ 445)
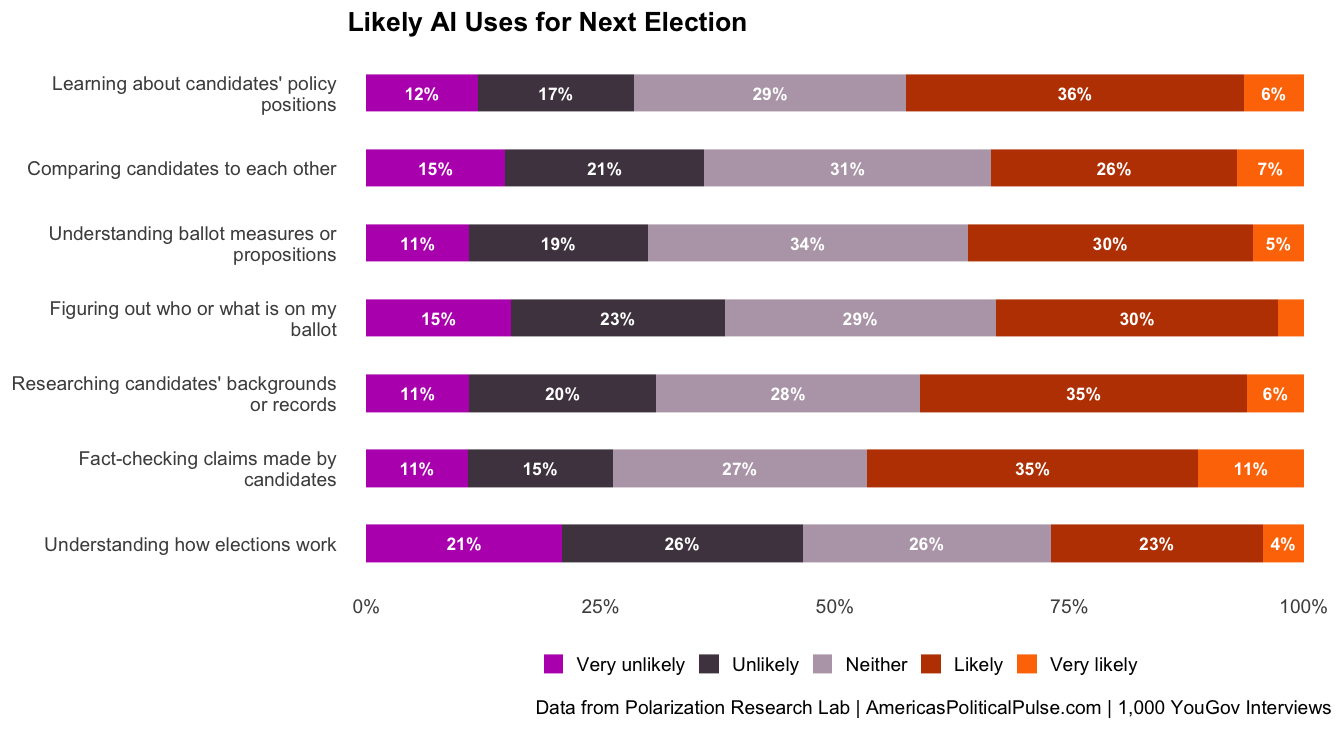
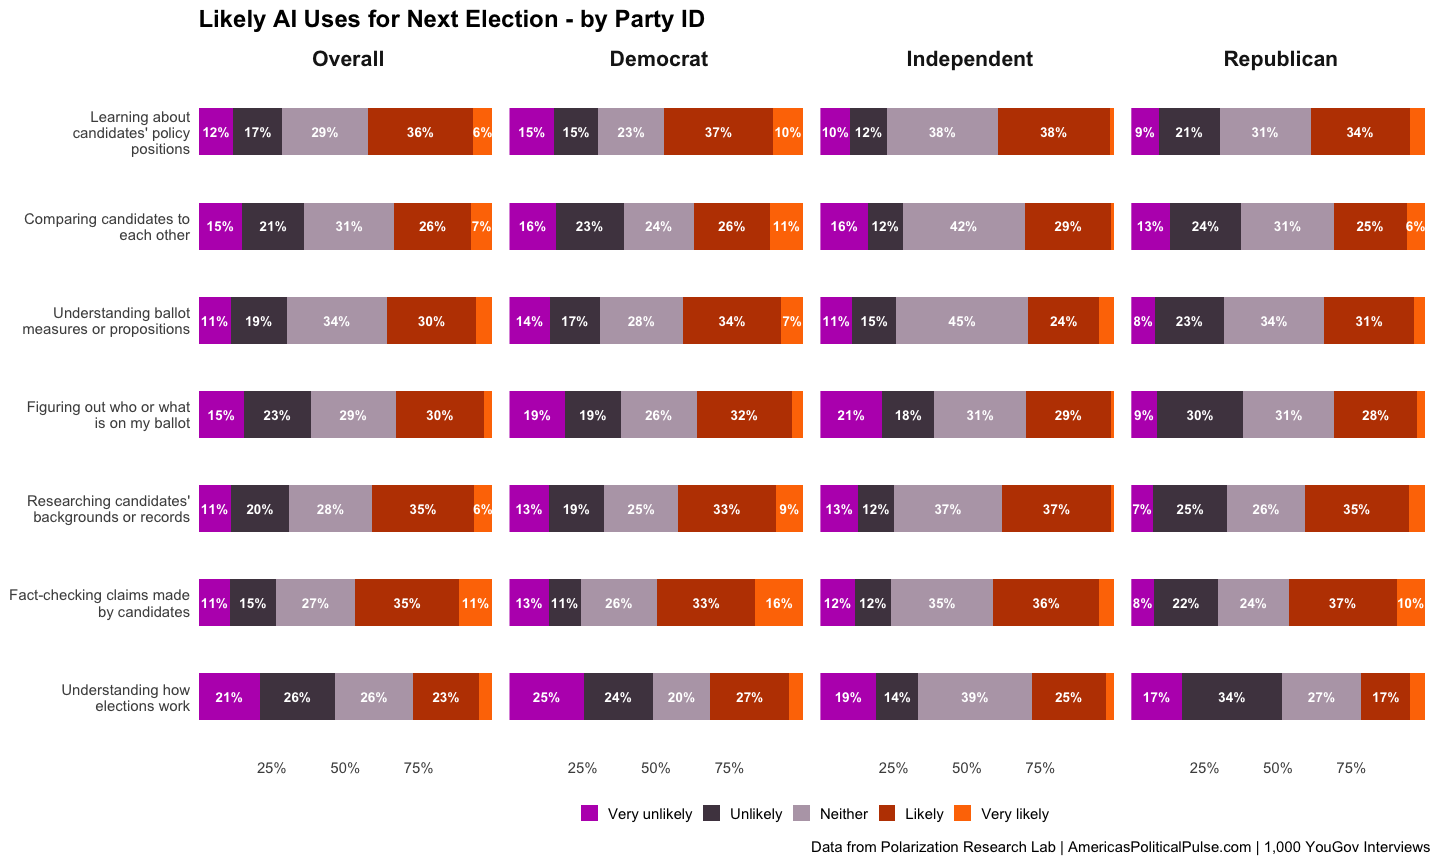
Among respondents who have not ruled out using AI for the next election, the most appealing uses are fact-checking claims made by candidates and learning about candidates’ policy positions. Understanding ballot measures and comparing candidates also rank relatively high. These patterns mirror the fact-checking and informational priorities seen in AI4, suggesting that voters view AI primarily as a verification and research tool rather than a persuasion aid.
AI11: Information Sources for Candidates
“Thinking about the next election, when you want to learn about a candidate running for office, how likely are you to use each of the following?”
Base: All respondents (n = 1,000)
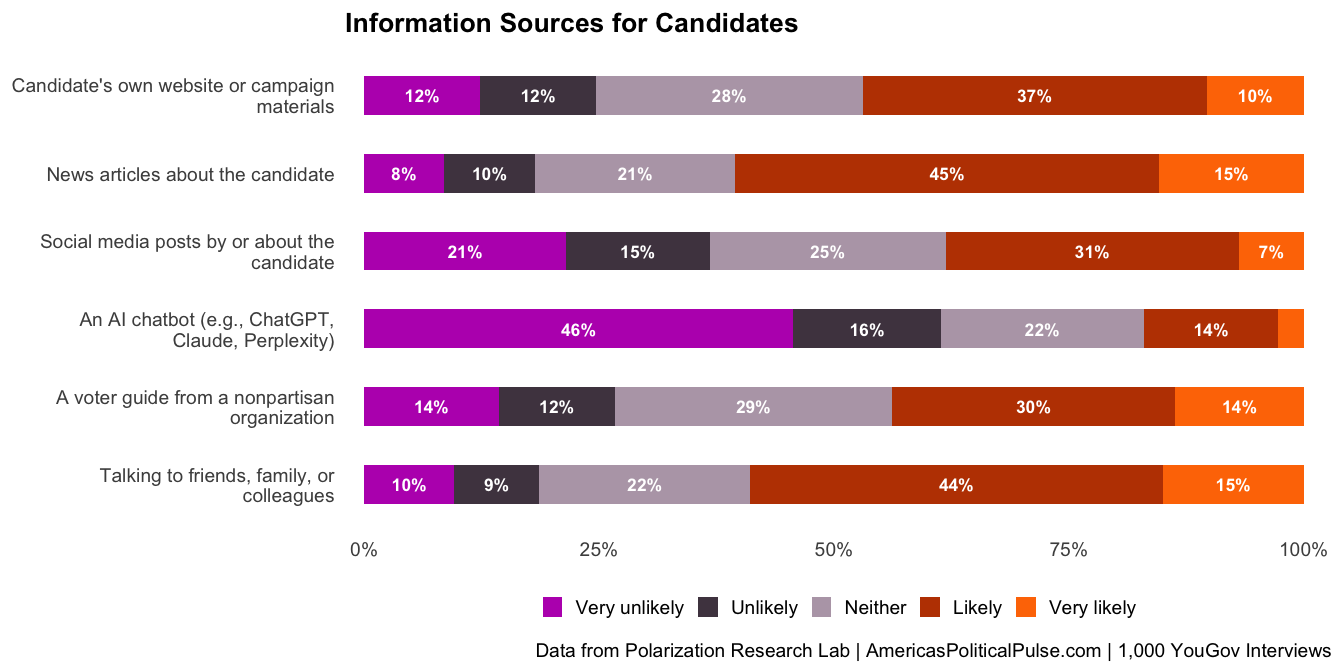
Traditional information sources continue to dominate how Americans learn about candidates. News articles rank highest (62% likely or very likely to use), followed by talking to friends, family, or colleagues (59%) and candidates’ own websites (48%). AI chatbots rank last among the six sources tested, with only 17% saying they are likely to use one — well behind even social media (38%) and nonpartisan voter guides (44%).
AI12: Desired AI Outputs About Candidates
“If you were to ask an AI chatbot about a candidate in the next election, which of the following (if any) would you want it to provide?”
Base: All respondents (n = 1,000)
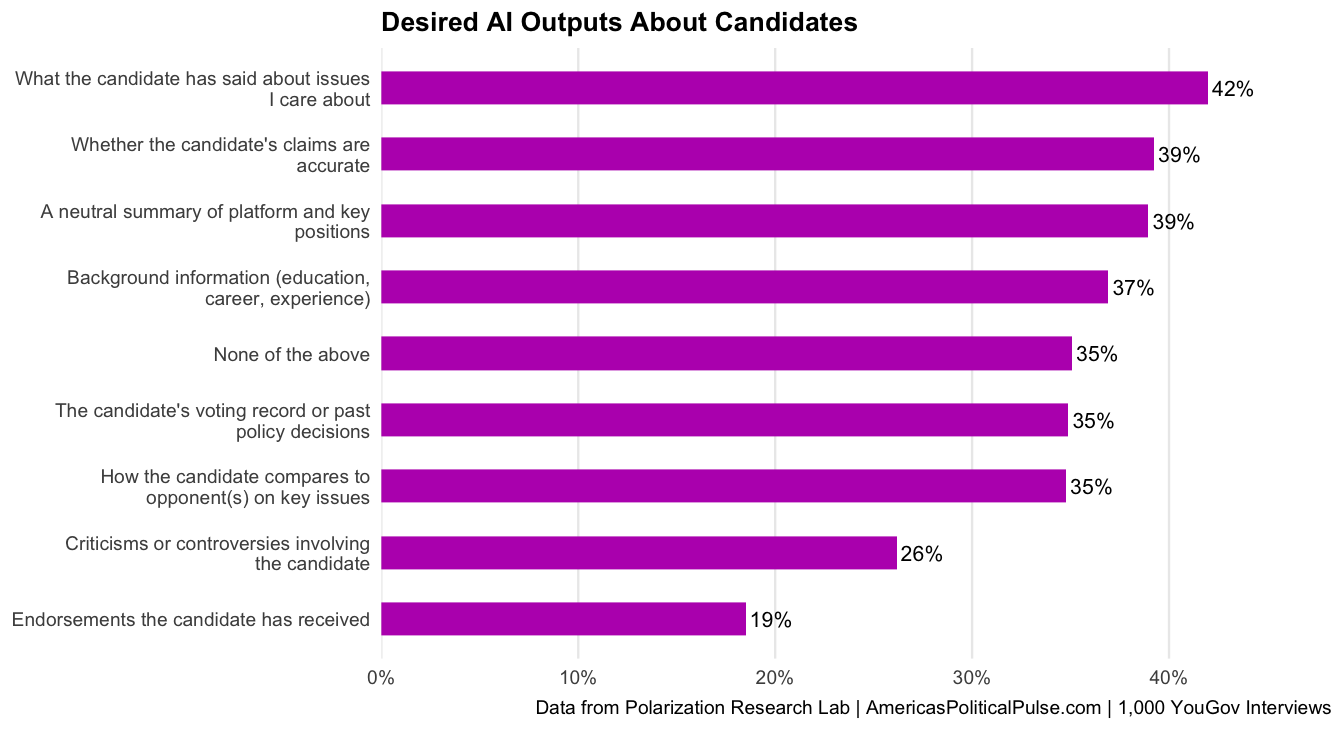
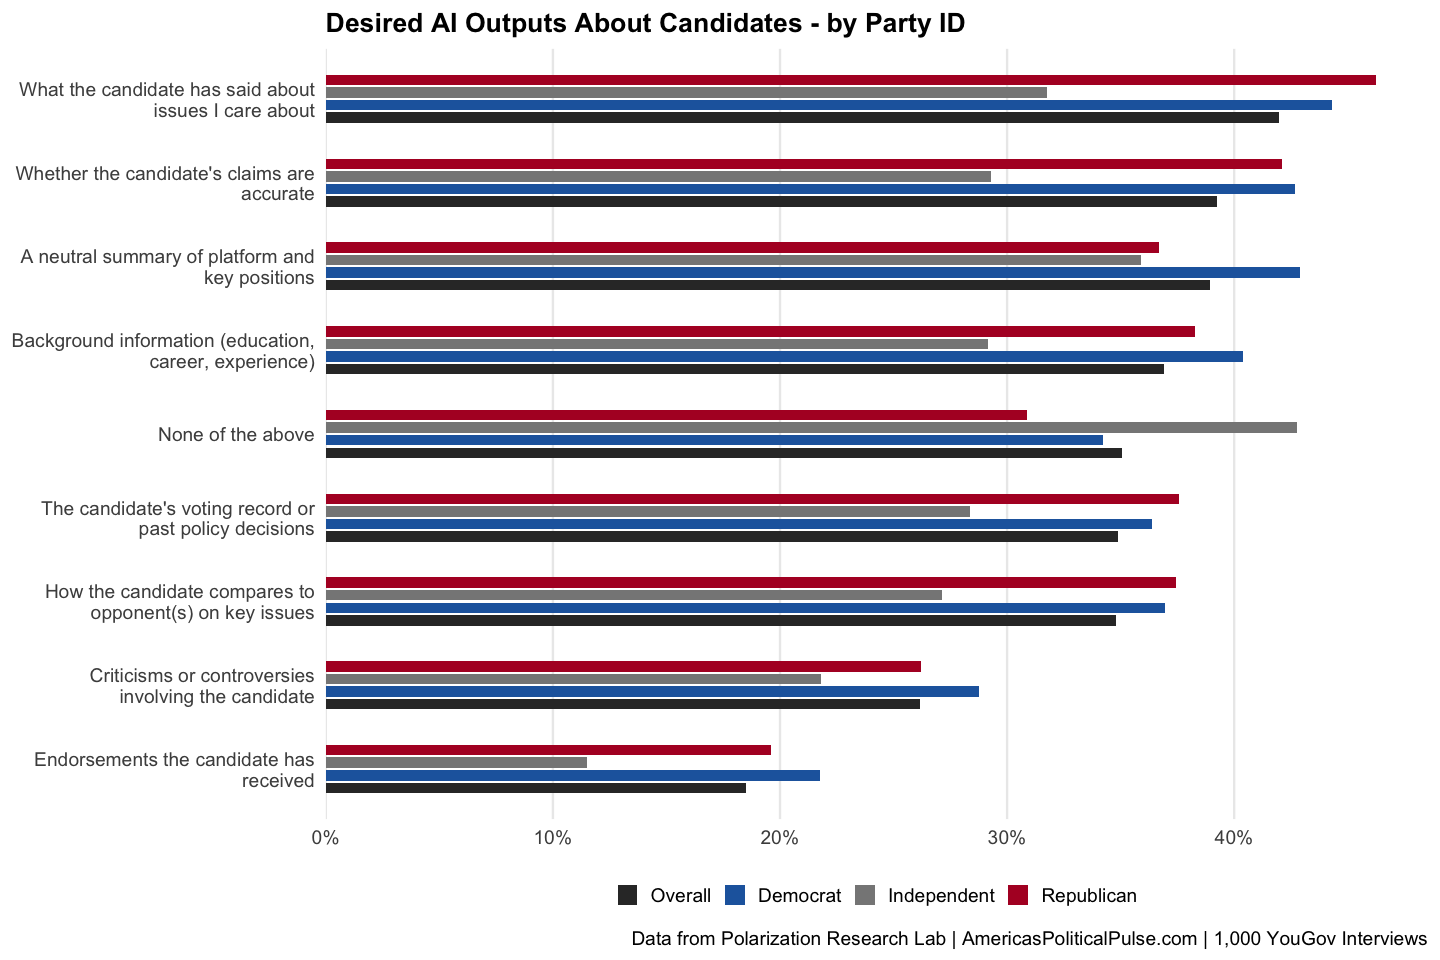
When asked what they would want an AI chatbot to provide about a candidate, respondents most often select substantive, policy-oriented information: a neutral summary of the candidate’s platform and key positions, what the candidate has said about issues they care about, and how the candidate compares to opponents on key issues. Accuracy-checking and background information are also highly valued. These preferences suggest that if Americans do turn to AI for election information, they want balanced, fact-based output rather than editorialized content.
AI13: AI Tools Used in Past 12 Months
“Which AI tools, if any, have you used in the past 12 months?”
Base: All respondents (n = 1,000)
ChatGPT is by far the most widely used AI tool, with 42% of adults reporting use in the past 12 months. Google Gemini follows at 35%, with Microsoft Copilot and Meta AI each at 18%. A third of Americans (34%) have not used any AI tool in the past year. Usage patterns show demographic variation: younger, higher-income, and more educated respondents report higher usage rates across most tools.
AI14: Overall Comfort with AI Technology
“How would you rate your overall comfort level with AI technology?”
Base: All respondents (n = 1,000)
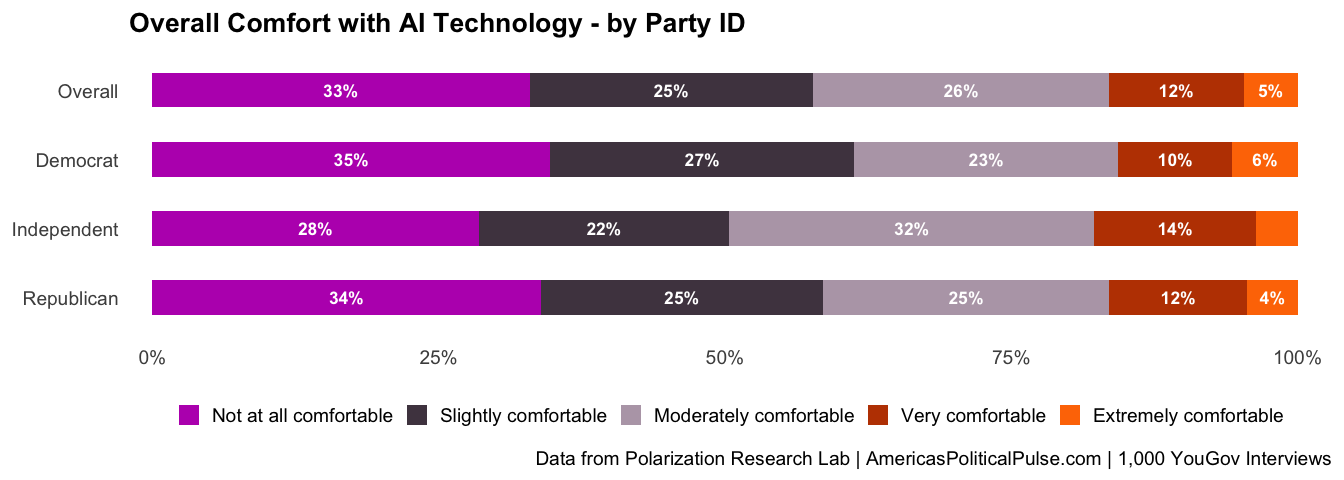
Overall comfort with AI technology remains low. A third of Americans (33%) say they are not at all comfortable with AI, and only 17% rate themselves as very or extremely comfortable. Comfort varies sharply by demographic: men, higher-income, and more educated respondents report substantially greater comfort. This measure serves as a key moderator throughout the survey — respondents who are more comfortable with AI are consistently more likely to use it for news, politics, and election information.
Appendix: Demographic Tables
| Group | Never | Less than once a week | 1-2 times a week | 3-4 times a week | About once a day | Multiple times a day |
|---|---|---|---|---|---|---|
| Overall | 54% | 23% | 10% | 5% | 3% | 5% |
| Gender | ||||||
| Male | 55% | 20% | 11% | 5% | 3% | 7% |
| Female | 53% | 25% | 9% | 6% | 2% | 4% |
| Education | ||||||
| No HS | 52% | 29% | 9% | 8% | 2% | - |
| HS | 62% | 19% | 6% | 3% | 2% | 7% |
| Some Col | 59% | 21% | 8% | 6% | 2% | 5% |
| 2-yr | 50% | 31% | 10% | 5% | 0% | 5% |
| 4-yr | 44% | 21% | 16% | 8% | 5% | 6% |
| Post-grad | 47% | 27% | 12% | 5% | 6% | 4% |
| Income | ||||||
| <$30K | 53% | 24% | 8% | 4% | 3% | 6% |
| $30-50K | 56% | 24% | 10% | 4% | 2% | 4% |
| $50-80K | 57% | 19% | 10% | 7% | 4% | 4% |
| $80-120K | 54% | 22% | 12% | 5% | 1% | 6% |
| $120K+ | 44% | 26% | 11% | 8% | 4% | 7% |
| Party ID | ||||||
| Dem | 55% | 22% | 9% | 6% | 3% | 5% |
| Ind | 57% | 20% | 8% | 7% | 3% | 6% |
| Rep | 51% | 25% | 12% | 4% | 3% | 5% |
| AI Comfort | ||||||
| Not Comf | 85% | 13% | 1% | - | 0% | 1% |
| Slight | 52% | 31% | 8% | 5% | 3% | 1% |
| Moderate | 39% | 28% | 18% | 9% | 3% | 3% |
| Very | 21% | 22% | 20% | 12% | 7% | 18% |
| Extremely | 14% | 15% | 16% | 9% | 9% | 37% |
| Group | Never | Rarely | Sometimes | Often | Very often |
|---|---|---|---|---|---|
| Overall | 61% | 23% | 11% | 3% | 1% |
| Gender | |||||
| Male | 61% | 22% | 12% | 4% | 1% |
| Female | 61% | 24% | 10% | 3% | 1% |
| Education | |||||
| No HS | 65% | 19% | 14% | 2% | - |
| HS | 70% | 17% | 9% | 3% | 1% |
| Some Col | 61% | 28% | 9% | 3% | 0% |
| 2-yr | 61% | 29% | 9% | 1% | 0% |
| 4-yr | 51% | 25% | 17% | 6% | 1% |
| Post-grad | 55% | 28% | 12% | 3% | 2% |
| Income | |||||
| <$30K | 62% | 23% | 9% | 5% | 1% |
| $30-50K | 67% | 19% | 13% | 1% | 0% |
| $50-80K | 60% | 21% | 13% | 4% | 1% |
| $80-120K | 55% | 24% | 17% | 4% | - |
| $120K+ | 51% | 33% | 10% | 3% | 3% |
| Party ID | |||||
| Dem | 61% | 22% | 10% | 5% | 1% |
| Ind | 65% | 25% | 9% | 0% | 1% |
| Rep | 58% | 24% | 13% | 4% | 1% |
| AI Comfort | |||||
| Not Comf | 91% | 8% | 1% | - | - |
| Slight | 57% | 30% | 9% | 3% | - |
| Moderate | 49% | 31% | 18% | 1% | 1% |
| Very | 25% | 36% | 25% | 12% | 1% |
| Extremely | 29% | 23% | 20% | 17% | 10% |
| Group | Explain a policy or political issue in plain language | Summarize what different sides are saying about an issue | Fact-check claims from news or social media | Understand history or background of an issue | Arguments for and against a particular position | Explain what legislation or executive order would do | Other |
|---|---|---|---|---|---|---|---|
| Overall | 43% | 34% | 51% | 42% | 15% | 28% | 4% |
| Gender | |||||||
| Male | 39% | 31% | 55% | 44% | 17% | 26% | 4% |
| Female | 46% | 37% | 48% | 41% | 14% | 30% | 4% |
| Education | |||||||
| No HS | 31% | 12% | 51% | 33% | 3% | 5% | 12% |
| HS | 46% | 29% | 47% | 41% | 13% | 23% | 7% |
| Some Col | 46% | 33% | 55% | 32% | 24% | 30% | 3% |
| 2-yr | 32% | 40% | 44% | 37% | 11% | 17% | 6% |
| 4-yr | 43% | 36% | 53% | 54% | 17% | 34% | 3% |
| Post-grad | 44% | 46% | 55% | 43% | 10% | 40% | 1% |
| Income | |||||||
| <$30K | 45% | 26% | 41% | 39% | 21% | 23% | 9% |
| $30-50K | 35% | 35% | 52% | 52% | 15% | 24% | 1% |
| $50-80K | 37% | 32% | 51% | 35% | 15% | 29% | 4% |
| $80-120K | 50% | 53% | 62% | 48% | 12% | 36% | 5% |
| $120K+ | 46% | 33% | 52% | 46% | 14% | 33% | 0% |
| Party ID | |||||||
| Dem | 44% | 38% | 53% | 47% | 17% | 26% | 3% |
| Ind | 35% | 27% | 49% | 37% | 10% | 25% | 5% |
| Rep | 46% | 34% | 51% | 39% | 16% | 32% | 5% |
| AI Comfort | |||||||
| Not Comf | 32% | 12% | 55% | 22% | 8% | 13% | 18% |
| Slight | 39% | 31% | 50% | 37% | 17% | 24% | 4% |
| Moderate | 39% | 34% | 44% | 43% | 9% | 24% | 3% |
| Very | 52% | 41% | 62% | 46% | 20% | 38% | 4% |
| Extremely | 57% | 50% | 54% | 61% | 26% | 45% | 0% |
| Group | AI helps me form my own opinions about political issues | I worry that AI might be politically biased | AI is better at explaining political issues than most news outlets | I feel more informed about politics when I use AI tools | I trust AI to present political issues fairly |
|---|---|---|---|---|---|
| Overall | 45% | 54% | 42% | 39% | 32% |
| Gender | |||||
| Male | 48% | 59% | 39% | 40% | 35% |
| Female | 42% | 50% | 44% | 38% | 30% |
| Education | |||||
| No HS | 38% | 67% | 41% | 32% | 43% |
| HS | 39% | 36% | 38% | 38% | 37% |
| Some Col | 41% | 52% | 33% | 30% | 28% |
| 2-yr | 56% | 69% | 55% | 46% | 26% |
| 4-yr | 56% | 54% | 44% | 50% | 37% |
| Post-grad | 35% | 71% | 44% | 31% | 22% |
| Income | |||||
| <$30K | 54% | 60% | 43% | 45% | 45% |
| $30-50K | 50% | 47% | 39% | 39% | 30% |
| $50-80K | 48% | 46% | 41% | 36% | 30% |
| $80-120K | 35% | 60% | 46% | 41% | 22% |
| $120K+ | 43% | 54% | 45% | 38% | 31% |
| Party ID | |||||
| Dem | 46% | 55% | 40% | 43% | 31% |
| Ind | 35% | 51% | 31% | 28% | 30% |
| Rep | 49% | 55% | 49% | 41% | 34% |
| AI Comfort | |||||
| Not Comf | 18% | 79% | 14% | 9% | 8% |
| Slight | 34% | 57% | 36% | 24% | 15% |
| Moderate | 38% | 52% | 37% | 33% | 25% |
| Very | 63% | 47% | 54% | 61% | 54% |
| Extremely | 83% | 50% | 71% | 80% | 77% |
| Group | Yes | No |
|---|---|---|
| Overall | 7% | 93% |
| Gender | ||
| Male | 8% | 92% |
| Female | 7% | 93% |
| Education | ||
| No HS | 5% | 95% |
| HS | 5% | 95% |
| Some Col | 9% | 91% |
| 2-yr | 6% | 94% |
| 4-yr | 11% | 89% |
| Post-grad | 7% | 93% |
| Income | ||
| <$30K | 9% | 91% |
| $30-50K | 5% | 95% |
| $50-80K | 9% | 91% |
| $80-120K | 7% | 93% |
| $120K+ | 8% | 92% |
| Party ID | ||
| Dem | 7% | 93% |
| Ind | 7% | 93% |
| Rep | 8% | 92% |
| AI Comfort | ||
| Not Comf | 1% | 99% |
| Slight | 5% | 95% |
| Moderate | 7% | 93% |
| Very | 22% | 78% |
| Extremely | 27% | 73% |
| Group | Yes | No |
|---|---|---|
| Overall | 8% | 92% |
| Gender | ||
| Male | 10% | 90% |
| Female | 7% | 93% |
| Education | ||
| No HS | 5% | 95% |
| HS | 6% | 94% |
| Some Col | 12% | 88% |
| 2-yr | 6% | 94% |
| 4-yr | 13% | 87% |
| Post-grad | 5% | 95% |
| Income | ||
| <$30K | 9% | 91% |
| $30-50K | 8% | 92% |
| $50-80K | 9% | 91% |
| $80-120K | 7% | 93% |
| $120K+ | 12% | 88% |
| Party ID | ||
| Dem | 9% | 91% |
| Ind | 7% | 93% |
| Rep | 9% | 91% |
| AI Comfort | ||
| Not Comf | 2% | 98% |
| Slight | 7% | 93% |
| Moderate | 7% | 93% |
| Very | 21% | 79% |
| Extremely | 32% | 68% |
| Group | AI providing inaccurate information about candidates | AI being biased toward one political party | AI-generated misinformation about candidates | AI discouraging people from voting or giving wrong voting info | AI replacing journalism |
|---|---|---|---|---|---|
| Overall | 57% | 54% | 56% | 48% | 47% |
| Gender | |||||
| Male | 58% | 56% | 60% | 51% | 46% |
| Female | 56% | 51% | 52% | 46% | 48% |
| Education | |||||
| No HS | 47% | 48% | 43% | 46% | 39% |
| HS | 52% | 53% | 51% | 45% | 47% |
| Some Col | 57% | 49% | 58% | 47% | 47% |
| 2-yr | 57% | 54% | 54% | 51% | 53% |
| 4-yr | 62% | 57% | 63% | 53% | 49% |
| Post-grad | 62% | 60% | 61% | 48% | 42% |
| Income | |||||
| <$30K | 53% | 52% | 54% | 49% | 53% |
| $30-50K | 61% | 54% | 60% | 53% | 52% |
| $50-80K | 54% | 52% | 55% | 43% | 43% |
| $80-120K | 55% | 52% | 52% | 50% | 39% |
| $120K+ | 59% | 56% | 54% | 43% | 41% |
| Party ID | |||||
| Dem | 61% | 55% | 62% | 55% | 54% |
| Ind | 50% | 48% | 47% | 42% | 41% |
| Rep | 57% | 56% | 55% | 45% | 44% |
| AI Comfort | |||||
| Not Comf | 75% | 73% | 74% | 71% | 70% |
| Slight | 56% | 53% | 58% | 45% | 40% |
| Moderate | 43% | 39% | 42% | 33% | 35% |
| Very | 45% | 39% | 35% | 31% | 26% |
| Extremely | 39% | 40% | 45% | 31% | 36% |
| Group | Definitely not | Probably not | Not sure | Probably yes | Definitely yes |
|---|---|---|---|---|---|
| Overall | 54% | 21% | 16% | 7% | 2% |
| Gender | |||||
| Male | 56% | 19% | 17% | 5% | 3% |
| Female | 51% | 23% | 15% | 9% | 2% |
| Education | |||||
| No HS | 50% | 28% | 15% | 2% | 5% |
| HS | 62% | 16% | 18% | 3% | 2% |
| Some Col | 55% | 22% | 17% | 3% | 4% |
| 2-yr | 57% | 19% | 10% | 12% | 1% |
| 4-yr | 44% | 19% | 18% | 15% | 3% |
| Post-grad | 47% | 32% | 11% | 9% | 2% |
| Income | |||||
| <$30K | 55% | 15% | 20% | 5% | 5% |
| $30-50K | 62% | 18% | 16% | 3% | 1% |
| $50-80K | 52% | 24% | 14% | 9% | 1% |
| $80-120K | 45% | 26% | 16% | 11% | 2% |
| $120K+ | 48% | 25% | 14% | 11% | 2% |
| Party ID | |||||
| Dem | 53% | 22% | 13% | 9% | 3% |
| Ind | 59% | 18% | 19% | 5% | 0% |
| Rep | 51% | 22% | 17% | 7% | 3% |
| AI Comfort | |||||
| Not Comf | 84% | 11% | 6% | 0% | - |
| Slight | 48% | 28% | 17% | 6% | 1% |
| Moderate | 37% | 27% | 26% | 8% | 1% |
| Very | 27% | 23% | 20% | 23% | 8% |
| Extremely | 29% | 15% | 12% | 19% | 25% |
| Group | Learning about candidates' policy positions | Comparing candidates to each other | Understanding ballot measures or propositions | Figuring out who or what is on my ballot | Researching candidates' backgrounds or records | Fact-checking claims made by candidates | Understanding how elections work |
|---|---|---|---|---|---|---|---|
| Overall | 42% | 33% | 36% | 33% | 41% | 47% | 27% |
| Gender | |||||||
| Male | 42% | 32% | 39% | 34% | 43% | 48% | 25% |
| Female | 43% | 35% | 33% | 32% | 39% | 45% | 28% |
| Education | |||||||
| No HS | 55% | 40% | 51% | 35% | 70% | 60% | 37% |
| HS | 33% | 28% | 27% | 31% | 35% | 39% | 29% |
| Some Col | 37% | 29% | 32% | 21% | 38% | 44% | 18% |
| 2-yr | 46% | 27% | 31% | 36% | 32% | 47% | 33% |
| 4-yr | 54% | 47% | 44% | 42% | 51% | 56% | 32% |
| Post-grad | 38% | 28% | 39% | 32% | 30% | 43% | 19% |
| Income | |||||||
| <$30K | 42% | 33% | 34% | 27% | 35% | 48% | 31% |
| $30-50K | 41% | 31% | 41% | 41% | 46% | 46% | 27% |
| $50-80K | 28% | 29% | 29% | 31% | 31% | 41% | 24% |
| $80-120K | 50% | 40% | 45% | 45% | 48% | 52% | 31% |
| $120K+ | 58% | 40% | 41% | 32% | 51% | 51% | 28% |
| Party ID | |||||||
| Dem | 47% | 37% | 41% | 36% | 42% | 50% | 32% |
| Ind | 40% | 30% | 29% | 30% | 38% | 41% | 28% |
| Rep | 39% | 31% | 34% | 31% | 41% | 46% | 22% |
| AI Comfort | |||||||
| Not Comf | 18% | 6% | 19% | 7% | 11% | 28% | 6% |
| Slight | 41% | 32% | 39% | 32% | 43% | 52% | 21% |
| Moderate | 37% | 30% | 25% | 27% | 35% | 39% | 23% |
| Very | 64% | 52% | 55% | 58% | 62% | 57% | 47% |
| Extremely | 56% | 49% | 53% | 43% | 56% | 66% | 53% |
| Group | Candidate's own website or campaign materials | News articles about the candidate | Social media posts by or about the candidate | An AI chatbot (e.g., ChatGPT, Claude, Perplexity) | A voter guide from a nonpartisan organization | Talking to friends, family, or colleagues |
|---|---|---|---|---|---|---|
| Overall | 47% | 61% | 38% | 17% | 44% | 59% |
| Gender | ||||||
| Male | 46% | 60% | 38% | 18% | 45% | 60% |
| Female | 48% | 61% | 38% | 16% | 43% | 58% |
| Education | ||||||
| No HS | 27% | 61% | 40% | 20% | 36% | 50% |
| HS | 33% | 49% | 34% | 15% | 33% | 53% |
| Some Col | 52% | 62% | 38% | 11% | 41% | 55% |
| 2-yr | 48% | 59% | 29% | 18% | 44% | 56% |
| 4-yr | 65% | 72% | 50% | 26% | 58% | 70% |
| Post-grad | 51% | 67% | 37% | 15% | 55% | 68% |
| Income | ||||||
| <$30K | 37% | 53% | 32% | 16% | 32% | 48% |
| $30-50K | 50% | 56% | 38% | 14% | 45% | 63% |
| $50-80K | 40% | 60% | 40% | 19% | 44% | 59% |
| $80-120K | 55% | 65% | 41% | 20% | 52% | 66% |
| $120K+ | 63% | 73% | 45% | 22% | 53% | 68% |
| Party ID | ||||||
| Dem | 58% | 72% | 47% | 18% | 52% | 65% |
| Ind | 29% | 41% | 28% | 15% | 29% | 40% |
| Rep | 47% | 61% | 35% | 17% | 45% | 65% |
| AI Comfort | ||||||
| Not Comf | 50% | 61% | 35% | 2% | 47% | 63% |
| Slight | 48% | 61% | 36% | 10% | 43% | 56% |
| Moderate | 43% | 60% | 35% | 20% | 40% | 53% |
| Very | 47% | 61% | 51% | 56% | 46% | 67% |
| Extremely | 47% | 58% | 55% | 46% | 39% | 55% |
| Group | A neutral summary of platform and key positions | The candidate's voting record or past policy decisions | What the candidate has said about issues I care about | How the candidate compares to opponent(s) on key issues | Background information (education, career, experience) | Endorsements the candidate has received | Criticisms or controversies involving the candidate | Whether the candidate's claims are accurate | None of the above |
|---|---|---|---|---|---|---|---|---|---|
| Overall | 39% | 35% | 42% | 35% | 37% | 19% | 26% | 39% | 35% |
| Gender | |||||||||
| Male | 35% | 36% | 37% | 31% | 34% | 19% | 26% | 39% | 37% |
| Female | 42% | 34% | 47% | 38% | 39% | 18% | 26% | 40% | 34% |
| Education | |||||||||
| No HS | 30% | 30% | 48% | 38% | 47% | 15% | 29% | 41% | 38% |
| HS | 27% | 24% | 33% | 27% | 24% | 18% | 18% | 31% | 46% |
| Some Col | 40% | 35% | 43% | 35% | 41% | 19% | 37% | 45% | 34% |
| 2-yr | 42% | 32% | 43% | 32% | 35% | 18% | 20% | 37% | 36% |
| 4-yr | 50% | 49% | 47% | 38% | 47% | 19% | 29% | 46% | 25% |
| Post-grad | 50% | 44% | 49% | 48% | 41% | 19% | 28% | 40% | 25% |
| Income | |||||||||
| <$30K | 34% | 31% | 38% | 29% | 34% | 18% | 27% | 37% | 35% |
| $30-50K | 37% | 31% | 36% | 30% | 31% | 14% | 17% | 34% | 41% |
| $50-80K | 36% | 30% | 42% | 36% | 36% | 17% | 25% | 40% | 38% |
| $80-120K | 49% | 38% | 52% | 45% | 45% | 27% | 32% | 46% | 28% |
| $120K+ | 47% | 49% | 52% | 42% | 46% | 19% | 29% | 45% | 24% |
| Party ID | |||||||||
| Dem | 43% | 36% | 44% | 37% | 40% | 22% | 29% | 43% | 34% |
| Ind | 36% | 28% | 32% | 27% | 29% | 11% | 22% | 29% | 43% |
| Rep | 37% | 38% | 46% | 37% | 38% | 20% | 26% | 42% | 31% |
| AI Comfort | |||||||||
| Not Comf | 23% | 26% | 27% | 23% | 25% | 15% | 17% | 28% | 60% |
| Slight | 45% | 39% | 50% | 38% | 45% | 18% | 30% | 43% | 25% |
| Moderate | 44% | 36% | 45% | 40% | 37% | 17% | 27% | 41% | 29% |
| Very | 58% | 43% | 56% | 47% | 51% | 23% | 37% | 54% | 10% |
| Extremely | 40% | 49% | 55% | 40% | 42% | 42% | 41% | 54% | 16% |
| Group | ChatGPT | Google Gemini | Claude (Anthropic) | Microsoft Copilot | Perplexity | Meta AI | Grok | Apple Intelligence / Siri with AI | Other | None of the above |
|---|---|---|---|---|---|---|---|---|---|---|
| Overall | 42% | 35% | 7% | 18% | 5% | 18% | 10% | 10% | 2% | 34% |
| Gender | ||||||||||
| Male | 42% | 36% | 8% | 21% | 6% | 18% | 14% | 11% | 2% | 33% |
| Female | 42% | 35% | 6% | 15% | 4% | 19% | 6% | 8% | 2% | 36% |
| Education | ||||||||||
| No HS | 31% | 42% | 0% | 17% | 7% | 26% | 6% | 15% | 0% | 31% |
| HS | 28% | 31% | 3% | 15% | 4% | 18% | 10% | 9% | 2% | 46% |
| Some Col | 41% | 30% | 5% | 12% | 3% | 17% | 7% | 8% | 3% | 37% |
| 2-yr | 44% | 38% | 9% | 22% | 1% | 12% | 9% | 6% | 1% | 32% |
| 4-yr | 56% | 43% | 11% | 24% | 9% | 25% | 14% | 14% | 3% | 23% |
| Post-grad | 60% | 37% | 11% | 24% | 5% | 12% | 8% | 10% | 1% | 26% |
| Income | ||||||||||
| <$30K | 36% | 40% | 4% | 16% | 5% | 26% | 6% | 8% | 4% | 33% |
| $30-50K | 37% | 33% | 5% | 16% | 5% | 15% | 10% | 5% | 2% | 37% |
| $50-80K | 42% | 31% | 6% | 18% | 5% | 16% | 12% | 11% | 1% | 39% |
| $80-120K | 49% | 38% | 10% | 19% | 8% | 16% | 11% | 16% | 2% | 29% |
| $120K+ | 58% | 38% | 10% | 25% | 5% | 19% | 11% | 11% | 1% | 26% |
| Party ID | ||||||||||
| Dem | 42% | 38% | 9% | 20% | 4% | 18% | 6% | 12% | 1% | 35% |
| Ind | 43% | 35% | 5% | 15% | 8% | 16% | 10% | 6% | 4% | 33% |
| Rep | 42% | 34% | 6% | 18% | 4% | 20% | 13% | 10% | 2% | 34% |
| AI Comfort | ||||||||||
| Not Comf | 12% | 13% | 2% | 7% | 1% | 4% | 2% | 3% | 1% | 75% |
| Slight | 46% | 39% | 5% | 18% | 5% | 19% | 12% | 10% | 2% | 18% |
| Moderate | 56% | 47% | 10% | 23% | 6% | 23% | 8% | 14% | 3% | 16% |
| Very | 76% | 53% | 13% | 33% | 9% | 36% | 22% | 11% | 2% | 9% |
| Extremely | 75% | 65% | 16% | 36% | 14% | 52% | 32% | 29% | 3% | 4% |
| Group | Not at all comfortable | Slightly comfortable | Moderately comfortable | Very comfortable | Extremely comfortable |
|---|---|---|---|---|---|
| Overall | 33% | 25% | 26% | 12% | 5% |
| Gender | |||||
| Male | 33% | 21% | 26% | 14% | 6% |
| Female | 33% | 28% | 26% | 10% | 3% |
| Education | |||||
| No HS | 32% | 23% | 34% | 8% | 3% |
| HS | 37% | 23% | 23% | 10% | 6% |
| Some Col | 40% | 26% | 24% | 6% | 4% |
| 2-yr | 32% | 29% | 24% | 13% | 2% |
| 4-yr | 27% | 22% | 26% | 20% | 4% |
| Post-grad | 23% | 28% | 33% | 11% | 6% |
| Income | |||||
| <$30K | 33% | 25% | 27% | 7% | 9% |
| $30-50K | 36% | 32% | 16% | 13% | 3% |
| $50-80K | 34% | 21% | 28% | 13% | 3% |
| $80-120K | 27% | 22% | 31% | 18% | 2% |
| $120K+ | 26% | 29% | 26% | 14% | 6% |
| Party ID | |||||
| Dem | 35% | 27% | 23% | 10% | 6% |
| Ind | 28% | 22% | 32% | 14% | 4% |
| Rep | 34% | 25% | 25% | 12% | 4% |