Skip to content

Democrat · U.S. House, Massachusetts’s 6th district

Serving since Jan 6, 2015119th Congress (2025–27)next election Nov 3, 2026

Bioguide M001196FEC H4MA06090, S6MA00296

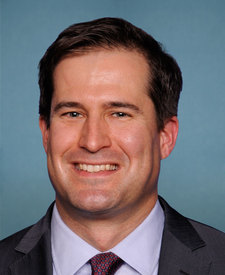
Portrait of Seth Moulton, rendered as a two-tone print
Official portrait
15%
of roll calls missed, attendance in the bottom 5% of House Democrats

Attendance 85%; the average among House Democrats is 96.9%. Ranks 214th of 217, where 1st has the highest attendance. 674 roll calls in the 119th Congress.

Attendance is the share of the roll calls Moulton could vote on where a yea, nay or present was recorded, ranked among House Democrats. A missed vote has many causes, from illness to campaigning; the number says how often, not why.

At a glance

6 measures against House Democrats. 14% of the 22 bills Moulton sponsored got out of committee, in the top tenth of House Democrats. Moulton raised $6.7M in the 2026 cycle, in the top tenth of House Democrats (median $2.0M).

The measures on which Moulton sits furthest from the middle of House Democrats, each against the same group, with the CSIP score when there is one. Every number is explained in its own section below.

Attendance

85%

House Democrats average 96.9% · ranks 214th of 217 · 674 roll calls

Out of committee

14%

House Democrats average 4.9% · ranks 19th of 207

Raised, 2026

$6.7M

House Democrats’ median $2.0M · ranks 19th of 214

Credit claiming

32%

House Democrats average 23% · ranks 32nd of 216

CSIP ideology

−0.83

More conservative than 72% of House Democrats · ± 0.01

Personal attacks

7.9%

House Democrats average 6.6% · ranks 66th of 216

Peer group: House Democrats. Rank 1 is the highest value in the group; the thick bar is Moulton, the thin grey bar the peer average. The headline is the measure on which Moulton is most unusual among peers (Methods, §08).

Back to topNext: What politicians say

What Moulton says

Moulton claims credit more than 85% of House Democrats. Credit claiming in 32% of 883 statements, against 23% for the average House Democrat; 32nd of 216.

An AI model reads each of Moulton’s 883 statements in the 119th Congress (548 posts on X, 209 press releases, 102 newsletters, 24 Congressional Record speeches) and marks the kinds of statement it contains: a personal attack, criticism of a policy, discussion of policy, bipartisanship, credit claiming, and extreme labels. A statement can carry several. Every rate is compared with the average for House Democrats and ranked among them.

Kinds of statement

Share of statements carrying each label, the 119th Congress

0%80%
Moulton
Peers
Rank
Policy discussion670 statements
76%
73%
84th of 216
Credit claiming279 statements
32%
23%
32nd of 216
Policy criticism236 statements
27%
28%
133rd of 216
Bipartisanship80 statements
9%
10%
97th of 216
Personal attacks70 statements
8%
7%
66th of 216
Show the data
Moulton's share of statements in each category against the House Democrats average.
RowMoultonPeers
Policy discussion76%73%
Credit claiming32%23%
Policy criticism27%28%
Bipartisanship9%10%
Personal attacks8%7%
883

statements classified

548 posts on X, 209 press releases, 102 newsletters, 24 Congressional Record speeches.

posts on X: 548 (62.1%)posts on X 548press releases: 209 (23.7%)press releases 209newsletters: 102 (11.6%)Congressional Record speeches: 24 (2.7%)
Show the data
Moulton's statements by source
PartValue
posts on X548
press releases209
newsletters102
Congressional Record speeches24
How to read the bars

The thick bar is Moulton; the thin grey bar is the average House Democrats. A longer thick bar means Moulton does this more than peers. Rank 1 is the highest rate in the group.

Extreme labels

Moulton used extreme labels in 1.6% of statements, below the peer average. 14 statements, most often aimed at culture provisions; peers 1.9%.

  1. “extreme”6
  2. “communist”2
  3. “MAGA”1
  4. “far right”1

Who gets the labels

Targets named alongside an extreme label, by number of statements

  1. culture provisions1
  2. H.R. 281
  3. House Republicans1
  4. MAGA Republicans1
  5. Republican lawmakers1
What an extreme label is

Calls a politician, a party or a policy “far left”, “far right”, “MAGA”, “extreme”, “radical”, “woke”, “fascist” or “communist”. The target is who or what the label was aimed at. The lists show the five most used labels and targets; the toggle shows the rest.

Month by month

Share of statements per month, the 119th Congress

Statements2025-01: 272025-02: 132025-03: 302025-04: 182025-05: 212025-06: 152025-07: 212025-08: 72025-09: 302025-10: 302025-11: 442025-12: 392026-01: 582026-02: 662026-03: 722026-04: 642026-05: 542026-06: 622026-07: 732026-08: 1062026-09: 252026-10: 8peak 106 · Aug ’26Personal attackspeak 30.0% · Mar ’25 · latest 8.0%Personal attacks, 2025-01: 11.1% of 27Personal attacks, 2025-02: 15.4% of 13Personal attacks, 2025-03: 30.0% of 30Personal attacks, 2025-04: 5.6% of 18Personal attacks, 2025-05: 0.0% of 21Personal attacks, 2025-06: 13.3% of 15Personal attacks, 2025-07: 4.8% of 21Personal attacks, 2025-08: not plotted (fewer than 10 statements)Personal attacks, 2025-09: 3.3% of 30Personal attacks, 2025-10: 0.0% of 30Personal attacks, 2025-11: 0.0% of 44Personal attacks, 2025-12: 7.7% of 39Personal attacks, 2026-01: 13.8% of 58Personal attacks, 2026-02: 6.1% of 66Personal attacks, 2026-03: 1.4% of 72Personal attacks, 2026-04: 14.1% of 64Personal attacks, 2026-05: 14.8% of 54Personal attacks, 2026-06: 6.5% of 62Personal attacks, 2026-07: 9.6% of 73Personal attacks, 2026-08: 3.8% of 106Personal attacks, 2026-09: 8.0% of 25Personal attacks, 2026-10: not plotted (fewer than 10 statements)Policy criticismpeak 50.0% · Mar ’25 · latest 28.0%Policy criticism, 2025-01: 37.0% of 27Policy criticism, 2025-02: 23.1% of 13Policy criticism, 2025-03: 50.0% of 30Policy criticism, 2025-04: 27.8% of 18Policy criticism, 2025-05: 19.1% of 21Policy criticism, 2025-06: 6.7% of 15Policy criticism, 2025-07: 33.3% of 21Policy criticism, 2025-08: not plotted (fewer than 10 statements)Policy criticism, 2025-09: 10.0% of 30Policy criticism, 2025-10: 33.3% of 30Policy criticism, 2025-11: 29.5% of 44Policy criticism, 2025-12: 28.2% of 39Policy criticism, 2026-01: 15.5% of 58Policy criticism, 2026-02: 19.7% of 66Policy criticism, 2026-03: 37.5% of 72Policy criticism, 2026-04: 29.7% of 64Policy criticism, 2026-05: 31.5% of 54Policy criticism, 2026-06: 30.6% of 62Policy criticism, 2026-07: 24.7% of 73Policy criticism, 2026-08: 19.8% of 106Policy criticism, 2026-09: 28.0% of 25Policy criticism, 2026-10: not plotted (fewer than 10 statements)Policy discussionpeak 97.2% · Aug ’26 · latest 80.0%Policy discussion, 2025-01: 77.8% of 27Policy discussion, 2025-02: 69.2% of 13Policy discussion, 2025-03: 80.0% of 30Policy discussion, 2025-04: 55.6% of 18Policy discussion, 2025-05: 76.2% of 21Policy discussion, 2025-06: 73.3% of 15Policy discussion, 2025-07: 76.2% of 21Policy discussion, 2025-08: not plotted (fewer than 10 statements)Policy discussion, 2025-09: 70.0% of 30Policy discussion, 2025-10: 70.0% of 30Policy discussion, 2025-11: 63.6% of 44Policy discussion, 2025-12: 71.8% of 39Policy discussion, 2026-01: 87.9% of 58Policy discussion, 2026-02: 59.1% of 66Policy discussion, 2026-03: 77.8% of 72Policy discussion, 2026-04: 68.8% of 64Policy discussion, 2026-05: 64.8% of 54Policy discussion, 2026-06: 74.2% of 62Policy discussion, 2026-07: 84.9% of 73Policy discussion, 2026-08: 97.2% of 106Policy discussion, 2026-09: 80.0% of 25Policy discussion, 2026-10: not plotted (fewer than 10 statements)Bipartisanshippeak 33.3% · Mar ’25 · latest 12.0%Bipartisanship, 2025-01: 29.6% of 27Bipartisanship, 2025-02: 23.1% of 13Bipartisanship, 2025-03: 33.3% of 30Bipartisanship, 2025-04: 5.6% of 18Bipartisanship, 2025-05: 28.6% of 21Bipartisanship, 2025-06: 6.7% of 15Bipartisanship, 2025-07: 19.1% of 21Bipartisanship, 2025-08: not plotted (fewer than 10 statements)Bipartisanship, 2025-09: 13.3% of 30Bipartisanship, 2025-10: 10.0% of 30Bipartisanship, 2025-11: 6.8% of 44Bipartisanship, 2025-12: 5.1% of 39Bipartisanship, 2026-01: 5.2% of 58Bipartisanship, 2026-02: 3.0% of 66Bipartisanship, 2026-03: 6.9% of 72Bipartisanship, 2026-04: 9.4% of 64Bipartisanship, 2026-05: 5.6% of 54Bipartisanship, 2026-06: 3.2% of 62Bipartisanship, 2026-07: 5.5% of 73Bipartisanship, 2026-08: 5.7% of 106Bipartisanship, 2026-09: 12.0% of 25Bipartisanship, 2026-10: not plotted (fewer than 10 statements)Credit claimingpeak 46.7% · Mar ’25 · latest 24.0%Credit claiming, 2025-01: 25.9% of 27Credit claiming, 2025-02: 38.5% of 13Credit claiming, 2025-03: 46.7% of 30Credit claiming, 2025-04: 16.7% of 18Credit claiming, 2025-05: 38.1% of 21Credit claiming, 2025-06: 26.7% of 15Credit claiming, 2025-07: 38.1% of 21Credit claiming, 2025-08: not plotted (fewer than 10 statements)Credit claiming, 2025-09: 30.0% of 30Credit claiming, 2025-10: 16.7% of 30Credit claiming, 2025-11: 34.1% of 44Credit claiming, 2025-12: 28.2% of 39Credit claiming, 2026-01: 24.1% of 58Credit claiming, 2026-02: 21.2% of 66Credit claiming, 2026-03: 33.3% of 72Credit claiming, 2026-04: 25.0% of 64Credit claiming, 2026-05: 40.7% of 54Credit claiming, 2026-06: 29.0% of 62Credit claiming, 2026-07: 39.7% of 73Credit claiming, 2026-08: 41.5% of 106Credit claiming, 2026-09: 24.0% of 25Credit claiming, 2026-10: not plotted (fewer than 10 statements)Extreme labelspeak 13.3% · Mar ’25 · latest 0.0%Extreme labels, 2025-01: 7.4% of 27Extreme labels, 2025-02: 0.0% of 13Extreme labels, 2025-03: 13.3% of 30Extreme labels, 2025-04: 0.0% of 18Extreme labels, 2025-05: 0.0% of 21Extreme labels, 2025-06: 6.7% of 15Extreme labels, 2025-07: 0.0% of 21Extreme labels, 2025-08: not plotted (fewer than 10 statements)Extreme labels, 2025-09: 6.7% of 30Extreme labels, 2025-10: 3.3% of 30Extreme labels, 2025-11: 0.0% of 44Extreme labels, 2025-12: 0.0% of 39Extreme labels, 2026-01: 0.0% of 58Extreme labels, 2026-02: 0.0% of 66Extreme labels, 2026-03: 0.0% of 72Extreme labels, 2026-04: 0.0% of 64Extreme labels, 2026-05: 1.8% of 54Extreme labels, 2026-06: 0.0% of 62Extreme labels, 2026-07: 4.1% of 73Extreme labels, 2026-08: 0.0% of 106Extreme labels, 2026-09: 0.0% of 25Extreme labels, 2026-10: not plotted (fewer than 10 statements)Jan ’25Jul ’25Jan ’26Jul ’26Oct ’26
Show the data
Monthly rates for Moulton, each row shaded against its own peak, with statement volume. Months with fewer than 10 statements are left blank.
ColumnStatementsPersonal attacksPolicy criticismPolicy discussionBipartisanshipCredit claimingExtreme labels
Jan ’252711.1%37.0%77.8%29.6%25.9%7.4%
Feb ’251315.4%23.1%69.2%23.1%38.5%0.0%
Mar ’253030.0%50.0%80.0%33.3%46.7%13.3%
Apr ’25185.6%27.8%55.6%5.6%16.7%0.0%
May ’25210.0%19.1%76.2%28.6%38.1%0.0%
Jun ’251513.3%6.7%73.3%6.7%26.7%6.7%
Jul ’25214.8%33.3%76.2%19.1%38.1%0.0%
Aug ’257— (fewer than 10 statements)— (fewer than 10 statements)— (fewer than 10 statements)— (fewer than 10 statements)— (fewer than 10 statements)— (fewer than 10 statements)
Sep ’25303.3%10.0%70.0%13.3%30.0%6.7%
Oct ’25300.0%33.3%70.0%10.0%16.7%3.3%
Nov ’25440.0%29.5%63.6%6.8%34.1%0.0%
Dec ’25397.7%28.2%71.8%5.1%28.2%0.0%
Jan ’265813.8%15.5%87.9%5.2%24.1%0.0%
Feb ’26666.1%19.7%59.1%3.0%21.2%0.0%
Mar ’26721.4%37.5%77.8%6.9%33.3%0.0%
Apr ’266414.1%29.7%68.8%9.4%25.0%0.0%
May ’265414.8%31.5%64.8%5.6%40.7%1.8%
Jun ’26626.5%30.6%74.2%3.2%29.0%0.0%
Jul ’26739.6%24.7%84.9%5.5%39.7%4.1%
Aug ’261063.8%19.8%97.2%5.7%41.5%0.0%
Sep ’26258.0%28.0%80.0%12.0%24.0%0.0%
Oct ’268— (fewer than 10 statements)— (fewer than 10 statements)— (fewer than 10 statements)— (fewer than 10 statements)— (fewer than 10 statements)— (fewer than 10 statements)
How to read the strips

Each row is one kind of statement; each cell is a month, shaded against that row’s own peak (darker = closer to the peak), with the peak and the latest value written at the right. The top row counts statements. The strip covers every month of the 119th Congress, the same span as the rates above, including months with no statements. A month with fewer than 10 statements is hatched, not shaded: one or two posts would swing its rate to 0% or 100%. 2 months are hatched here.

In Moulton’s words

Real statements from the classifier’s example set, with the labels it assigned

Personal attacks

Mr. Speaker, I yield myself such time as I may consume. Mr. Speaker, my colleague from Florida delivered a comprehensive list of many of the threats that Iran has presented to us in the past. I have not heard any Democrat, myself or otherwise, debate those threats. The question is: Is Iran a threat…

Sep 14, 2026 · Congressional Record · personal attacks; policy criticism; policy discussion; credit claiming; Armed Forces and National Security; International Affairs; Energy; Foreign Trade and International Finance; Economics and Public Finance; Law; target: Donald Trump, Pete Hegseth · Source

Credit claiming

The text of this post is on X; follow the source link to read it.

Oct 2, 2026 · Posts on X · policy discussion; credit claiming; Health; Civil Rights and Liberties, Minority Issues · Source

Extreme label

The text of this post is on X; follow the source link to read it.

Jul 31, 2026 · Posts on X · policy discussion; International Affairs; Armed Forces and National Security; extreme label “extreme” aimed at violence · Source

Examples by category

Up to five recent statements in each category

Category

Overtly questions a named person’s character, integrity or loyalty, or calls them names. Criticising a record or a policy does not count.

  1. Congressional Record

    Mr. Speaker, I yield myself such time as I may consume. Mr. Speaker, my colleague from Florida delivered a comprehensive list of many of the threats that Iran has presented to us in the past. I have not heard any Democrat, myself or otherwise, debate those threats. The question is: Is Iran a threat today? I think my colleague would agree that they are. The second question is: Is Iran more of a threat today than they…

    personal attacks · policy criticism · policy discussion · credit claiming · Armed Forces and National Security · International Affairs · Energy · Foreign Trade and International Finance · Economics and Public Finance · Law · target: Donald Trump, Pete HegsethSource

  2. Posts on X

    The text of this post is on X; follow the source link to read it.

    personal attacks · policy discussion · Government Operations and Politics · target: TrumpSource

  3. Posts on X

    The text of this post is on X; follow the source link to read it.

    personal attacks · policy discussion · Agriculture and Food · Housing and Community Development · Health · Energy · International Affairs · target: TrumpSource

  4. Press releases

    Moulton, Bacon, Whitesides Introduce Bipartisan Bill to Investigate Insider Trading Within the Department of Defense, Urges Prediction Markets to Crack Down on Harmful Practice WASHINGTON D.C. – Congressmen Seth Moulton (MA–06), Don Bacon (NE–02), and George Whitesides (CA–27) introduced the bipartisan No Insider Trading on National Security Act of 2026, legislation that investigates insider trading within the Depart…

    personal attacks · policy discussion · bipartisanship · credit claiming · Armed Forces and National Security · Finance and Financial Sector · Government Operations and Politics · target: Donald TrumpSource

  5. Posts on X

    The text of this post is on X; follow the source link to read it.

    personal attacks · policy discussion · Armed Forces and National Security · target: Donald TrumpSource

All 883 statements

Newest first, the 119th Congress

The full feed

Five statements at a time, newest first; filters apply to the statements loaded so far. Export saves the statements that match. Sources: 548 posts on X, 209 press releases, 102 newsletters, 24 Congressional Record speeches.

Back to topNext: Policy

Policy

Armed Forces and National Security is what Moulton talks about most: 31% of policy statements, 2.0 times the peer share. Talk and legislation agree at 0.69 on a 0–1 scale (House Democrats average 0.67; 81st of 216).

Each policy statement is tagged by the AI model with one or more of 25 policy areas from the Congressional Research Service list, so the shares say what Moulton talks about. The bills Moulton sponsors and cosponsors carry the same areas, so the two can be compared.

What Moulton talks about

Share of policy statements by area, the 119th Congress

0%35%
Moulton
Peers
Armed Forces and National Security205 statements
31%
16%
Health160 statements
24%
26%
Government Operations and Politics149 statements
22%
20%
Economics and Public Finance146 statements
22%
20%
Immigration137 statements
20%
11%
Show the data
Policy areas Moulton talks about, as a share of policy statements, against the House Democrats average.
RowMoultonPeers
Armed Forces and National Security31%16%
Health24%26%
Government Operations and Politics22%20%
Economics and Public Finance22%20%
Immigration20%11%
How to read the bars

The thick bar is the share of Moulton’s policy statements in an area; the thin grey bar is the average share for House Democrats. A statement counts once in each of its areas, so shares can add to more than 100%. The five largest areas are shown; the toggle shows the rest.

Talks about · legislates on

Left: share of statements by policy area. Right: share of bills. Areas in order of their share of statements; both sides run from 0 to 35%. Grey ticks are the House Democrats averages.

Talks aboutLegislates onArmed Forces and NationalSecurityArmed Forces and National Security, talks about: 31% (House Democrats 16%)31%Armed Forces and National Security, legislates on: 11% (House Democrats 7%)11%HealthHealth, talks about: 24% (House Democrats 26%)24%Health, legislates on: 17% (House Democrats 16%)17%Government Operations andPoliticsGovernment Operations and Politics, talks about: 22% (House Democrats 20%)22%Government Operations and Politics, legislates on: 10% (House Democrats 11%)10%Economics and Public FinanceEconomics and Public Finance, talks about: 22% (House Democrats 20%)22%Economics and Public Finance, legislates on: 0% (House Democrats 1%)0%ImmigrationImmigration, talks about: 20% (House Democrats 11%)20%Immigration, legislates on: 7% (House Democrats 4%)7%
Show the data
Moulton's share of statements against share of bills in each policy area.
AreaTalks aboutHouse Democrats, talks aboutLegislates onHouse Democrats, legislates on
Armed Forces and National Security31%16%11%7%
Health24%26%17%16%
Government Operations and Politics22%20%10%11%
Economics and Public Finance22%20%0%1%
Immigration20%11%7%4%
0.69

talk-to-bills agreement, 0 to 1

House Democrats average 0.67. Ranks 81st of 216.

What agreement means, and what it doesn’t

Agreement is 1 minus the distance between the two distributions (Jensen–Shannon): 1 means Moulton legislates on exactly the areas Moulton talks about, in the same proportions; 0 means no overlap. It does not say whether the bills match the positions in the statements, only the subjects. Bills Moulton sponsored count fully, cosponsored bills a quarter. Shown with at least 20 policy statements and 5 bills.

Back to topNext: Ideology

Ideology

Moulton sits at −0.83 on the CSIP scale, left of 0, more conservative than 72% of House Democrats. Approximate range −0.85 to −0.82, which understates the uncertainty; from 4,251 donors and 6,105 roll calls.

CSIP, the lab’s Common-Space Ideal Point, places every official, federal and state, on one left–right scale, estimated from roll-call votes, who gives money to whom, and the text of statements. Negative is left of 0, positive right of it; 0 is the centre of the scale, not a definition of “moderate”.

−0.83

CSIP ideal point

Approximate range −0.85 to −0.82. From 4,251 donors and 6,105 roll calls. Run 2026-10-25T215945. Blue is left of 0, red right of 0.

← More liberalMore conservative →0Moulton −0.8House Democrats −1.0All House +0.3

The outlined dot is Moulton, coloured by its side of 0 (blue left, red right, deeper further out); the bar through it is the approximate range (±1.96 standard errors), which understates the uncertainty; the grey ticks below are the medians of Moulton’s groups. 0 is the centre of the scale, not “moderate” by definition.

What this means, and what it doesn’t

The score summarises how an official votes, who funds them and how they talk, relative to everyone else. It does not grade positions as good or bad, and two officials with the same score can differ on any single issue. The ± range is 1.96 standard errors, which understates the uncertainty: scores whose ranges overlap may not differ at all, and even scores whose ranges do not overlap may not differ.

Where Moulton sits

Every official in each group, on the CSIP scale

−2.0−1.00.0+1.0+2.0← More liberalMore conservative →House Democratsmedian −1.0Moulton −0.8All Housemedian +0.3
Show the data
Moulton's CSIP score of −0.83 placed against House Democrats, All House.
GroupOfficialsMedianShare left of Moulton
House Democrats217−1.072%
All House439+0.336%
How to read the strips

Every small dot is one official on the same scale, coloured by its own score (blue left of 0, red right of 0, grey at 0, deeper further out) and spread up and down only to keep dots apart; where a group is crowded the dots overlap, and darker patches mean more officials. The large outlined dot is Moulton in every row; the rule is each group’s median. The table under the figure gives the share of each group to the left of Moulton.

Back to topNext: Money

Money

Moulton raised $6.7M in the 2026 cycle, 3.4 times the House Democrats’ median of $2.0M. 9.8% of individual money came in gifts of $200 or less. 49% of itemized individual money came from Massachusetts.

Campaign money from Federal Election Commission filings, as aggregates only; the lab never shows an individual donor. Campaigns must report by name every person who gives them more than $200 in a cycle (“itemized”); smaller gifts are reported only as one total (“unitemized”), so donor counts, donor states, employers and occupations describe itemized donors only.

Election cycle
$6.7M

raised in the 2026 cycle

From 2,987 itemized donors. House Democrats’ median $2.0M.

Where the money came from

Each square is one percent of 2026-cycle receipts, from FEC summary totals.

Itemized individual (over $200): $5.7M (85.1%)Itemized individual (over $200): $5.7M (85.1%)Itemized individual (over $200): $5.7M (85.1%)Itemized individual (over $200): $5.7M (85.1%)Itemized individual (over $200): $5.7M (85.1%)Itemized individual (over $200): $5.7M (85.1%)Itemized individual (over $200): $5.7M (85.1%)Itemized individual (over $200): $5.7M (85.1%)Itemized individual (over $200): $5.7M (85.1%)Itemized individual (over $200): $5.7M (85.1%)Itemized individual (over $200): $5.7M (85.1%)Itemized individual (over $200): $5.7M (85.1%)Itemized individual (over $200): $5.7M (85.1%)Itemized individual (over $200): $5.7M (85.1%)Itemized individual (over $200): $5.7M (85.1%)Itemized individual (over $200): $5.7M (85.1%)Itemized individual (over $200): $5.7M (85.1%)Itemized individual (over $200): $5.7M (85.1%)Itemized individual (over $200): $5.7M (85.1%)Itemized individual (over $200): $5.7M (85.1%)Itemized individual (over $200): $5.7M (85.1%)Itemized individual (over $200): $5.7M (85.1%)Itemized individual (over $200): $5.7M (85.1%)Itemized individual (over $200): $5.7M (85.1%)Itemized individual (over $200): $5.7M (85.1%)Itemized individual (over $200): $5.7M (85.1%)Itemized individual (over $200): $5.7M (85.1%)Itemized individual (over $200): $5.7M (85.1%)Itemized individual (over $200): $5.7M (85.1%)Itemized individual (over $200): $5.7M (85.1%)Itemized individual (over $200): $5.7M (85.1%)Itemized individual (over $200): $5.7M (85.1%)Itemized individual (over $200): $5.7M (85.1%)Itemized individual (over $200): $5.7M (85.1%)Itemized individual (over $200): $5.7M (85.1%)Itemized individual (over $200): $5.7M (85.1%)Itemized individual (over $200): $5.7M (85.1%)Itemized individual (over $200): $5.7M (85.1%)Itemized individual (over $200): $5.7M (85.1%)Itemized individual (over $200): $5.7M (85.1%)Itemized individual (over $200): $5.7M (85.1%)Itemized individual (over $200): $5.7M (85.1%)Itemized individual (over $200): $5.7M (85.1%)Itemized individual (over $200): $5.7M (85.1%)Itemized individual (over $200): $5.7M (85.1%)Itemized individual (over $200): $5.7M (85.1%)Itemized individual (over $200): $5.7M (85.1%)Itemized individual (over $200): $5.7M (85.1%)Itemized individual (over $200): $5.7M (85.1%)Itemized individual (over $200): $5.7M (85.1%)Itemized individual (over $200): $5.7M (85.1%)Itemized individual (over $200): $5.7M (85.1%)Itemized individual (over $200): $5.7M (85.1%)Itemized individual (over $200): $5.7M (85.1%)Itemized individual (over $200): $5.7M (85.1%)Itemized individual (over $200): $5.7M (85.1%)Itemized individual (over $200): $5.7M (85.1%)Itemized individual (over $200): $5.7M (85.1%)Itemized individual (over $200): $5.7M (85.1%)Itemized individual (over $200): $5.7M (85.1%)Itemized individual (over $200): $5.7M (85.1%)Itemized individual (over $200): $5.7M (85.1%)Itemized individual (over $200): $5.7M (85.1%)Itemized individual (over $200): $5.7M (85.1%)Itemized individual (over $200): $5.7M (85.1%)Itemized individual (over $200): $5.7M (85.1%)Itemized individual (over $200): $5.7M (85.1%)Itemized individual (over $200): $5.7M (85.1%)Itemized individual (over $200): $5.7M (85.1%)Itemized individual (over $200): $5.7M (85.1%)Itemized individual (over $200): $5.7M (85.1%)Itemized individual (over $200): $5.7M (85.1%)Itemized individual (over $200): $5.7M (85.1%)Itemized individual (over $200): $5.7M (85.1%)Itemized individual (over $200): $5.7M (85.1%)Itemized individual (over $200): $5.7M (85.1%)Itemized individual (over $200): $5.7M (85.1%)Itemized individual (over $200): $5.7M (85.1%)Itemized individual (over $200): $5.7M (85.1%)Itemized individual (over $200): $5.7M (85.1%)Itemized individual (over $200): $5.7M (85.1%)Itemized individual (over $200): $5.7M (85.1%)Itemized individual (over $200): $5.7M (85.1%)Itemized individual (over $200): $5.7M (85.1%)Itemized individual (over $200): $5.7M (85.1%)Unitemized individual (gifts of $200 or less): $614.6K (9.2%)Unitemized individual (gifts of $200 or less): $614.6K (9.2%)Unitemized individual (gifts of $200 or less): $614.6K (9.2%)Unitemized individual (gifts of $200 or less): $614.6K (9.2%)Unitemized individual (gifts of $200 or less): $614.6K (9.2%)Unitemized individual (gifts of $200 or less): $614.6K (9.2%)Unitemized individual (gifts of $200 or less): $614.6K (9.2%)Unitemized individual (gifts of $200 or less): $614.6K (9.2%)Unitemized individual (gifts of $200 or less): $614.6K (9.2%)PACs and other committees: $259.2K (3.9%)PACs and other committees: $259.2K (3.9%)PACs and other committees: $259.2K (3.9%)PACs and other committees: $259.2K (3.9%)Remainder not broken out in the FEC summary (transfers, loans, refunds): $118.5K (1.8%)Remainder not broken out in the FEC summary (transfers, loans, refunds): $118.5K (1.8%)
  • Itemized individual (over $200)85 squares$5.7M
  • Unitemized individual (gifts of $200 or less)9 squares$614.6K
  • PACs and other committees4 squares$259.2K
  • Remainder not broken out in the FEC summary (transfers, loans, refunds)2 squares$118.5K
Show the data
Sources of Moulton's money, 2026 cycle, one square per percent
SourceAmountShare
Itemized individual (over $200)$5.7M85.1%
Unitemized individual (gifts of $200 or less)$614.6K9.2%
PACs and other committees$259.2K3.9%
Remainder not broken out in the FEC summary (transfers, loans, refunds)$118.5K1.8%
What this means, and what it doesn’t

Totals say how much a campaign took in, not how it was spent, and they rise sharply when a seat is up for election; compare cycles with that in mind. The small-donor share understates small giving when a campaign itemizes gifts made through ActBlue or WinRed.

Receipts by cycle

Total receipts, 2020 to 2026. The grey line is the House Democrats’ median for 2026.

2020 cycle: $773.3K$773.3K20202022 cycle: $2.1M$2.1M20222024 cycle: $2.8M$2.8M20242026 cycle: $6.7M$6.7M2026House Democrats median $2.0M
Show the data
Moulton's receipts by cycle against the 2026 House Democrats median.
ItemValue
2020 cycle$773.3K
2022 cycle$2.1M
2024 cycle$2.8M
2026 cycle$6.7M

Top donor states, 2026

Itemized contributions by donor state. 49% came from Massachusetts.

  1. Massachusetts$3.0M
  2. New York$966.3K
  3. California$774.6K
  4. Florida$353.9K
  5. Texas$146.6K

Small donations

Gifts of $200 or less as a share of individual money, by cycle. The thin grey bar is the 2026 House Democrats’ median.

0%60%
Moulton
Median
2026
10%
13%
2024
20%
13%
2022
36%
13%
2020
10%
13%
Show the data
Small-donor share by cycle against the House Democrats median
RowMoultonMedian
2026 cycle10%13%
2024 cycle20%13%
2022 cycle36%13%
2020 cycle10%13%

Where itemized donors live

Individuals who gave more than $200, by donor state

Alaska: $500AKMaine: $9,355MEVermont: $7,025VTNew Hampshire: $46.3KNHWashington: $51.8KWAIdaho: $1,250IDMontana: $3,800MTNorth Dakota: no dataNDMinnesota: $8,590MNIllinois: $74.0KILWisconsin: $4,000WIMichigan: $2,976MINew York: $966.3KNYRhode Island: $14.4KRIMassachusetts: $3.0MMAOregon: $12.4KORNevada: $17.8KNVWyoming: $14.9KWYSouth Dakota: no dataSDIowa: $50IAIndiana: $500INOhio: $8,537OHPennsylvania: $36.4KPANew Jersey: $61.1KNJConnecticut: $83.7KCTCalifornia: $774.6KCAUtah: $9,000UTColorado: $11.4KCONebraska: no dataNEMissouri: $4,560MOKentucky: $1,000KYWest Virginia: $600WVVirginia: $105.1KVAMaryland: $99.6KMDDelaware: $1,000DEArizona: $6,000AZNew Mexico: $10.9KNMKansas: $3,000KSArkansas: $7,000ARTennessee: $8,100TNNorth Carolina: $16.7KNCSouth Carolina: $2,525SCDistrict of Columbia: $123.1KDCOklahoma: no dataOKLouisiana: $8,000LAMississippi: no dataMSAlabama: $250ALGeorgia: $14.2KGAHawaii: $4,750HITexas: $146.6KTXFlorida: $353.9KFL
Show the data
Moulton's itemized individual contributions by donor state, 2026 cycle
StateValue
Massachusetts$3.0M
New York$966.3K
California$774.6K
Florida$353.9K
Texas$146.6K
District of Columbia$123.1K
Virginia$105.1K
Maryland$99.6K
Connecticut$83.7K
Illinois$74.0K
New Jersey$61.1K
Washington$51.8K
New Hampshire$46.3K
Pennsylvania$36.4K
Nevada$17.8K
North Carolina$16.7K
Wyoming$14.9K
Rhode Island$14.4K
Georgia$14.2K
Oregon$12.4K
Colorado$11.4K
New Mexico$10.9K
Maine$9,355
Utah$9,000
Minnesota$8,590
Ohio$8,537
Tennessee$8,100
Louisiana$8,000
Vermont$7,025
Arkansas$7,000
Arizona$6,000
Hawaii$4,750
Missouri$4,560
Wisconsin$4,000
Montana$3,800
Kansas$3,000
Michigan$2,976
South Carolina$2,525
Idaho$1,250
Kentucky$1,000
Delaware$1,000
West Virginia$600
Alaska$500
Indiana$500
Alabama$250
Iowa$50
North DakotaNo data
South DakotaNo data
NebraskaNo data
OklahomaNo data
MississippiNo data
2,987

itemized donors

People who gave more than $200

49%

from Massachusetts

Of itemized individual dollars

How to read the map

Every state the same size. Darker states gave more itemized money; hatched states had no itemized donors; the outlined state is Massachusetts. Gifts of $200 or less carry no address and are left out.

Donors’ ideology

Distribution of itemized donors’ own CSIP scores

CSIP −1.50 to −1.25: 0.1%CSIP −1.25 to −1.00: 4.1%CSIP −1.00 to −0.75: 28%CSIP −0.75 to −0.50: 58%58%CSIP −0.50 to −0.25: 4.0%CSIP −0.25 to 0.00: 2.2%CSIP 0.00 to +0.25: 1.8%CSIP +0.25 to +0.50: 0.7%CSIP +0.50 to +0.75: 0.5%CSIP +0.75 to +1.00: 0.1%CSIP +1.00 to +1.25: 0.0%← More liberalMore conservative →0
Show the data
Ideology of Moulton's itemized donors in 2026, from −1.50 to +1.25: 28% between −1.00 and −0.75, 58% between −0.75 and −0.50.
ItemValue
CSIP −1.50 to −1.250.1%
CSIP −1.25 to −1.004.1%
CSIP −1.00 to −0.7528%
CSIP −0.75 to −0.5058%
CSIP −0.50 to −0.254.0%
CSIP −0.25 to 0.002.2%
CSIP 0.00 to +0.251.8%
CSIP +0.25 to +0.500.7%
CSIP +0.50 to +0.750.5%
CSIP +0.75 to +1.000.1%
CSIP +1.00 to +1.250.0%
How to read the columns

Donors who give to many candidates get their own CSIP score. Each column is the share of Moulton’s itemized money from donors in that part of the scale, blue left of 0 and red right of 0, deeper further out; Moulton’s own score is −0.83.

Top donor occupations

Itemized, 2026 cycle.

  1. NOT EMPLOYED$1.9M 1,076 donors
  2. ATTORNEY$327.2K 184 donors
  3. CEO$282.8K 98 donors
  4. INVESTOR$266.3K 74 donors
  5. FINANCE$236.7K 56 donors

Top committees

PAC and committee contributions, 2026 cycle.

  1. THE COUNCIL OF INSURANCE AGENTS & BROKERS POLITICAL ACTION COMMITTEE$10.0K
  2. VOTEVETS$10.0K
  3. INT'L ASSOCIATION OF BRIDGE, STRUCTURAL, ORNAMENTAL AND REINFORCING IRON WORKERS (IPAL)$7,500
  4. HONEYWELL INTERNATIONAL INC. TECHNOLOGIES PUBLIC AFFAIRS COUNCIL (HONPAC)$7,000
  5. EMPLOYEES OF NORTHROP GRUMMAN CORPORATION PAC$6,000

Top employers

Itemized, 2026 cycle.

  1. FIDELITY INVESTMENTS$38.0K 27 donors
  2. BAIN CAPITAL$26.8K 8 donors
  3. HARVARD BUSINESS SCHOOL$26.0K 6 donors
  4. FRANCISCO PARTNERS$24.5K 4 donors
  5. HARVARD UNIVERSITY$22.6K 16 donors

Aggregates only. Individual donors are never named.

Back to topNext: Votes

Votes

Moulton voted with the majority of House Democrats on 97.8% of party-line votes and missed 15% of 674 roll calls. House Democrats on average: 96.4% party unity, 96.9% attendance. Across all roll calls, Moulton voted against the majority of House Democrats 14 times.

674 roll calls Moulton could vote on in the 119th Congress, compared with House Democrats. Attendance is the share with a vote recorded. Party unity counts only party-line roll calls, where most Democrats and most Republicans voted on opposite sides, and is the share of those where Moulton voted with the majority of House Democrats. The count of votes against that majority covers every roll call where the majority took a side.

14

votes against the majority of House Democrats

Party unity 97.8%, House Democrats average 96.4%, ranks 126th of 217. 674 roll calls in the 119th Congress.

Attendance and party unity

The thick bar is Moulton, the thin grey bar the House Democrats average. The scale runs from 80% to 100% to show the gap.

80%100%
Moulton
Peers
Rank
Attendance
85%
96.9%
214th of 217
Party unity
97.8%
96.4%
126th of 217
Show the data
Moulton's attendance and party unity against House Democrats.
RowMoultonPeers
Attendance85%96.9%
Party unity97.8%96.4%
What this means, and what it doesn’t

A missed roll call has many causes, from illness to campaigning, so attendance says how often, not why. A vote against the majority can be on procedure as well as substance, and many fall on roll calls where both parties split; the key votes below show the ones that decided something.

Key votes

25 roll calls the lab flagged as key in the 119th Congress

Key votes
Party split (yea–nay)Why it’s key
Sep 16, 2026
S. 2403
Retire through Ownership Act
On Motion to Suspend the Rules and Pass
YeaWith majorityPassedD 209–0 · R 191–14 · I 1–0Democrats 209 yea, 0 nay; Republicans 191 yea, 14 nay; Independents 1 yea, 0 naybecame law
Sep 16, 2026
H.J.Res. 213
Providing for congressional disapproval under chapter 8 of title 5, United States Code, of the rule issued by the Environmental Protection Agency relating to the “California State Nonroad Engine Pollution Control Standards; Commercial Harbor Craft Regulations; Notice of Decision”
On Passage
NayWith majorityPassedD 3–207 · R 210–1 · I 1–0Democrats 3 yea, 207 nay; Republicans 210 yea, 1 nay; Independents 1 yea, 0 nayclose vote
Sep 16, 2026
H.R. 10326
PROOF Act
On Passage
NayWith majorityPassedD 6–206 · R 210–1 · I 1–0Democrats 6 yea, 206 nay; Republicans 210 yea, 1 nay; Independents 1 yea, 0 nayclose vote
Sep 16, 2026
H.R. 9576
National Fraud Enforcement Division Act
On Passage
YeaWith majorityPassedD 139–72 · R 212–0 · I 1–0Democrats 139 yea, 72 nay; Republicans 212 yea, 0 nay; Independents 1 yea, 0 nayparty crossover
Sep 16, 2026
H.R. 5334
An Act to amend the Internal Revenue Code of 1986 to allow early childhood educators to take the educator expense deduction, and for other purposes
On Motion to Concur in the Senate Amendments
YeaAgainst majorityPassedD 58–152 · R 203–7 · I 1–0Democrats 58 yea, 152 nay; Republicans 203 yea, 7 nay; Independents 1 yea, 0 naybecame law · party crossover
How key votes are chosen

Automatically: a final-passage or override vote where the measure became law, the margin was under 10%, at least 10% of either party voted against its majority, or the bill was among the 25 most mentioned in officials’ own statements. Up to 25 per window, most recent first; five are shown. Bars show yea on the left, nay on the right, per party.

Votes most often with

The colleagues who voted the same way as Moulton most often

  1. Julia BrownleyD555 shared votes99%
  2. Melanie StansburyD561 shared votes99%
  3. Robert GarciaD546 shared votes98%
  4. Wesley BellD558 shared votes98%
  5. Shontel BrownD572 shared votes98%

Votes least often with

The colleagues who voted the same way as Moulton least often

  1. Chip RoyR537 shared votes15%
  2. Ralph NormanR523 shared votes16%
  3. Andy BiggsR518 shared votes16%
  4. Keith SelfR561 shared votes17%
  5. Eric BurlisonR550 shared votes17%
How to read the agreement lists

The share of roll calls both members voted on where they voted the same way, among colleagues sharing at least 50 such votes. High agreement with members of the other party is common on routine votes.

Full voting record

119th Congress (2025–27), loads in batches

Back to topNext: Legislation

Legislation

Moulton sponsored 22 bills in the 119th Congress; 1 became law. Cosponsored 694 others. 14% of sponsored bills got out of committee (House Democrats average 4.9%; 19th of 207).

The bills Moulton sponsored and cosponsored in the 119th Congress, from the official bill records, and how far each got: introduced, referred to or acted on in committee, passed one chamber, passed both, became law. A bill counts at every stage it has reached, so the blocks only shrink to the right.

Bills by stage

Counts for the 119th Congress

Sponsored22 billsSponsored, Introduced: 2222Sponsored, In committee: 2222Sponsored, Passed one chamber: 33Sponsored, Passed both chambers: 11Sponsored, Became law: 11Cosponsored694 billsCosponsored, Introduced: 694694Cosponsored, In committee: 694694Cosponsored, Passed one chamber: 2121Cosponsored, Passed both chambers: 33Cosponsored, Became law: 22IntroducedIncommitteePassed onechamberPassed bothchambersBecamelaw
Show the data
Bills Moulton sponsored and cosponsored, by furthest stage reached
RoleIntroducedIn committeePassed one chamberPassed both chambersBecame law
Sponsored2222311
Cosponsored6946942132
How to read the blocks

Ink blocks are bills Moulton sponsored, ochre blocks bills Moulton cosponsored; the figure above each block is the count. Most bills in any legislature never leave committee, so a short staircase is the norm.

14%

of sponsored bills got out of committee

House Democrats average 4.9%. Ranks 19th of 207.

Cosponsorship partners

Colleagues who most often cosponsor with Moulton, by number of shared bills in the 119th Congress; the square shows their party.

  1. Eleanor Norton117
  2. André Carson56
  3. Shri Thanedar53
  4. Rashida Tlaib50
  5. Hank Johnson Jr.39
What this means, and what it doesn’t

The score is the share of sponsored bills that a committee reported out or a chamber passed, with at least 5 sponsored bills, ranked within the peer group. Members of the majority party and committee chairs move more bills, so the rank reflects position in the chamber as well as effort. Cosponsorship partners are the five colleagues who share the most of Moulton’s bills; the toggle shows more.

Bill list

Sponsored and cosponsored, with status and policy area; five are shown, the toggle shows the rest

Bills sponsored and cosponsored
H.R. 10875To amend titles II and XVIII of the Social Security Act to lower the Medicare eligibility age to 50, and for other purposes.CosponsorOct 22, 2026In committeeUnassignedReferred to the Committee on Energy and Commerce, and in addition to the Committee on Ways and Means, for a period to be subsequently determined by the Speaker, in each case for consideration of such provisions as fall within the jurisdiction of the committee concerned. Oct 22, 2026
H.R. 10853Yemen TPS ActCosponsorOct 19, 2026In committeeUnassignedReferred to the House Committee on the Judiciary. Oct 19, 2026
H.R. 10774SWIMS Act of 2026CosponsorOct 9, 2026In committeeEnvironmental ProtectionReferred to the Committee on Natural Resources, and in addition to the Committee on Agriculture, for a period to be subsequently determined by the Speaker, in each case for consideration of such provisions as fall within the jurisdiction of the committee concerned. Oct 9, 2026
H.R. 10740To designate Ukraine under section 244 of the Immigration and Nationality Act to provide certain nationals of Ukraine with continued eligibility for temporary protected status, and for other purposes.CosponsorOct 5, 2026In committeeImmigrationReferred to the House Committee on the Judiciary. Oct 5, 2026
H.R. 10655VA Medicinal Cannabis Research Act of 2026CosponsorOct 1, 2026In committeeArmed Forces and National SecurityReferred to the House Committee on Veterans' Affairs. Oct 1, 2026

Back to topNext: Online

Online

A site that changed 76 times in 90 days. Moulton’s official site had 38 pages when last crawled on Oct 25, 2026. The lab last catalogued the images Moulton posted on Oct 23, 2026.

The lab crawls Moulton’s official and campaign websites (weekly for Congress, monthly for the states) and keeps every page’s text, so changes can be read later; it also records social accounts and describes the images Moulton posts with a vision model.

Websites

  • Official site

    moulton.house.gov

    Last crawled Oct 25, 2026

    38

    pages crawled

    76

    changes in 90 days

  • Campaign site

    sethmoulton.com

    Last crawled Oct 25, 2026

    21

    pages crawled

    90

    changes in 90 days

How to read the counts

“Pages crawled” is the size of the site at the last crawl; “changes in 90 days” counts pages whose text differed from the previous crawl. Sites change for many routine reasons, such as new press releases, so a high count is not by itself notable.

Images Moulton posted

The latest 24, with model-written descriptions

  • A political event poster featuring a man embracing a veteran in uniform. Large typography and a blue banner advertise a veterans town hall; additional event details appear near the bottom.
    A political event poster featuring a man embracing a veteran in uniform. Large typography and a blue banner advertise a veterans town hall; additional event details appear near the bottom.View post
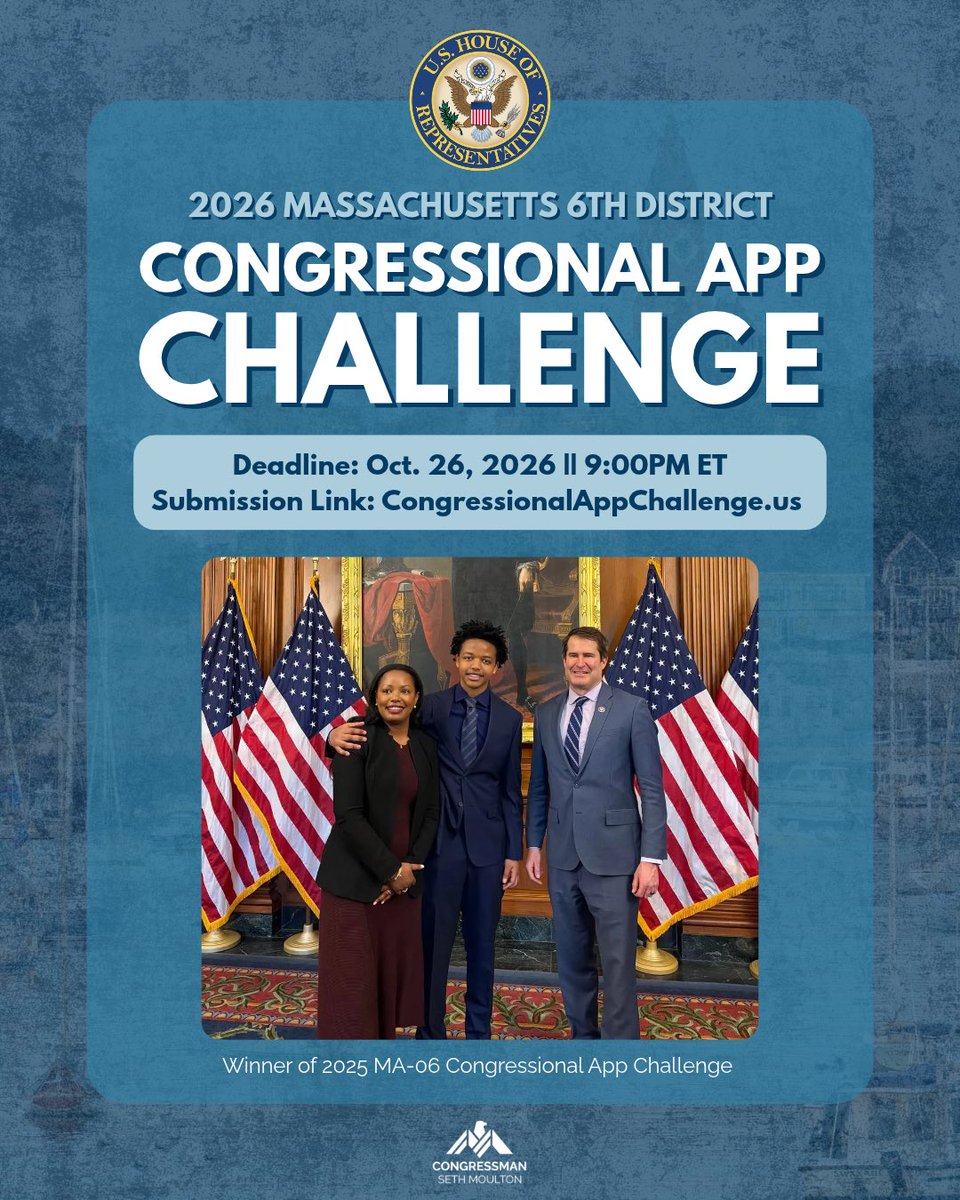
  • A blue promotional poster for a congressional app challenge, featuring the U.S. House of Representatives seal at the top and a photo of three people standing among American flags. There is text throughout the poster and a congressional office logo at the bottom.
    A blue promotional poster for a congressional app challenge, featuring the U.S. House of Representatives seal at the top and a photo of three people standing among American flags. There is text throughout the poster and a congressional office logo at the bottom.View post
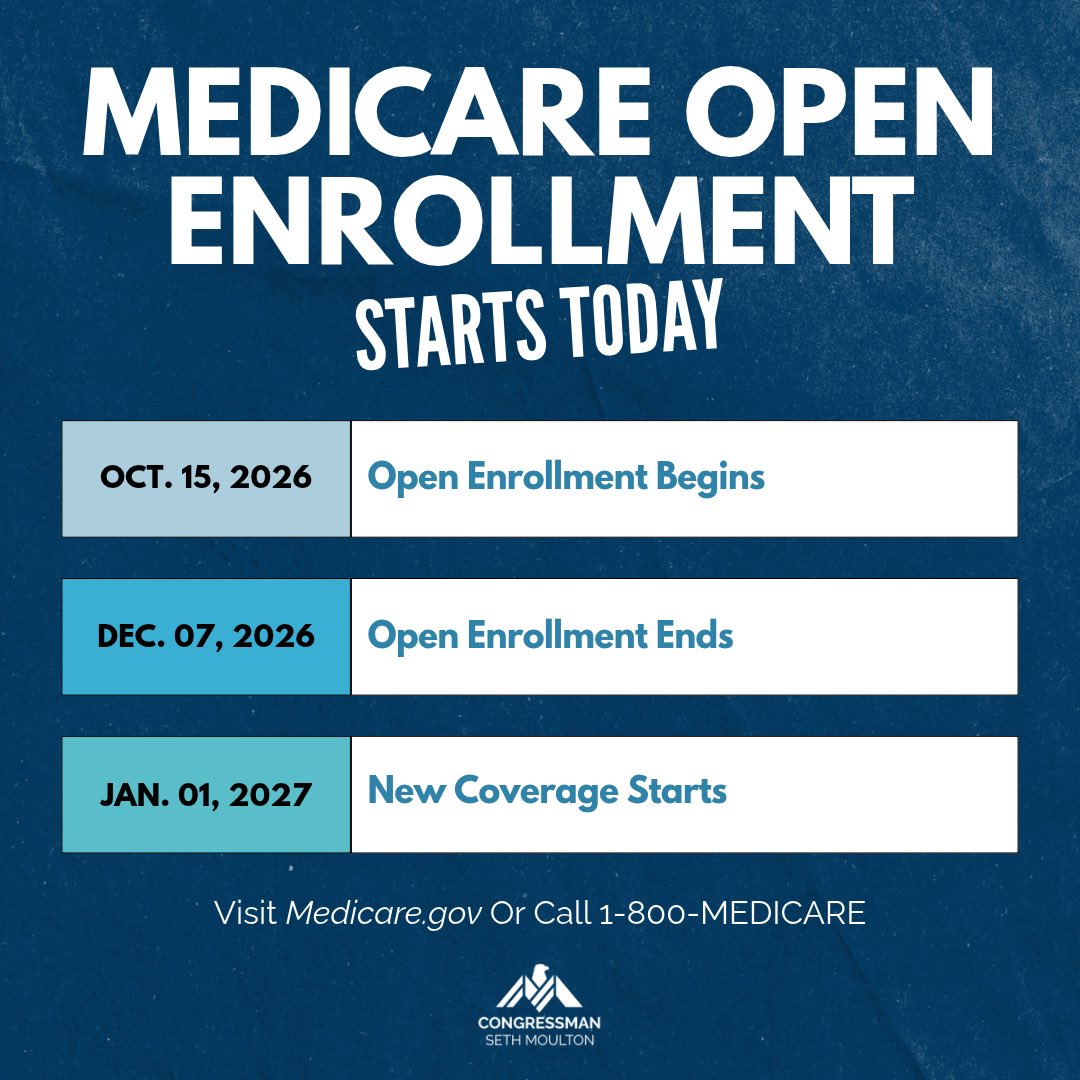
  • A blue informational graphic announcing Medicare open enrollment, with three date-and-event rows, contact information, and a congressman’s logo. It contains prominent text.
    A blue informational graphic announcing Medicare open enrollment, with three date-and-event rows, contact information, and a congressman’s logo. It contains prominent text.View post
  • A blue event poster shows a suited man shaking hands with a veteran outside a brick building, with other people nearby. The design includes a logo and prominent event and scheduling text.
    A blue event poster shows a suited man shaking hands with a veteran outside a brick building, with other people nearby. The design includes a logo and prominent event and scheduling text.View post
  • A blue event flyer decorated with triangular bunting and a torn-paper panel. It announces a service award ceremony, with event details and a campaign logo at the bottom.
    A blue event flyer decorated with triangular bunting and a torn-paper panel. It announces a service award ceremony, with event details and a campaign logo at the bottom.View post
About the descriptions

Written by a vision model and may be wrong. Open the post to see the original. Five are shown; the toggle shows the rest.

Back to topNext: Methods and sources

Methods and sources

How this page was made. Profile built Oct 28, 2026; site last built Oct 28, 2026. Every number on the page is computed from the sources listed here, by the same rules for every official; nothing is written by hand.

The headline

The headline is the measure on which Moulton is most unusual among House Democrats, chosen by one rule for every official of every party. The candidates are the rate of each kind of statement and of extreme labels, party unity, attendance, the small-donor share, the in-state share and total receipts of the latest cycle, the share of sponsored bills that got out of committee, talk-to-bills agreement, and the CSIP score’s place within the party group.

The builder ranks every measure within the same peer group the page compares it with, and writes each official’s percentile: the share of the group below the value, ties counting half, so 0.5 is the median and a value shared by many never ranks first. A measure’s score is how far that percentile sits from the median (0 in the middle, 0.5 at either end), and the highest score leads if it is above 0.25, outside the middle half of the group. Scores within 0.03 of each other are a tie, broken in this order: votes against the party majority, kinds of statement, ideology, roll calls missed, small donations, in-state money, legislation, agreement, extreme labels, receipts.

A measure counts only with at least 200 statements, 100 roll calls or 5 sponsored bills behind it and a peer group of at least 10. Two things never lead: high party unity or attendance, where most members sit, and a high rate of a kind of statement backed by fewer than 10 statements. When nothing qualifies, the headline is a neutral fact instead: statements classified, or years in office. The wording always names the direction (“in the bottom 5% of …”, “votes against the majority of …”).


Identifiers

Profile id
M001196
Bioguide
M001196
FEC candidate ids
H4MA06090, S6MA00296

Bulk files with the same data for every official:

Freshness of this profile’s data

  • What politicians sayOct 27, 20261 days agoMembers of Congress: tweets since 2017; press releases, newsletters and floor speeches since 2022. State legislators: tweets since May 2024. Governors: tweets since January 2025. Labels from an LLM classifier.
  • Roll calls (Congress)Sep 30, 202628 days agoVoteview roll calls, 113th Congress (2013) on.
  • Bills (Congress)Oct 22, 20266 days agoGovInfo BILLSTATUS: sponsors, cosponsors, actions, CRS policy area.
  • Campaign money (FEC)Oct 22, 20266 days agoFEC committee financial summaries (totals, small donations) and itemized contributions (donor counts, states, employers), cycles 2020-2026; aggregates only.
  • Ideology (CSIP)Oct 25, 20263 days agoCommon-Space Ideal Points (CSIP), current validated run.
  • WebsitesOct 25, 20263 days agoWeekly crawls of federal sites since April 2026; monthly state crawls since June 2026.
  • ImagesOct 28, 2026todayImages in members' tweets with vision-model descriptions.

How the measures work

What politicians say
Every post, press release, newsletter and congressional floor speech is read by a language model and marked for personal attacks, policy criticism, policy discussion, bipartisanship and credit claiming. A statement can be in several. Rates are shares of statements in the window. The methods paper.
Extreme labels
A statement has an extreme label when it calls a politician, party or policy “far left”, “far right”, “MAGA”, “extreme”, “radical”, “woke”, “fascist” or “communist”. The target is who the label is aimed at.
Policy areas and agreement
Statements and bills share 25 Congressional Research Service policy areas (state bills are assigned by a language model). Agreement is 1 − Jensen–Shannon distance between the two distributions, shown with at least 20 policy statements and 5 bills.
Ideology (CSIP)
Common-Space Ideal Points place federal and state officials on one left–right scale, estimated jointly from roll calls, campaign contributions and the text of statements, with standard errors. Only a validated run is shown. The methods paper.
Campaign money
Campaigns report by name only donors who give more than $200 in a cycle; smaller gifts are reported as one total. Federal totals and the small-donor share come from the FEC’s financial summaries of each campaign committee. Donor counts, donor states, employers and occupations cover itemized donors only. State filings report no small-gift totals, so state figures are itemized only. The lab never publishes donor names.
Votes and key votes
Attendance, party unity and the count of votes against the majority of an official’s own party come from roll calls (Voteview for Congress, chamber records for the states). Key votes are final-passage or override votes that became law, were decided by under 10%, saw at least 10% of a party vote against its majority, or concerned one of the 25 bills most mentioned in officials’ statements.
Peers and ranks
Comparisons are with the same party, chamber and level (for example House Democrats); state legislators are compared within their state and chamber for votes. Every comparison names its group. Rank 1 is the highest value in the group; tied values share the average of their ranks, and the percentile is the share of the group below the value, ties counting half.

America’s Political Pulse · Polarization Research Lab

Back to top