Skip to content

Democrat · U.S. House, North Carolina’s 2nd district

2024 presidential vote here Harris +33.9 (the district as drawn for 2024; The Downballot)Won 2024 with 66.3%, by 34.6 points

Serving since Jan 3, 2021119th Congress (2025–27)next election Nov 7, 2028

Bioguide R000305FEC H0NC02125

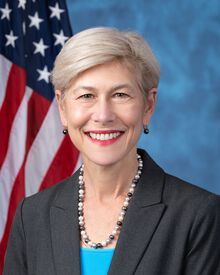
Portrait of Deborah Ross, rendered as a two-tone print
Official portrait
1.5×
the House Democrat rate of policy criticism

41% of 1,659 statements criticize a policy (675 statements); the average for House Democrats is 27%. Ranks 14th of 216, where 1st is the highest rate.

An AI model reads each of Ross’s Congressional Record speeches, press releases and posts on X and marks whether it criticizes a specific policy, law or ruling. The rate is the share of statements marked; it is compared with the average among House Democrats and ranked against the same group.

At a glance

6 measures against House Democrats. 0% of the 35 bills Ross sponsored got out of committee, in the bottom quarter of House Democrats. 78% of Ross’s statements discuss policy, in the top half of House Democrats (average 73%).

The measures on which Ross sits furthest from the middle of House Democrats, each against the same group, with the CSIP score when there is one. Every number is explained in its own section below.

Attendance

100%

House Democrats average 96.9% · ranks 10th of 217 · 687 roll calls

Policy criticism

41%

House Democrats average 27% · ranks 14th of 216

Out of committee

0%

House Democrats average 4.9% · ranks 173rd of 209

Policy discussion

78%

House Democrats average 73% · ranks 63rd of 216

Bipartisanship

11%

House Democrats average 9.7% · ranks 69th of 216

CSIP ideology

−1.08

Left of 0, the centre of the scale · ± 0.02

Peer group: House Democrats. Rank 1 is the highest value in the group; the thick bar is Ross, the thin grey bar the peer average. The headline is the measure on which Ross is most unusual among peers (Methods, §08).

The district at a glance

Congressional District 2 (119th Congress): the district as drawn for 2024

The district’s page

Of every 100 people

766,292 people (±4,116)

District

United States

North Carolina

Race and ethnicity, of every 100 people: district, North Carolina and the United States
GroupDistrictNorth CarolinaU.S.
White536057
Black232012
Hispanic or Latino131119
Asian636
Another race or more than one555

Hispanic or Latino people may be of any race; the other groups are not Hispanic.

Compared with the typical House district

Where it falls among the House districts: the centre rule is the median, the edges the lowest and the highest

← Lower than mostHigher than most →
Median household income
$92,500typical $78,700
Below the poverty line
9.8%typical 12%
Bachelor’s degree or moreadults 25 and over
54%typical 33%
Median age
36.5typical 39.1
Aged 65 and over
13%typical 17%
Born outside the U.S.
14%typical 10%
Veteranscivilian adults
5.4%typical 6.3%
Living in rural areas2020 Census
2.4%typical 15%
bottom 10%mediantop 10%
Show the data
Where it falls among the House districts
MeasureHere±The typical House districtPercentileStanding
Median household income$92,500±$1,581$78,70072higher than in 2 of every 3 House districts
Below the poverty line9.8%±0.512%26fewer than in 2 of every 3 House districts
Bachelor’s degree or more54%±0.833%94more than in 9 of every 10 House districts
Median age36.5±0.239.120lower than in 3 of every 4 House districts
Aged 65 and over13%±0.317%11fewer than in 3 of every 4 House districts
Born outside the U.S.14%±0.610%63near the middle of the House districts
Veterans5.4%±0.36.3%35near the middle of the House districts
Living in rural areas2.4%—15%28fewer than in 2 of every 3 House districts

Source: ACS 2020–2024 5-year estimates (Census Bureau); rural share from the 2020 Census.

About these figures

The figures from the American Community Survey are estimates from a sample, not a count. The ± beside each is its 90 percent margin of error: nine times in ten the true value lies within that range. In small districts the margins are wide, so a gap of a few points from North Carolina may be noise. Shares are of everyone in the district, except education (adults 25 and over), poverty (people whose poverty status is known) and veterans (civilian adults).

These are the Census Bureau’s own estimates for the district; margins on shares are approximated from the counts’ margins.

The rural share counts the people living outside the urban areas the Census Bureau drew from the 2020 Census; it is a count, with no margin of error.

Back to topNext: What politicians say

What Ross says

Ross criticizes policies more than 93% of House Democrats. Policy criticism in 41% of 1,659 statements, against 27% for the average House Democrat; 14th of 216.

An AI model reads each of Ross’s 1,659 statements in the 119th Congress (1,401 posts on X, 207 press releases, 51 Congressional Record speeches) and marks the kinds of statement it contains: a personal attack, criticism of a policy, discussion of policy, bipartisanship, credit claiming, and extreme labels. A statement can carry several. Every rate is compared with the average for House Democrats and ranked among them.

Kinds of statement

Share of statements carrying each label, the 119th Congress

0%80%
Ross
Peers
Rank
Policy discussion1,291 statements
78%
73%
63rd of 216
Policy criticism675 statements
41%
27%
14th of 216
Credit claiming376 statements
23%
23%
103rd of 216
Bipartisanship177 statements
11%
10%
69th of 216
Personal attacks102 statements
6%
7%
97th of 216
Show the data
Ross's share of statements in each category against the House Democrats average.
RowRossPeers
Policy discussion78%73%
Policy criticism41%27%
Credit claiming23%23%
Bipartisanship11%10%
Personal attacks6%7%
1,659

statements classified

1,401 posts on X, 207 press releases, 51 Congressional Record speeches.

posts on X: 1,401 (84.4%)posts on X 1,401press releases: 207 (12.5%)Congressional Record speeches: 51 (3.1%)
Show the data
Ross's statements by source
PartValue
posts on X1,401
press releases207
Congressional Record speeches51
How to read the bars

The thick bar is Ross, in the colour of that kind of statement; the thin grey bar is the average House Democrats. A longer thick bar means Ross does this more than peers. Rank 1 is the highest rate in the group.

Extreme labels

Ross used extreme labels in 1.5% of statements, below the peer average. 24 statements, most often aimed at Republicans; peers 1.9%.

  1. “extreme”19
  2. “MAGA”2
  3. “far right”1
  4. “fascist”1

Who gets the labels

Targets named alongside an extreme label, by number of statements

  1. Republicans3
  2. Trump3
  3. Republican budget2
  4. abortion bans1
  5. birthright citizenship1
What an extreme label is

Calls a politician, a party or a policy “far left”, “far right”, “MAGA”, “extreme”, “radical”, “woke”, “fascist” or “communist”. The target is who or what the label was aimed at. The lists show the five most used labels and targets; the toggle shows the rest.

Month by month

Share of statements per month, the 119th Congress

Statements2025-01: 972025-02: 1102025-03: 1092025-04: 1092025-05: 1012025-06: 932025-07: 992025-08: 782025-09: 962025-10: 1102025-11: 532025-12: 462026-01: 612026-02: 582026-03: 592026-04: 722026-05: 552026-06: 682026-07: 402026-08: 312026-09: 332026-10: 452026-11: 36peak 110 · Feb ’25Personal attackspeak 11.1% · Apr ’26 · latest 2.8%Personal attacks, 2025-01: 8.3% of 97Personal attacks, 2025-02: 10.9% of 110Personal attacks, 2025-03: 3.7% of 109Personal attacks, 2025-04: 11.0% of 109Personal attacks, 2025-05: 3.0% of 101Personal attacks, 2025-06: 1.1% of 93Personal attacks, 2025-07: 10.1% of 99Personal attacks, 2025-08: 0.0% of 78Personal attacks, 2025-09: 2.1% of 96Personal attacks, 2025-10: 3.6% of 110Personal attacks, 2025-11: 1.9% of 53Personal attacks, 2025-12: 6.5% of 46Personal attacks, 2026-01: 8.2% of 61Personal attacks, 2026-02: 6.9% of 58Personal attacks, 2026-03: 5.1% of 59Personal attacks, 2026-04: 11.1% of 72Personal attacks, 2026-05: 10.9% of 55Personal attacks, 2026-06: 10.3% of 68Personal attacks, 2026-07: 7.5% of 40Personal attacks, 2026-08: 6.5% of 31Personal attacks, 2026-09: 9.1% of 33Personal attacks, 2026-10: 0.0% of 45Personal attacks, 2026-11: 2.8% of 36Policy criticismpeak 56.6% · Jul ’25 · latest 5.6%Policy criticism, 2025-01: 28.9% of 97Policy criticism, 2025-02: 48.2% of 110Policy criticism, 2025-03: 45.0% of 109Policy criticism, 2025-04: 46.8% of 109Policy criticism, 2025-05: 44.5% of 101Policy criticism, 2025-06: 52.7% of 93Policy criticism, 2025-07: 56.6% of 99Policy criticism, 2025-08: 55.1% of 78Policy criticism, 2025-09: 43.8% of 96Policy criticism, 2025-10: 56.4% of 110Policy criticism, 2025-11: 35.9% of 53Policy criticism, 2025-12: 39.1% of 46Policy criticism, 2026-01: 26.2% of 61Policy criticism, 2026-02: 37.9% of 58Policy criticism, 2026-03: 47.5% of 59Policy criticism, 2026-04: 19.4% of 72Policy criticism, 2026-05: 38.2% of 55Policy criticism, 2026-06: 38.2% of 68Policy criticism, 2026-07: 22.5% of 40Policy criticism, 2026-08: 19.4% of 31Policy criticism, 2026-09: 21.2% of 33Policy criticism, 2026-10: 20.0% of 45Policy criticism, 2026-11: 5.6% of 36Policy discussionpeak 95.1% · Jan ’26 · latest 66.7%Policy discussion, 2025-01: 65.0% of 97Policy discussion, 2025-02: 73.6% of 110Policy discussion, 2025-03: 73.4% of 109Policy discussion, 2025-04: 80.7% of 109Policy discussion, 2025-05: 82.2% of 101Policy discussion, 2025-06: 85.0% of 93Policy discussion, 2025-07: 81.8% of 99Policy discussion, 2025-08: 89.7% of 78Policy discussion, 2025-09: 78.1% of 96Policy discussion, 2025-10: 74.6% of 110Policy discussion, 2025-11: 62.3% of 53Policy discussion, 2025-12: 71.7% of 46Policy discussion, 2026-01: 95.1% of 61Policy discussion, 2026-02: 65.5% of 58Policy discussion, 2026-03: 74.6% of 59Policy discussion, 2026-04: 84.7% of 72Policy discussion, 2026-05: 76.4% of 55Policy discussion, 2026-06: 69.1% of 68Policy discussion, 2026-07: 80.0% of 40Policy discussion, 2026-08: 93.5% of 31Policy discussion, 2026-09: 84.9% of 33Policy discussion, 2026-10: 88.9% of 45Policy discussion, 2026-11: 66.7% of 36Bipartisanshippeak 23.9% · Dec ’25 · latest 5.6%Bipartisanship, 2025-01: 17.5% of 97Bipartisanship, 2025-02: 5.5% of 110Bipartisanship, 2025-03: 3.7% of 109Bipartisanship, 2025-04: 11.9% of 109Bipartisanship, 2025-05: 7.9% of 101Bipartisanship, 2025-06: 14.0% of 93Bipartisanship, 2025-07: 11.1% of 99Bipartisanship, 2025-08: 6.4% of 78Bipartisanship, 2025-09: 18.8% of 96Bipartisanship, 2025-10: 7.3% of 110Bipartisanship, 2025-11: 15.1% of 53Bipartisanship, 2025-12: 23.9% of 46Bipartisanship, 2026-01: 8.2% of 61Bipartisanship, 2026-02: 12.1% of 58Bipartisanship, 2026-03: 13.6% of 59Bipartisanship, 2026-04: 11.1% of 72Bipartisanship, 2026-05: 10.9% of 55Bipartisanship, 2026-06: 7.3% of 68Bipartisanship, 2026-07: 20.0% of 40Bipartisanship, 2026-08: 6.5% of 31Bipartisanship, 2026-09: 6.1% of 33Bipartisanship, 2026-10: 4.4% of 45Bipartisanship, 2026-11: 5.6% of 36Credit claimingpeak 41.2% · Jan ’25 · latest 11.1%Credit claiming, 2025-01: 41.2% of 97Credit claiming, 2025-02: 16.4% of 110Credit claiming, 2025-03: 17.4% of 109Credit claiming, 2025-04: 22.9% of 109Credit claiming, 2025-05: 20.8% of 101Credit claiming, 2025-06: 20.4% of 93Credit claiming, 2025-07: 26.3% of 99Credit claiming, 2025-08: 24.4% of 78Credit claiming, 2025-09: 22.9% of 96Credit claiming, 2025-10: 10.9% of 110Credit claiming, 2025-11: 24.5% of 53Credit claiming, 2025-12: 34.8% of 46Credit claiming, 2026-01: 24.6% of 61Credit claiming, 2026-02: 17.2% of 58Credit claiming, 2026-03: 25.4% of 59Credit claiming, 2026-04: 29.2% of 72Credit claiming, 2026-05: 34.5% of 55Credit claiming, 2026-06: 19.1% of 68Credit claiming, 2026-07: 37.5% of 40Credit claiming, 2026-08: 12.9% of 31Credit claiming, 2026-09: 15.2% of 33Credit claiming, 2026-10: 11.1% of 45Credit claiming, 2026-11: 11.1% of 36Extreme labelspeak 5.0% · Jul ’26 · latest 0.0%Extreme labels, 2025-01: 1.0% of 97Extreme labels, 2025-02: 0.9% of 110Extreme labels, 2025-03: 0.9% of 109Extreme labels, 2025-04: 3.7% of 109Extreme labels, 2025-05: 3.0% of 101Extreme labels, 2025-06: 1.1% of 93Extreme labels, 2025-07: 1.0% of 99Extreme labels, 2025-08: 0.0% of 78Extreme labels, 2025-09: 1.0% of 96Extreme labels, 2025-10: 0.0% of 110Extreme labels, 2025-11: 0.0% of 53Extreme labels, 2025-12: 0.0% of 46Extreme labels, 2026-01: 1.6% of 61Extreme labels, 2026-02: 1.7% of 58Extreme labels, 2026-03: 3.4% of 59Extreme labels, 2026-04: 0.0% of 72Extreme labels, 2026-05: 3.6% of 55Extreme labels, 2026-06: 2.9% of 68Extreme labels, 2026-07: 5.0% of 40Extreme labels, 2026-08: 0.0% of 31Extreme labels, 2026-09: 3.0% of 33Extreme labels, 2026-10: 0.0% of 45Extreme labels, 2026-11: 0.0% of 36Jan ’25Jul ’25Jan ’26Jul ’26Nov ’26
Show the data
Monthly rates for Ross, each row shaded against its own peak, with statement volume. Months with fewer than 10 statements are left blank.
ColumnStatementsPersonal attacksPolicy criticismPolicy discussionBipartisanshipCredit claimingExtreme labels
Jan ’25978.3%28.9%65.0%17.5%41.2%1.0%
Feb ’2511010.9%48.2%73.6%5.5%16.4%0.9%
Mar ’251093.7%45.0%73.4%3.7%17.4%0.9%
Apr ’2510911.0%46.8%80.7%11.9%22.9%3.7%
May ’251013.0%44.5%82.2%7.9%20.8%3.0%
Jun ’25931.1%52.7%85.0%14.0%20.4%1.1%
Jul ’259910.1%56.6%81.8%11.1%26.3%1.0%
Aug ’25780.0%55.1%89.7%6.4%24.4%0.0%
Sep ’25962.1%43.8%78.1%18.8%22.9%1.0%
Oct ’251103.6%56.4%74.6%7.3%10.9%0.0%
Nov ’25531.9%35.9%62.3%15.1%24.5%0.0%
Dec ’25466.5%39.1%71.7%23.9%34.8%0.0%
Jan ’26618.2%26.2%95.1%8.2%24.6%1.6%
Feb ’26586.9%37.9%65.5%12.1%17.2%1.7%
Mar ’26595.1%47.5%74.6%13.6%25.4%3.4%
Apr ’267211.1%19.4%84.7%11.1%29.2%0.0%
May ’265510.9%38.2%76.4%10.9%34.5%3.6%
Jun ’266810.3%38.2%69.1%7.3%19.1%2.9%
Jul ’26407.5%22.5%80.0%20.0%37.5%5.0%
Aug ’26316.5%19.4%93.5%6.5%12.9%0.0%
Sep ’26339.1%21.2%84.9%6.1%15.2%3.0%
Oct ’26450.0%20.0%88.9%4.4%11.1%0.0%
Nov ’26362.8%5.6%66.7%5.6%11.1%0.0%
How to read the strips

Each row is one kind of statement; each cell is a month, shaded against that row’s own peak (darker = closer to the peak), with the peak and the latest value written at the right. The top row counts statements. The strip covers every month of the 119th Congress, the same span as the rates above, including months with no statements. A month with fewer than 10 statements is hatched, not shaded: one or two posts would swing its rate to 0% or 100%.

In Ross’s words

Real statements from the classifier’s example set, with the labels it assigned

Bipartisanship

Representatives Ross, Joyce Reintroduce Bipartisan Bill to Bolster Support for Police, First Responders Struggling with PTSD WASHINGTON, D.C. — Today, Congresswoman Deborah Ross (NC-02) and Congressman Dave Joyce (OH-14) introduced the Fighting Post-Traumatic Stress Disorder Act. This bipartisan, b…

Nov 18, 2026 · Press releases · policy discussion; bipartisanship; credit claiming; Health; Crime and Law Enforcement · Source

Policy criticism

The text of this post is on X; follow the source link to read it.

Nov 12, 2026 · Posts on X · policy criticism; policy discussion; Armed Forces and National Security; International Affairs; Energy · Source

Extreme label

Congresswoman Ross Calls Out Trump Administration’s Corrupt Offshore Wind Buyouts Watch a recording of the press conference HERE. Washington, D.C. – Today, Congresswoman Ross joined fellow members of Congress, labor leaders, and environmental advocates in front of the Capitol to call out the Trump…

Sep 17, 2026 · Press releases · policy discussion; Energy; Environmental Protection; Economics and Public Finance; Labor and Employment; extreme label “extreme” aimed at federal overreach · Source

Examples by category

Up to five recent statements in each category

Category

Overtly questions a named person’s character, integrity or loyalty, or calls them names. Criticising a record or a policy does not count.

  1. Posts on X

    The text of this post is on X; follow the source link to read it.

    personal attacks · target: TrumpSource

  2. Posts on X

    The text of this post is on X; follow the source link to read it.

    personal attacks · policy discussion · Armed Forces and National Security · target: Donald Trump, Pete HegsethSource

  3. Posts on X

    The text of this post is on X; follow the source link to read it.

    personal attacks · target: TrumpSource

  4. Press releases

    Congresswoman Ross Statement on Voting to Censure Chuck Edwards Washington, D.C. — Today, Congresswoman Deborah Ross (NC-02), member of the House Ethics Committee, voted to censure Congressman Chuck Edwards (NC-11) in the U.S. House of Representatives. The vote follows a comprehensive report released by the House Ethics Committee detailing a pattern of unprofessional and inappropriate conduct by Congressman Edwards toward his female staff members. “After a thorough, bipartisan investigation, it is clear that Chuck Edwards repeatedly displayed unprofessional behavior toward women on his staff,

    personal attacks · policy discussion · bipartisanship · Government Operations and Politics · target: Chuck EdwardsSource

  5. Posts on X

    The text of this post is on X; follow the source link to read it.

    personal attacks · policy discussion · Government Operations and Politics · target: Todd BlancheSource

All 1,659 statements

Newest first, the 119th Congress

The full feed

Five statements at a time, newest first; filters apply to the statements loaded so far. Export saves the statements that match. Sources: 1,401 posts on X, 207 press releases, 51 Congressional Record speeches.

Back to topNext: Policy

Policy

Health is what Ross talks about most: 27% of policy statements. Talk and legislation agree at 0.68 on a 0–1 scale (House Democrats average 0.67; 115th of 216).

Each policy statement is tagged by the AI model with one or more of 25 policy areas from the Congressional Research Service list, so the shares say what Ross talks about. The bills Ross sponsors and cosponsors carry the same areas, so the two can be compared.

What Ross talks about

Share of policy statements by area, the 119th Congress

0%35%
Ross
Peers
Health346 statements
27%
25%
Government Operations and Politics243 statements
19%
20%
Economics and Public Finance238 statements
18%
20%
Civil Rights and Liberties, Minority Issues137 statements
11%
13%
Armed Forces and National Security133 statements
10%
16%
Show the data
Policy areas Ross talks about, as a share of policy statements, against the House Democrats average.
RowRossPeers
Health27%25%
Government Operations and Politics19%20%
Economics and Public Finance18%20%
Civil Rights and Liberties, Minority Issues11%13%
Armed Forces and National Security10%16%
How to read the bars

The thick bar is the share of Ross’s policy statements in an area; the thin grey bar is the average share for House Democrats. A statement counts once in each of its areas, so shares can add to more than 100%. The five largest areas are shown; the toggle shows the rest.

Talks about · legislates on

Left: share of statements by policy area. Right: share of bills. Areas in order of their share of statements; both sides run from 0 to 35%. Grey ticks are the House Democrats averages.

Talks aboutLegislates onHealthHealth, talks about: 27% (House Democrats 25%)27%Health, legislates on: 23% (House Democrats 16%)23%Government Operations andPoliticsGovernment Operations and Politics, talks about: 19% (House Democrats 20%)19%Government Operations and Politics, legislates on: 7% (House Democrats 11%)7%Economics and Public FinanceEconomics and Public Finance, talks about: 18% (House Democrats 20%)18%Economics and Public Finance, legislates on: 0% (House Democrats 1%)0%Civil Rights and Liberties,Minority IssuesCivil Rights and Liberties, Minority Issues, talks about: 11% (House Democrats 13%)11%Civil Rights and Liberties, Minority Issues, legislates on: 3% (House Democrats 5%)3%Armed Forces and NationalSecurityArmed Forces and National Security, talks about: 10% (House Democrats 16%)10%Armed Forces and National Security, legislates on: 6% (House Democrats 7%)6%
Show the data
Ross's share of statements against share of bills in each policy area.
AreaTalks aboutHouse Democrats, talks aboutLegislates onHouse Democrats, legislates on
Health27%25%23%16%
Government Operations and Politics19%20%7%11%
Economics and Public Finance18%20%0%1%
Civil Rights and Liberties, Minority Issues11%13%3%5%
Armed Forces and National Security10%16%6%7%
0.68

talk-to-bills agreement, 0 to 1

House Democrats average 0.67. Ranks 115th of 216.

What agreement means, and what it doesn’t

Agreement is 1 minus the distance between the two distributions (Jensen–Shannon): 1 means Ross legislates on exactly the areas Ross talks about, in the same proportions; 0 means no overlap. It does not say whether the bills match the positions in the statements, only the subjects. Bills Ross sponsored count fully, cosponsored bills a quarter. Shown with at least 20 policy statements and 5 bills.

Back to topNext: Ideology

Ideology

Ross sits at −1.08 on the CSIP scale, left of 0, more liberal than 62% of House Democrats. Approximate range −1.09 to −1.06, which understates the uncertainty; from 2,754 donors and 2,875 roll calls.

CSIP, the lab’s Common-Space Ideal Point, places every official, federal and state, on one left–right scale, estimated from roll-call votes, who gives money to whom, and the text of statements. Negative is left of 0, positive right of it; 0 is the centre of the scale, not a definition of “moderate”.

−1.08

CSIP ideal point

Approximate range −1.09 to −1.06. From 2,754 donors and 2,875 roll calls. Run 2026-11-03T100151. Blue is left of 0, red right of 0.

← More liberalMore conservative →0Ross −1.1House Democrats −1.0All House +0.4

The outlined dot is Ross, coloured by its side of 0 (blue left, red right, deeper further out); the bar through it is the approximate range (±1.96 standard errors), which understates the uncertainty; the grey ticks below are the medians of Ross’s groups. 0 is the centre of the scale, not “moderate” by definition.

What this means, and what it doesn’t

The score summarises how an official votes, who funds them and how they talk, relative to everyone else. It does not grade positions as good or bad, and two officials with the same score can differ on any single issue. The ± range is 1.96 standard errors, which understates the uncertainty: scores whose ranges overlap may not differ at all, and even scores whose ranges do not overlap may not differ.

Where Ross sits

Every official in each group, on the CSIP scale

−2.0−1.00.0+1.0+2.0← More liberalMore conservative →House Democratsmedian −1.0Ross −1.1All Housemedian +0.4
Show the data
Ross's CSIP score of −1.08 placed against House Democrats, All House.
GroupOfficialsMedianShare left of Ross
House Democrats217−1.037%
All House439+0.418%
How to read the strips

Every small dot is one official on the same scale, coloured by its own score (blue left of 0, red right of 0, grey at 0, deeper further out) and spread up and down only to keep dots apart; where a group is crowded the dots overlap, and darker patches mean more officials. The large outlined dot is Ross in every row; the rule is each group’s median. The table under the figure gives the share of each group to the left of Ross.

Back to topNext: Money

Money

Ross raised $2.0M in the 2026 cycle, close to the House Democrats’ median of $2.0M. 7.1% of individual money came in gifts of $200 or less. 71% of itemized individual money came from North Carolina.

Campaign money from Federal Election Commission filings, as aggregates only; the lab never shows an individual donor. Campaigns must report by name every person who gives them more than $200 in a cycle (“itemized”); smaller gifts are reported only as one total (“unitemized”), so donor counts, donor states, employers and occupations describe itemized donors only.

Election cycle
$2.0M

raised in the 2026 cycle

From 826 itemized donors. House Democrats’ median $2.0M.

Where the money came from

Each square is one percent of 2026-cycle receipts, from FEC summary totals.

Itemized individual (over $200): $1.1M (53.1%)Itemized individual (over $200): $1.1M (53.1%)Itemized individual (over $200): $1.1M (53.1%)Itemized individual (over $200): $1.1M (53.1%)Itemized individual (over $200): $1.1M (53.1%)Itemized individual (over $200): $1.1M (53.1%)Itemized individual (over $200): $1.1M (53.1%)Itemized individual (over $200): $1.1M (53.1%)Itemized individual (over $200): $1.1M (53.1%)Itemized individual (over $200): $1.1M (53.1%)Itemized individual (over $200): $1.1M (53.1%)Itemized individual (over $200): $1.1M (53.1%)Itemized individual (over $200): $1.1M (53.1%)Itemized individual (over $200): $1.1M (53.1%)Itemized individual (over $200): $1.1M (53.1%)Itemized individual (over $200): $1.1M (53.1%)Itemized individual (over $200): $1.1M (53.1%)Itemized individual (over $200): $1.1M (53.1%)Itemized individual (over $200): $1.1M (53.1%)Itemized individual (over $200): $1.1M (53.1%)Itemized individual (over $200): $1.1M (53.1%)Itemized individual (over $200): $1.1M (53.1%)Itemized individual (over $200): $1.1M (53.1%)Itemized individual (over $200): $1.1M (53.1%)Itemized individual (over $200): $1.1M (53.1%)Itemized individual (over $200): $1.1M (53.1%)Itemized individual (over $200): $1.1M (53.1%)Itemized individual (over $200): $1.1M (53.1%)Itemized individual (over $200): $1.1M (53.1%)Itemized individual (over $200): $1.1M (53.1%)Itemized individual (over $200): $1.1M (53.1%)Itemized individual (over $200): $1.1M (53.1%)Itemized individual (over $200): $1.1M (53.1%)Itemized individual (over $200): $1.1M (53.1%)Itemized individual (over $200): $1.1M (53.1%)Itemized individual (over $200): $1.1M (53.1%)Itemized individual (over $200): $1.1M (53.1%)Itemized individual (over $200): $1.1M (53.1%)Itemized individual (over $200): $1.1M (53.1%)Itemized individual (over $200): $1.1M (53.1%)Itemized individual (over $200): $1.1M (53.1%)Itemized individual (over $200): $1.1M (53.1%)Itemized individual (over $200): $1.1M (53.1%)Itemized individual (over $200): $1.1M (53.1%)Itemized individual (over $200): $1.1M (53.1%)Itemized individual (over $200): $1.1M (53.1%)Itemized individual (over $200): $1.1M (53.1%)Itemized individual (over $200): $1.1M (53.1%)Itemized individual (over $200): $1.1M (53.1%)Itemized individual (over $200): $1.1M (53.1%)Itemized individual (over $200): $1.1M (53.1%)Itemized individual (over $200): $1.1M (53.1%)Itemized individual (over $200): $1.1M (53.1%)Unitemized individual (gifts of $200 or less): $82.8K (4.1%)Unitemized individual (gifts of $200 or less): $82.8K (4.1%)Unitemized individual (gifts of $200 or less): $82.8K (4.1%)Unitemized individual (gifts of $200 or less): $82.8K (4.1%)PACs and other committees: $837.5K (41.1%)PACs and other committees: $837.5K (41.1%)PACs and other committees: $837.5K (41.1%)PACs and other committees: $837.5K (41.1%)PACs and other committees: $837.5K (41.1%)PACs and other committees: $837.5K (41.1%)PACs and other committees: $837.5K (41.1%)PACs and other committees: $837.5K (41.1%)PACs and other committees: $837.5K (41.1%)PACs and other committees: $837.5K (41.1%)PACs and other committees: $837.5K (41.1%)PACs and other committees: $837.5K (41.1%)PACs and other committees: $837.5K (41.1%)PACs and other committees: $837.5K (41.1%)PACs and other committees: $837.5K (41.1%)PACs and other committees: $837.5K (41.1%)PACs and other committees: $837.5K (41.1%)PACs and other committees: $837.5K (41.1%)PACs and other committees: $837.5K (41.1%)PACs and other committees: $837.5K (41.1%)PACs and other committees: $837.5K (41.1%)PACs and other committees: $837.5K (41.1%)PACs and other committees: $837.5K (41.1%)PACs and other committees: $837.5K (41.1%)PACs and other committees: $837.5K (41.1%)PACs and other committees: $837.5K (41.1%)PACs and other committees: $837.5K (41.1%)PACs and other committees: $837.5K (41.1%)PACs and other committees: $837.5K (41.1%)PACs and other committees: $837.5K (41.1%)PACs and other committees: $837.5K (41.1%)PACs and other committees: $837.5K (41.1%)PACs and other committees: $837.5K (41.1%)PACs and other committees: $837.5K (41.1%)PACs and other committees: $837.5K (41.1%)PACs and other committees: $837.5K (41.1%)PACs and other committees: $837.5K (41.1%)PACs and other committees: $837.5K (41.1%)PACs and other committees: $837.5K (41.1%)PACs and other committees: $837.5K (41.1%)PACs and other committees: $837.5K (41.1%)Remainder not broken out in the FEC summary (transfers, loans, refunds): $33.4K (1.6%)Remainder not broken out in the FEC summary (transfers, loans, refunds): $33.4K (1.6%)
  • Itemized individual (over $200)53 squares$1.1M
  • Unitemized individual (gifts of $200 or less)4 squares$82.8K
  • PACs and other committees41 squares$837.5K
  • Party committees$3,613
  • Remainder not broken out in the FEC summary (transfers, loans, refunds)2 squares$33.4K
Show the data
Sources of Ross's money, 2026 cycle, one square per percent
SourceAmountShare
Itemized individual (over $200)$1.1M53.1%
Unitemized individual (gifts of $200 or less)$82.8K4.1%
PACs and other committees$837.5K41.1%
Party committees$3,6130.2%
Remainder not broken out in the FEC summary (transfers, loans, refunds)$33.4K1.6%
What this means, and what it doesn’t

Totals say how much a campaign took in, not how it was spent, and they rise sharply when a seat is up for election; compare cycles with that in mind. The small-donor share understates small giving when a campaign itemizes gifts made through ActBlue or WinRed.

Receipts by cycle

Total receipts, 2020 to 2026. The grey line is the House Democrats’ median for 2026.

2020 cycle: $2.2M$2.2M20202022 cycle: $2.1M$2.1M20222024 cycle: $1.9M$1.9M20242026 cycle: $2.0M$2.0M2026House Democrats median $2.0M
Show the data
Ross's receipts by cycle against the 2026 House Democrats median.
ItemValue
2020 cycle$2.2M
2022 cycle$2.1M
2024 cycle$1.9M
2026 cycle$2.0M

Top donor states, 2026

Itemized contributions by donor state. 71% came from North Carolina.

  1. North Carolina$631.3K
  2. California$74.8K
  3. New York$34.4K
  4. Florida$20.7K
  5. Virginia$11.7K

Small donations

Gifts of $200 or less as a share of individual money, by cycle. The thin grey bar is the 2026 House Democrats’ median.

0%60%
Ross
Median
2026
7%
13%
2024
11%
13%
2022
13%
13%
2020
19%
13%
Show the data
Small-donor share by cycle against the House Democrats median
RowRossMedian
2026 cycle7%13%
2024 cycle11%13%
2022 cycle13%13%
2020 cycle19%13%

Where itemized donors live

Individuals who gave more than $200, by donor state

Alaska: no dataAKMaine: no dataMEVermont: no dataVTNew Hampshire: $2,750NHWashington: $1,500WAIdaho: $1,000IDMontana: $1,000MTNorth Dakota: no dataNDMinnesota: no dataMNIllinois: $3,750ILWisconsin: $750WIMichigan: no dataMINew York: $34.4KNYRhode Island: no dataRIMassachusetts: $10.8KMAOregon: $500ORNevada: no dataNVWyoming: no dataWYSouth Dakota: $500SDIowa: $1,000IAIndiana: $1,000INOhio: $4,500OHPennsylvania: $3,000PANew Jersey: $9,333NJConnecticut: $3,300CTCalifornia: $74.8KCAUtah: $1,500UTColorado: $500CONebraska: no dataNEMissouri: $2,500MOKentucky: $1,500KYWest Virginia: $1,000WVVirginia: $11.7KVAMaryland: $10.3KMDDelaware: no dataDEArizona: $3,000AZNew Mexico: no dataNMKansas: $2,000KSArkansas: no dataARTennessee: $7,000TNNorth Carolina: $631.3KNCSouth Carolina: $3,805SCDistrict of Columbia: $9,800DCOklahoma: $500OKLouisiana: no dataLAMississippi: $500MSAlabama: $2,000ALGeorgia: $8,500GAHawaii: $1,000HITexas: $10.3KTXFlorida: $20.7KFL
Show the data
Ross's itemized individual contributions by donor state, 2026 cycle
StateValue
North Carolina$631.3K
California$74.8K
New York$34.4K
Florida$20.7K
Virginia$11.7K
Massachusetts$10.8K
Maryland$10.3K
Texas$10.3K
District of Columbia$9,800
New Jersey$9,333
Georgia$8,500
Tennessee$7,000
Ohio$4,500
South Carolina$3,805
Illinois$3,750
Connecticut$3,300
Pennsylvania$3,000
Arizona$3,000
New Hampshire$2,750
Missouri$2,500
Kansas$2,000
Alabama$2,000
Washington$1,500
Utah$1,500
Kentucky$1,500
Idaho$1,000
Montana$1,000
Iowa$1,000
Indiana$1,000
West Virginia$1,000
Hawaii$1,000
Wisconsin$750
Oregon$500
South Dakota$500
Colorado$500
Oklahoma$500
Mississippi$500
AlaskaNo data
MaineNo data
VermontNo data
North DakotaNo data
MinnesotaNo data
MichiganNo data
Rhode IslandNo data
NevadaNo data
WyomingNo data
NebraskaNo data
DelawareNo data
New MexicoNo data
ArkansasNo data
LouisianaNo data
826

itemized donors

People who gave more than $200

71%

from North Carolina

Of itemized individual dollars

How to read the map

Every state the same size. Darker states gave more itemized money; hatched states had no itemized donors; the outlined state is North Carolina. Gifts of $200 or less carry no address and are left out.

Donors’ ideology

Distribution of itemized donors’ own CSIP scores

CSIP −1.50 to −1.25: 0.1%CSIP −1.25 to −1.00: 49%49%CSIP −1.00 to −0.75: 39%CSIP −0.75 to −0.50: 3.6%CSIP −0.50 to −0.25: 2.4%CSIP −0.25 to 0.00: 1.9%CSIP 0.00 to +0.25: 1.9%CSIP +0.25 to +0.50: 0.7%CSIP +0.50 to +0.75: 0.5%CSIP +0.75 to +1.00: 0.2%← More liberalMore conservative →0
Show the data
Ideology of Ross's itemized donors in 2026, from −1.50 to +1.00: 49% between −1.25 and −1.00, 39% between −1.00 and −0.75.
ItemValue
CSIP −1.50 to −1.250.1%
CSIP −1.25 to −1.0049%
CSIP −1.00 to −0.7539%
CSIP −0.75 to −0.503.6%
CSIP −0.50 to −0.252.4%
CSIP −0.25 to 0.001.9%
CSIP 0.00 to +0.251.9%
CSIP +0.25 to +0.500.7%
CSIP +0.50 to +0.750.5%
CSIP +0.75 to +1.000.2%
How to read the columns

Donors who give to many candidates get their own CSIP score. Each column is the share of Ross’s itemized money from donors in that part of the scale, blue left of 0 and red right of 0, deeper further out; Ross’s own score is −1.08.

Top donor occupations

Itemized, 2026 cycle.

  1. NOT EMPLOYED$289.7K 294 donors
  2. ATTORNEY$92.3K 91 donors
  3. REAL ESTATE BROKER$71.7K 112 donors
  4. RETIRED$39.1K 44 donors
  5. CEO$24.0K 12 donors

Top committees

PAC and committee contributions, 2026 cycle.

  1. AIR LINE PILOTS ASSOCIATION PAC$10.0K
  2. AMERICAN CRYSTAL SUGAR COMPANY POLITICAL ACTION COMMITTEE$10.0K
  3. AMERICAN FEDERATION OF STATE COUNTY & MUNICIPAL EMPLOYEES P E O P L E$10.0K
  4. AMERICAN PHYSICAL THERAPY ASSOCIATION PHYSICAL THERAPY POLITICAL ACTION COMMITTEE (PT-PAC)$10.0K
  5. APPLIED RESEARCH ASSOCIATES, INC. POLITICAL ACTION COMMITTEE (ARAPAC)$10.0K

Top employers

Itemized, 2026 cycle.

  1. METLIFE INC$39.7K 17 donors
  2. AFFORDABLE COMMUNITIES GROUP LLC$14.0K 3 donors
  3. MCGUIREWOODS$4,350 3 donors
  4. PARKER POE$3,500 3 donors
  5. NC STATE UNIVERSITY$2,415 4 donors

Aggregates only. Individual donors are never named.

Back to topNext: Votes

Votes

Ross voted with the majority of House Democrats on 99.1% of party-line votes and missed none of 687 roll calls. House Democrats on average: 96.3% party unity, 96.9% attendance. Across all roll calls, Ross voted against the majority of House Democrats 7 times.

687 roll calls Ross could vote on in the 119th Congress, compared with House Democrats. Attendance is the share with a vote recorded. Party unity counts only party-line roll calls, where most Democrats and most Republicans voted on opposite sides, and is the share of those where Ross voted with the majority of House Democrats. The count of votes against that majority covers every roll call where the majority took a side.

7

votes against the majority of House Democrats

Party unity 99.1%, House Democrats average 96.3%, ranks 70th of 217. 687 roll calls in the 119th Congress.

Attendance and party unity

The thick bar is Ross, the thin grey bar the House Democrats average. The scale runs from 80% to 100% to show the gap.

80%100%
Ross
Peers
Rank
Attendance
100%
96.9%
10th of 217
Party unity
99.1%
96.3%
70th of 217
Show the data
Ross's attendance and party unity against House Democrats.
RowRossPeers
Attendance100%96.9%
Party unity99.1%96.3%
What this means, and what it doesn’t

A missed roll call has many causes, from illness to campaigning, so attendance says how often, not why. A vote against the majority can be on procedure as well as substance, and many fall on roll calls where both parties split; the key votes below show the ones that decided something.

Key votes

25 roll calls the lab flagged as key in the 119th Congress

Key votes
Party split (yea–nay)Why it’s key
Nov 17, 2026
H.R. 9600
Common Sense 250 Act
On Motion to Suspend the Rules and Pass
YeaWith majorityPassedD 202–0 · R 163–36Democrats 202 yea, 0 nay; Republicans 163 yea, 36 nayparty crossover
Nov 11, 2026
H.R. 1013
Retirement Fairness for Charities and Educational Institutions Act
On Passage
NayWith majorityPassedD 83–128 · R 211–0 · I 1–0Democrats 83 yea, 128 nay; Republicans 211 yea, 0 nay; Independents 1 yea, 0 nayparty crossover
Sep 16, 2026
S. 2403
Retire through Ownership Act
On Motion to Suspend the Rules and Pass
YeaWith majorityPassedD 209–0 · R 191–14 · I 1–0Democrats 209 yea, 0 nay; Republicans 191 yea, 14 nay; Independents 1 yea, 0 naybecame law
Sep 16, 2026
H.J.Res. 213
Providing for congressional disapproval under chapter 8 of title 5, United States Code, of the rule issued by the Environmental Protection Agency relating to the “California State Nonroad Engine Pollution Control Standards; Commercial Harbor Craft Regulations; Notice of Decision”
On Passage
NayWith majorityPassedD 3–207 · R 210–1 · I 1–0Democrats 3 yea, 207 nay; Republicans 210 yea, 1 nay; Independents 1 yea, 0 nayclose vote
Sep 16, 2026
H.R. 10326
PROOF Act
On Passage
NayWith majorityPassedD 6–206 · R 210–1 · I 1–0Democrats 6 yea, 206 nay; Republicans 210 yea, 1 nay; Independents 1 yea, 0 nayclose vote
How key votes are chosen

Automatically: a final-passage or override vote where the measure became law, the margin was under 10%, at least 10% of either party voted against its majority, or the bill was among the 25 most mentioned in officials’ own statements. Up to 25 per window, most recent first; five are shown. Bars show yea on the left, nay on the right, per party.

Votes most often with

The colleagues who voted the same way as Ross most often

  1. Kelly MorrisonD682 shared votes99%
  2. Johnny OlszewskiD681 shared votes99%
  3. Glenn IveyD675 shared votes99%
  4. Madeleine DeanD675 shared votes99%
  5. James WalkinshawD437 shared votes99%

Votes least often with

The colleagues who voted the same way as Ross least often

  1. Chip RoyR644 shared votes17%
  2. Ralph NormanR607 shared votes18%
  3. Eric BurlisonR654 shared votes19%
  4. Josh BrecheenR649 shared votes19%
  5. Keith SelfR671 shared votes19%
How to read the agreement lists

The share of roll calls both members voted on where they voted the same way, among colleagues sharing at least 50 such votes. High agreement with members of the other party is common on routine votes.

Full voting record

119th Congress (2025–27), loads in batches

Back to topNext: Legislation

Legislation

Ross sponsored 35 bills in the 119th Congress; none became law. Cosponsored 654 others. 0% of sponsored bills got out of committee (House Democrats average 4.9%; 173rd of 209).

The bills Ross sponsored and cosponsored in the 119th Congress, from the official bill records, and how far each got: introduced, referred to or acted on in committee, passed one chamber, passed both, became law. A bill counts at every stage it has reached, so the blocks only shrink to the right.

Bills by stage

Counts for the 119th Congress

Sponsored35 billsSponsored, Introduced: 3535Sponsored, In committee: 3535Sponsored, Passed one chamber: 00Sponsored, Passed both chambers: 00Sponsored, Became law: 00Cosponsored654 billsCosponsored, Introduced: 654654Cosponsored, In committee: 654654Cosponsored, Passed one chamber: 2222Cosponsored, Passed both chambers: 44Cosponsored, Became law: 22IntroducedIncommitteePassed onechamberPassed bothchambersBecamelaw
Show the data
Bills Ross sponsored and cosponsored, by furthest stage reached
RoleIntroducedIn committeePassed one chamberPassed both chambersBecame law
Sponsored3535000
Cosponsored6546542242
How to read the blocks

Ink blocks are bills Ross sponsored, ochre blocks bills Ross cosponsored; the figure above each block is the count. Most bills in any legislature never leave committee, so a short staircase is the norm.

0%

of sponsored bills got out of committee

House Democrats average 4.9%. Ranks 173rd of 209.

Cosponsorship partners

Colleagues who most often cosponsor with Ross, by number of shared bills in the 119th Congress; the square shows their party.

  1. Eleanor Norton89
  2. Valerie Foushee43
  3. Brian Fitzpatrick37
  4. Rashida Tlaib36
  5. Donald Davis36
What this means, and what it doesn’t

The score is the share of sponsored bills that a committee reported out or a chamber passed, with at least 5 sponsored bills, ranked within the peer group. Members of the majority party and committee chairs move more bills, so the rank reflects position in the chamber as well as effort. Cosponsorship partners are the five colleagues who share the most of Ross’s bills; the toggle shows more.

Bill list

Sponsored and cosponsored, with status and policy area; five are shown, the toggle shows the rest

Bills sponsored and cosponsored
H.R. 11081↗ official page (opens in a new tab)ACCELERATE ActCosponsorNov 19, 2026In committeeEducationReferred to the House Committee on Education and Workforce. Nov 19, 2026
H.R. 11117↗ official page (opens in a new tab)To amend the Public Health Service Act to authorize grants to States, Indian Tribes, Tribal organizations, and political subdivisions thereof to hire, employ, train, and dispatch mental health professionals to respond in lieu of law enforcement officers in emergencies involving one or more persons wCosponsorNov 19, 2026In committeeUnassignedReferred to the Committee on Energy and Commerce, and in addition to the Committee on the Judiciary, for a period to be subsequently determined by the Speaker, in each case for consideration of such provisions as fall within the jurisdiction of the committee concerned. Nov 19, 2026
H.Res. 1672↗ official page (opens in a new tab)Recognizing violence against women in politics as a global phenomenon and supporting women's full and equal participation in political life.CosponsorNov 19, 2026In committeeUnassignedReferred to the House Committee on the Judiciary. Nov 19, 2026
H.R. 11062↗ official page (opens in a new tab)Fighting Post-Traumatic Stress Disorder Act of 2026CosponsorNov 18, 2026In committeeUnassignedReferred to the House Committee on the Judiciary. Nov 18, 2026
H.R. 11050↗ official page (opens in a new tab)Support Through Loss ActCosponsorNov 17, 2026In committeeUnassignedReferred to the Committee on Education and Workforce, and in addition to the Committees on House Administration, Oversight and Government Reform, the Judiciary, and Energy and Commerce, for a period to be subsequently determined by the Speaker, in each case for consideration of such provisions as fall within the jurisdiction of the committee concerned. Nov 17, 2026

Back to topNext: Lawmark

Lawmark Achievement Scores

Ross’s Lawmark Achievement Score in the 119th Congress stands at −0.1. The 90% interval runs from −1.7 to +1.3, which takes in the median for the House (+1.0): the score is not distinguishable from the typical House member’s. Position contributes −0.1 and Ross’s personal part 0.0.

The Lawmark Achievement Score measures how far a member’s own bills get against how far the same bills would be expected to get with another sponsor, step by step: committee action, leaving committee, passing the chamber, passing the other chamber, becoming law. It adds two parts. The part from position is what the member’s posts are worth (the majority party, chairs, ranking seats, leadership, seniority); the personal part is what the member adds beyond them. The unit is one standard deviation of members’ personal parts, and 0 is a first-term member of the minority with no committee post and an average personal record.

−0.1

Lawmark Achievement Score, 119th Congress

90% interval −1.7 to +1.3. Provisional: the Congress is still under way.

From position
−0.1 (−0.2 to 0.0)
Personal
0.0 (−1.5 to +1.4)

Posts held: minority party · subcommittee ranking member · 3rd Congress in the chamber.

With Ross as sponsor, 0.7% of the House’s own bills in the 119th Congress would become law (90% interval 0.3% to 1.1%), against 1.0% for the median House member.

32 bills sponsored: 1 saw committee action, 1 left committee, 0 passed the House, 0 became law.

Ross in the 119th Congress

The grey ticks are the 429 members of the House with at least five bills; the line is their median score

−2.00.0+2.0+4.0+6.0+8.0Median +1.0Score: −0.1 (90% interval −1.7 to +1.3)−0.1Scoreposition + personalFrom position: −0.1 (90% interval −0.2 to 0.0)−0.1From positionPersonal: 0.0 (90% interval −1.5 to +1.4)0.0Personal
Show the data
Ross’s Lawmark Achievement Score in the 119th Congress −0.1 (90% interval −1.7 to +1.3), from position −0.1, personal 0.0; the chamber median is +1.0.
PartEstimate90% interval
Score (position + personal)−0.1−1.7 to +1.3
From position−0.1−0.2 to 0.0
Personal0.0−1.5 to +1.4
What this means, and what it doesn’t

The score credits a member for bills that move, not for bills filed: a member who introduces two hundred bills and sees six become law scores below one who introduces twenty and sees five. Each bill is compared with bills like it (its policy area, when in the Congress it was introduced, how many committees it went to, whether it is commemorative or an appropriations bill, how significant it looked when introduced), so an easy bill earns less than a hard one. Every score carries a 90% interval; where two members’ intervals overlap, the data do not tell them apart.

A Congress still under way is provisional: pending bills are counted as still able to move, on the schedule bills kept in past Congresses, and the score will change as they do. With fewer than five bills in a Congress, Ross’s own contribution cannot be measured, and only the part from position is shown.

A methods paper on how the scores are estimated, and how to reproduce them, is forthcoming.

Congress by Congress

Newest first

−2.0−1.00.0+1.0+2.0+3.0+4.0119th: −0.1 (90% interval −1.7 to +1.3)−0.1119thHouse, provisional118th: +0.5 (90% interval −1.0 to +1.9)+0.5118thHouse117th: +2.1 (90% interval +0.6 to +3.5)+2.1117thHouse
Show the data
Ross’s Lawmark Achievement Score by Congress: 119th −0.1; 118th +0.5; 117th +2.1.
CongressScore90% interval
119th (House, provisional)−0.1−1.7 to +1.3
118th (House)+0.5−1.0 to +1.9
117th (House)+2.1+0.6 to +3.5
How to read the rows

Each row is one Congress: the dot is the score and the bar its 90% interval. An open gold dot is the part from position alone, shown where Ross had fewer than five bills. Scores compare members within a chamber and Congress; a member’s own scores are linked across Congresses, so a long record steadies each one.

Lawmark text in law

Words of enacted text that came from Ross’s bills in the 119th Congress

No text from Ross’s bills of the 119th Congress is in a law yet.

Bill progress share

Volden–Wiseman method

0.37

119th Congress

1.0 is the average member of the House; a member with the same posts would be expected to reach 0.5, so this is in line with expectations.

The standard count: the member’s share of the chamber’s bills at each stage (introduced, committee action, out of committee, passed the chamber, became law), with commemorative bills counting least and significant ones most, scaled so the chamber averages 1. It rewards volume as well as success; the Lawmark Achievement Score does not.

Back to topNext: Online

Online

A site that changed 46 times in 90 days. Ross’s official site had 34 pages when last crawled on Nov 22, 2026. The lab last catalogued the images Ross posted on Nov 20, 2026.

The lab crawls Ross’s official and campaign websites (weekly for Congress, monthly for the states) and keeps every page’s text, so changes can be read later; it also records social accounts and describes the images Ross posts with a vision model.

Websites

  • Official site

    ross.house.gov

    Last crawled Nov 22, 2026

    34

    pages crawled

    46

    changes in 90 days

  • Campaign site

    deborahross.com

    Last crawled Nov 22, 2026

    32

    pages crawled

    157

    changes in 90 days

How to read the counts

“Pages crawled” is the size of the site at the last crawl; “changes in 90 days” counts pages whose text differed from the previous crawl. Sites change for many routine reasons, such as new press releases, so a high count is not by itself notable.

Social accounts

Images Ross posted

The latest 24, with model-written descriptions

  • A group of formally dressed adults pose for a photo in an ornate interior with framed artwork, a display stand, and a chair. There is text on the stand.
    A group of formally dressed adults pose for a photo in an ornate interior with framed artwork, a display stand, and a chair. There is text on the stand.View post
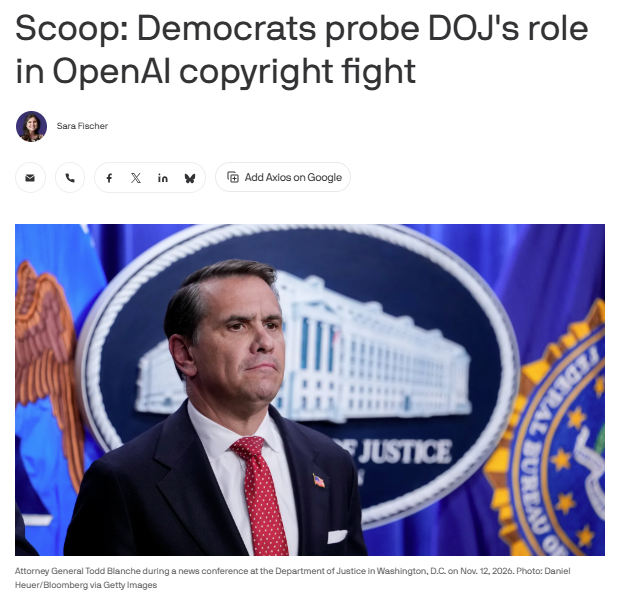
  • A screenshot of a news article page with a large headline, author information and sharing icons above a photograph of a suited man at a Department of Justice news conference, with official emblems and a blue backdrop behind him. There is also a photo caption and other text.
    A screenshot of a news article page with a large headline, author information and sharing icons above a photograph of a suited man at a Department of Justice news conference, with official emblems and a blue backdrop behind him. There is also a photo caption and other text.View post
  • A political graphic announces a proposed PTSD-related act, with a document-style image of a bill attributed to a member of Congress. The background has a red, white, and blue flag motif, and there is prominent text.
    A political graphic announces a proposed PTSD-related act, with a document-style image of a bill attributed to a member of Congress. The background has a red, white, and blue flag motif, and there is prominent text.View post
  • A political graphic featuring a quotation about the mental health risks faced by first responders and law enforcement officers, over a pink and purple background with a stethoscope and North Carolina imagery.
    A political graphic featuring a quotation about the mental health risks faced by first responders and law enforcement officers, over a pink and purple background with a stethoscope and North Carolina imagery.View post
  • Three women pose indoors for a photo; the two younger women hold blue certificate folders. There is visible text on the folders.
    Three women pose indoors for a photo; the two younger women hold blue certificate folders. There is visible text on the folders.View post
About the descriptions

Written by a vision model and may be wrong. Open the post to see the original. Five are shown; the toggle shows the rest.

Back to topNext: Methods and sources

Methods and sources

How this page was made. Profile built Nov 22, 2026; site last built Nov 22, 2026. Every number on the page is computed from the sources listed here, by the same rules for every official; nothing is written by hand.

The headline

The headline is the measure on which Ross is most unusual among House Democrats, chosen by one rule for every official of every party. The candidates are the rate of each kind of statement and of extreme labels, party unity, attendance, the small-donor share, the in-state share and total receipts of the latest cycle, the share of sponsored bills that got out of committee, talk-to-bills agreement, and the CSIP score’s place within the party group.

The builder ranks every measure within the same peer group the page compares it with, and writes each official’s percentile: the share of the group below the value, ties counting half, so 0.5 is the median and a value shared by many never ranks first. A measure’s score is how far that percentile sits from the median (0 in the middle, 0.5 at either end), and the highest score leads if it is above 0.25, outside the middle half of the group. Scores within 0.03 of each other are a tie, broken in this order: votes against the party majority, kinds of statement, ideology, roll calls missed, small donations, in-state money, legislation, agreement, extreme labels, receipts.

A measure counts only with at least 200 statements, 100 roll calls or 5 sponsored bills behind it and a peer group of at least 10. Two things never lead: high party unity or attendance, where most members sit, and a high rate of a kind of statement backed by fewer than 10 statements. When nothing qualifies, the headline is a neutral fact instead: statements classified, or years in office. The wording always names the direction (“in the bottom 5% of …”, “votes against the majority of …”).


Identifiers

Profile id
R000305
Bioguide
R000305
FEC candidate ids
H0NC02125

Bulk files with the same data for every official:

Freshness of this profile’s data

  • What politicians sayNov 21, 20261 days agoMembers of Congress: tweets since 2017; press releases, newsletters and floor speeches since 2022. State legislators: tweets since May 2024. Governors: tweets since January 2025. Labels from an LLM classifier.
  • Roll calls (Congress)Nov 20, 20262 days agoVoteview roll calls, 113th Congress (2013) on.
  • Bills (Congress)Nov 20, 20262 days agoGovInfo BILLSTATUS: sponsors, cosponsors, actions, CRS policy area.
  • Lawmark Achievement Scores (Congress)Nov 13, 20269 days agoLawmark Achievement Scores, Lawmark text in law and the bill progress share, every Congress from the 113th (2013), from the bill status files, the printed bill texts and public committee rosters; weekly.
  • Campaign money (FEC)Nov 20, 20262 days agoFEC committee financial summaries (totals, small donations) and itemized contributions (donor counts, states, employers), the 2020 cycle on; aggregates only.
  • Ideology (CSIP)Nov 3, 202619 days agoCommon-Space Ideal Points (CSIP), current validated run.
  • WebsitesNov 22, 2026todayWeekly crawls of federal sites since April 2026; monthly state crawls since June 2026.
  • ImagesNov 22, 2026todayImages in members' tweets with vision-model descriptions.

How the measures work

What politicians say
Every post, press release, newsletter and congressional floor speech is read by a language model and marked for personal attacks, policy criticism, policy discussion, bipartisanship and credit claiming. A statement can be in several. Rates are shares of statements in the window. The methods paper.
Extreme labels
A statement has an extreme label when it calls a politician, party or policy “far left”, “far right”, “MAGA”, “extreme”, “radical”, “woke”, “fascist” or “communist”. The target is who the label is aimed at.
Policy areas and agreement
Statements and bills share 25 Congressional Research Service policy areas (state bills are assigned by a language model). Agreement is 1 − Jensen–Shannon distance between the two distributions, shown with at least 20 policy statements and 5 bills.
Ideology (CSIP)
Common-Space Ideal Points place federal and state officials on one left–right scale, estimated jointly from roll calls, campaign contributions and the text of statements, with standard errors. Only a validated run is shown. The methods paper.
Campaign money
Campaigns report by name only donors who give more than $200 in a cycle; smaller gifts are reported as one total. Federal totals and the small-donor share come from the FEC’s financial summaries of each campaign committee. Donor counts, donor states, employers and occupations cover itemized donors only. State filings report no small-gift totals, so state figures are itemized only. The lab never publishes donor names.
Votes and key votes
Attendance, party unity and the count of votes against the majority of an official’s own party come from roll calls (Voteview for Congress, chamber records for the states). Key votes are final-passage or override votes that became law, were decided by under 10%, saw at least 10% of a party vote against its majority, or concerned one of the 25 bills most mentioned in officials’ statements.
Peers and ranks
Comparisons are with the same party, chamber and level (for example House Democrats); state legislators are compared within their state and chamber for votes. Every comparison names its group. Rank 1 is the highest value in the group; tied values share the average of their ranks, and the percentile is the share of the group below the value, ties counting half.

America’s Political Pulse · Polarization Research Lab

Back to top